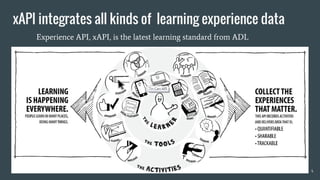
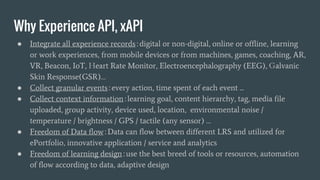
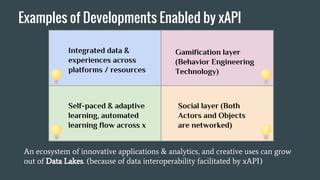
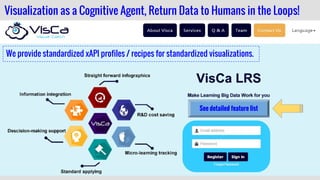
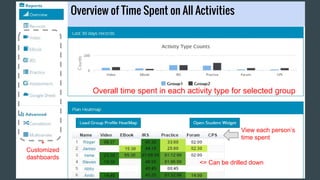
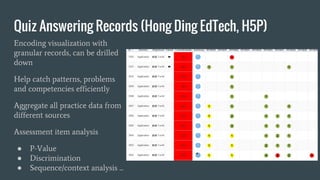
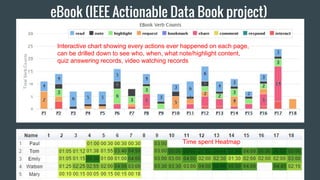
Make Learning Big Data Work For You
XAPI Analytics
Jessie Chuang
www.VisualCatch.org
Classroom-aid.com
Learning
Planning
LRS
Activity/Agent Profile API
IRS, Quiz service
(e.g.HDtech, H5P)
Integration of Workflow and Data flow *Adaptive design
*Branches/options
Videos or MOOC platform
Mobile Apps
IoT
Wearable
AR
VR ...
Real behavior data sent to
Game/ Gamification/
reporting platforms
Why Experience API, xAPI
● Ready data integration no matter where learning happens
● Record any new experience without limitation, driven by
community
● Gain deeper insights into learning process, accumulate
collective intelligence for different stakeholders
● Data reuse is very efficient (data is the new oil)
Why xAPI is a
game changer?
Freedom of data flow
Distributed Learning Ecosystem
Unified data structure and document
APIs (state, activity, learner)
Specialized technologies working
together without pain
Freedom of learning design with best
breed of choices & innovations
Examples of Developments Enabled by xAPI
Social layer (Both
Actors and Objects
are networked)
Gamification layer
or Behavior Engineering
Technology
Self-paced & adaptive
learning, automated
learning flow across x
Integrated data &
experiences across
platforms / resources
An ecosystem of innovative applications & analytics, and creative uses can grow
out of Data Lakes. (because of data interoperability facilitated by xAPI)
Build projects upon
analytics backbone
with
data structure,
Semantic,
visualization
interoperability
Standardized xAPI Profiles/ Recipes /
Vocabularies for basic modules
Standardized visualizations design
Embeddable visualizations to be
monitored along with other data for
goal management
xAPI implementation & statement /
viz design for case-oriented behaviors
Hierarchy Design for Effective Visualization & Analysis
We provide standardized xAPI profiles / recipes for standardized visualizations.
Item level:
MCQs
Prompts
Quests
….
Test level:
Summative assess.
Formative assess.
Group polling
….
Raw level:
Videos
Texts
….
LO/Activity
UDL options
Competency
aligned
Authoring Tools
Learning Design Tools
Learning Patterns / Pedagogies / Gamification
Metrics:
Duration / Time Stamp
Response
Completion / Attempts / Usages(e.g. skip)
Metrics:
Duration / Time Stamp / Attempts
Score / Success / Rating
Affective states / Communicate, Collaborate
Metrics:
Patterns vs. Performance
Questions to be answered
Visualization
Communication
Action(able)
Iteration
Rule-based recommender <=>
Customized
Dashboards
A dashboard is a visual display of
the most important information
needed
to achieve one or more
objectives
that has been consolidated on a
single computer screen
so it can be
monitored at a glance. (provides an
overview)
-- Stephen Few
Educator / Learning Designer
Learner / Parent
Content Creator / Publisher
HR / Business Line Manager
Process Matters!
From content-oriented to experience-oriented design
Data + Design = Behavior Engineering
From fix mindset to growth mindset
Return process data to learners in real time
Citation: http://www.tandfonline.com/doi/pdf/10.1080/23265507.2015.1074870
The whole picture =
Training and Learning Architecture(TLA)
● ePortfolio
● Learner modeling
● Machine readable
● Competency
standards
● Knowledge map
● Standard
alignment
● xAPI COP
● Common
vocabulary
● Learning
Design
● Sharing of
metadata &
paradata
● Re-usability
● Semantic analysis
We provide standardized xAPI profiles/ recipes for standardized visualizations.
Visualization as a Cognitive Agent, Return Data to Humans in the Loops!
feature list
Analytics backbone
+
Customized
dashboards
<= Can be drilled down
View each person’s
time spent
Overall time spent in each activity type for selected group
Overview of Time Spent on All Activities
Overview on Timeline
1. Group vs. individual
2. Filtering by activityType, activity id, verb, profile
Video
drill down
click to drill down
drill down
eBook (IEEE Actionable Data Book project)
Interactive chart showing every actions ever happened on each page,
can be drilled down to see who, when, what note/highlight content,
quiz answering records, video watching records
Time spent Heatmap
Quiz Answering Records
Encoding visualization with
granular records and standards,
can be drilled down
Help catch patterns, problems
and competencies efficiently
Aggregate all practice data from
different sources
Assessment item analysis
● P-Value
● Discrimination
● Sequence/context analysis ...
Quiz Answer Process
(drilled down)
Use hint/feedback? how long?
Time spent
How many tries?
Which device?
Multivariate Analysis
Which verb counts matter? (“noted” in this case )
Correlation Analysis
In this example, learners in 4 quadrants have different needs
To correlate and find factors that matter to your metrics
See who’s learned this
-- a peak of social layer on top of different activities
Verb cloud
(color matched to the taxonomy level)
Verb taxonomy visualization (points reward higher order verbs)
Hint : Charting Verbs stat. vs. time can see behavior trend
Connecting with
Learning Analytics
Community
From Dr, Kitto, QUT
=> Active Learning Squared
Our Current User Base
This project is being implemented in Taipei city, Taiwan. All
teachers and students, about 350,000 in number, in Taipei city
will be using this solution (later other areas will join); the public
department is working towards building an ecosystem (from
collaboration of public departments, schools, vendors, scholars,
and developers) based on xAPI standard and open learning data
as Open Data.
Let’s talk!
http://service.classroom-aid.com/
mlearning@classroomaid.org
We like to work with
learning technology and
content providers.
Basic visualization services
are free for education
institutions.
Case Studies:
● Leveraging #xAPI to Transform Your Learning Content and Solution
● Across System Learning Environment and Dashboard Design for Education (#xAPI)
● A Teacher with AcrossX Solution Enabled by #xAPI
● Our visualization in IEEE ADB demo
We follow ADL xAPI Vocab. Spec.& best practices: (the first LRS)
● Guidelines for IRI Design and Persistence
● Controlled Vocabulary Considerations for the Experience API (xAPI)
● Relationship Between xAPI Vocabularies, Profiles, and Recipes
● ADL xAPI Vocabulary Spec. & Vocabulary Primer (Feb., 2016)
● Our registry (with help from ADL): https://w3id.org/xapi/acrossx
● Our profiles/recipes: http://wiki.visualcatch.org/en/recipes.html (Gitbook)

Make Learning Big Data Work For You

  • 1.
    Make Learning BigData Work For You XAPI Analytics Jessie Chuang www.VisualCatch.org Classroom-aid.com
  • 2.
    Learning Planning LRS Activity/Agent Profile API IRS,Quiz service (e.g.HDtech, H5P) Integration of Workflow and Data flow *Adaptive design *Branches/options Videos or MOOC platform Mobile Apps IoT Wearable AR VR ... Real behavior data sent to Game/ Gamification/ reporting platforms
  • 3.
    Why Experience API,xAPI ● Ready data integration no matter where learning happens ● Record any new experience without limitation, driven by community ● Gain deeper insights into learning process, accumulate collective intelligence for different stakeholders ● Data reuse is very efficient (data is the new oil)
  • 5.
    Why xAPI isa game changer? Freedom of data flow Distributed Learning Ecosystem Unified data structure and document APIs (state, activity, learner) Specialized technologies working together without pain Freedom of learning design with best breed of choices & innovations
  • 6.
    Examples of DevelopmentsEnabled by xAPI Social layer (Both Actors and Objects are networked) Gamification layer or Behavior Engineering Technology Self-paced & adaptive learning, automated learning flow across x Integrated data & experiences across platforms / resources An ecosystem of innovative applications & analytics, and creative uses can grow out of Data Lakes. (because of data interoperability facilitated by xAPI)
  • 7.
    Build projects upon analyticsbackbone with data structure, Semantic, visualization interoperability Standardized xAPI Profiles/ Recipes / Vocabularies for basic modules Standardized visualizations design Embeddable visualizations to be monitored along with other data for goal management xAPI implementation & statement / viz design for case-oriented behaviors
  • 8.
    Hierarchy Design forEffective Visualization & Analysis We provide standardized xAPI profiles / recipes for standardized visualizations. Item level: MCQs Prompts Quests …. Test level: Summative assess. Formative assess. Group polling …. Raw level: Videos Texts …. LO/Activity UDL options Competency aligned Authoring Tools Learning Design Tools Learning Patterns / Pedagogies / Gamification Metrics: Duration / Time Stamp Response Completion / Attempts / Usages(e.g. skip) Metrics: Duration / Time Stamp / Attempts Score / Success / Rating Affective states / Communicate, Collaborate Metrics: Patterns vs. Performance Questions to be answered Visualization Communication Action(able) Iteration Rule-based recommender <=>
  • 9.
    Customized Dashboards A dashboard isa visual display of the most important information needed to achieve one or more objectives that has been consolidated on a single computer screen so it can be monitored at a glance. (provides an overview) -- Stephen Few Educator / Learning Designer Learner / Parent Content Creator / Publisher HR / Business Line Manager
  • 10.
    Process Matters! From content-orientedto experience-oriented design Data + Design = Behavior Engineering From fix mindset to growth mindset Return process data to learners in real time
  • 11.
  • 12.
    The whole picture= Training and Learning Architecture(TLA) ● ePortfolio ● Learner modeling ● Machine readable ● Competency standards ● Knowledge map ● Standard alignment ● xAPI COP ● Common vocabulary ● Learning Design ● Sharing of metadata & paradata ● Re-usability ● Semantic analysis
  • 13.
    We provide standardizedxAPI profiles/ recipes for standardized visualizations. Visualization as a Cognitive Agent, Return Data to Humans in the Loops! feature list
  • 14.
    Analytics backbone + Customized dashboards <= Canbe drilled down View each person’s time spent Overall time spent in each activity type for selected group Overview of Time Spent on All Activities
  • 15.
    Overview on Timeline 1.Group vs. individual 2. Filtering by activityType, activity id, verb, profile
  • 16.
    Video drill down click todrill down drill down
  • 17.
    eBook (IEEE ActionableData Book project) Interactive chart showing every actions ever happened on each page, can be drilled down to see who, when, what note/highlight content, quiz answering records, video watching records Time spent Heatmap
  • 18.
    Quiz Answering Records Encodingvisualization with granular records and standards, can be drilled down Help catch patterns, problems and competencies efficiently Aggregate all practice data from different sources Assessment item analysis ● P-Value ● Discrimination ● Sequence/context analysis ...
  • 19.
    Quiz Answer Process (drilleddown) Use hint/feedback? how long? Time spent How many tries? Which device?
  • 21.
    Multivariate Analysis Which verbcounts matter? (“noted” in this case )
  • 22.
    Correlation Analysis In thisexample, learners in 4 quadrants have different needs To correlate and find factors that matter to your metrics
  • 23.
    See who’s learnedthis -- a peak of social layer on top of different activities
  • 24.
    Verb cloud (color matchedto the taxonomy level) Verb taxonomy visualization (points reward higher order verbs) Hint : Charting Verbs stat. vs. time can see behavior trend
  • 25.
    Connecting with Learning Analytics Community FromDr, Kitto, QUT => Active Learning Squared
  • 26.
    Our Current UserBase This project is being implemented in Taipei city, Taiwan. All teachers and students, about 350,000 in number, in Taipei city will be using this solution (later other areas will join); the public department is working towards building an ecosystem (from collaboration of public departments, schools, vendors, scholars, and developers) based on xAPI standard and open learning data as Open Data.
  • 27.
    Let’s talk! http://service.classroom-aid.com/ mlearning@classroomaid.org We liketo work with learning technology and content providers. Basic visualization services are free for education institutions.
  • 28.
    Case Studies: ● Leveraging#xAPI to Transform Your Learning Content and Solution ● Across System Learning Environment and Dashboard Design for Education (#xAPI) ● A Teacher with AcrossX Solution Enabled by #xAPI ● Our visualization in IEEE ADB demo We follow ADL xAPI Vocab. Spec.& best practices: (the first LRS) ● Guidelines for IRI Design and Persistence ● Controlled Vocabulary Considerations for the Experience API (xAPI) ● Relationship Between xAPI Vocabularies, Profiles, and Recipes ● ADL xAPI Vocabulary Spec. & Vocabulary Primer (Feb., 2016) ● Our registry (with help from ADL): https://w3id.org/xapi/acrossx ● Our profiles/recipes: http://wiki.visualcatch.org/en/recipes.html (Gitbook)