Download as PDF, PPTX
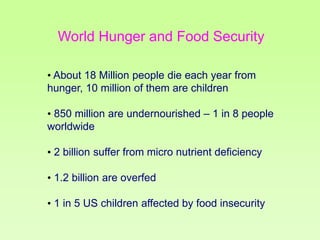
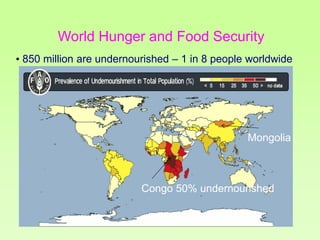
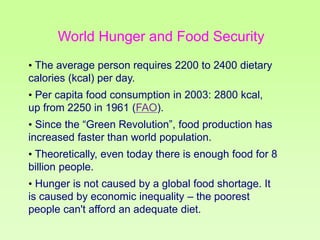
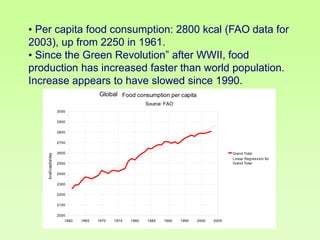
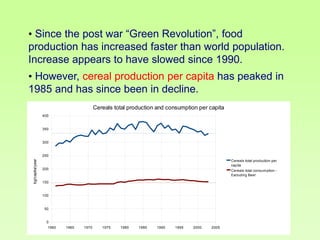
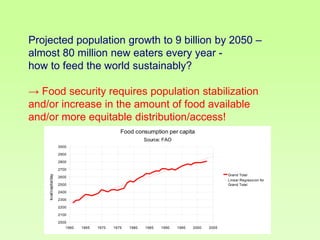
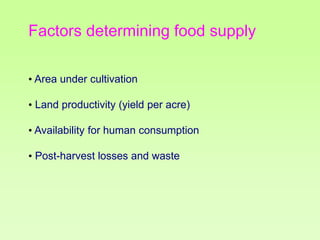
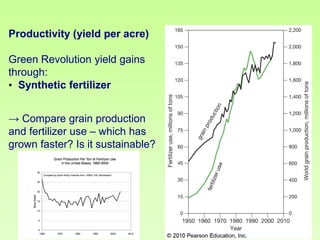
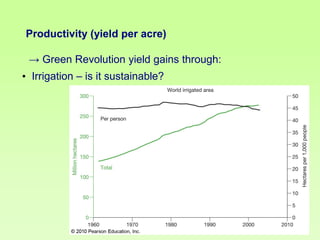
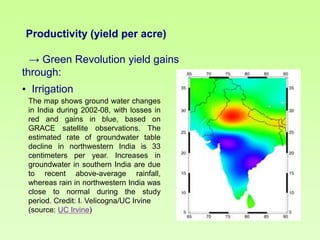
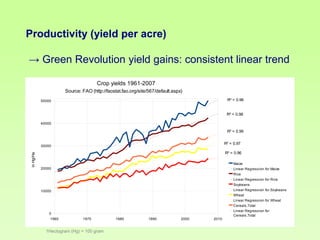
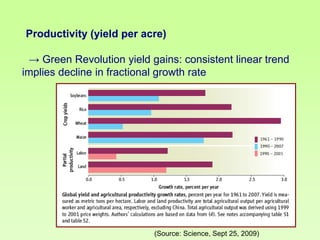
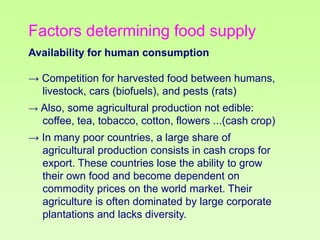
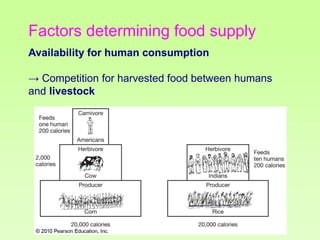

The document discusses global hunger and food security, highlighting that approximately 850 million people are undernourished and that economic inequality, not a food shortage, drives hunger. It outlines factors determining food supply, including land productivity, availability for human consumption, and post-harvest losses, while emphasizing the impact of the green revolution on agricultural practices. To ensure sustainable food security as the population grows, the document calls for strategies focusing on equitable distribution and increasing food availability.