Download as PDF, PPTX

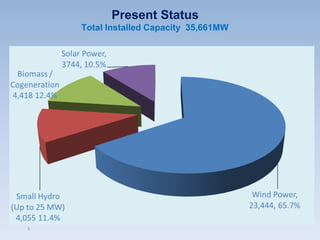
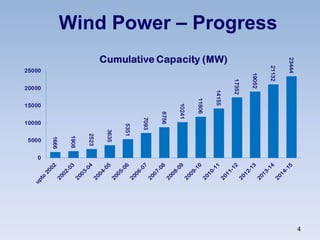
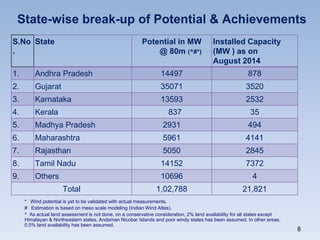
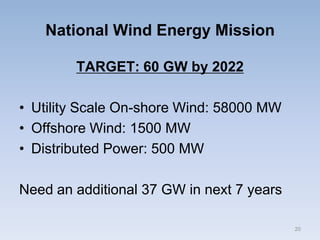


1) Wind power in India has grown significantly in recent years, with total installed capacity reaching 35,661 MW as of present. However, there is still significant potential for further growth as assessments indicate India's wind power potential is over 102,000 MW. 2) India has adopted a commercial and market-oriented approach to developing its wind power sector, establishing a conducive policy framework and allowing private sector investment and participation. Technology development has kept pace with international standards. 3) The government has set a target of reaching 60 GW of installed wind power capacity by 2022 in order to meet growing energy demands through its National Wind Energy Mission. Significant further investment will be required to achieve this ambitious goal.


