
Downloaded 209 times


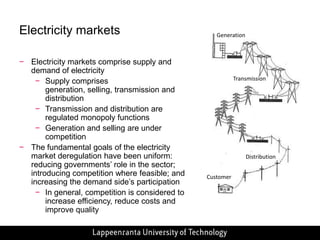

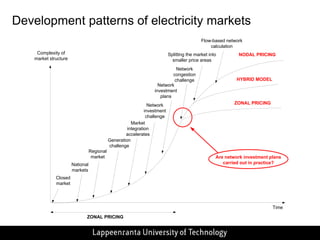
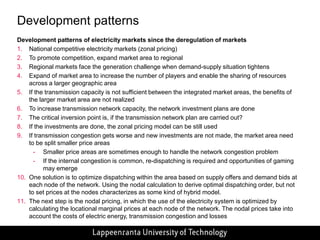
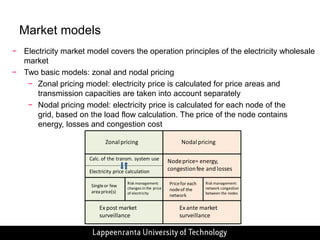
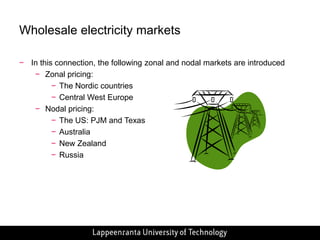
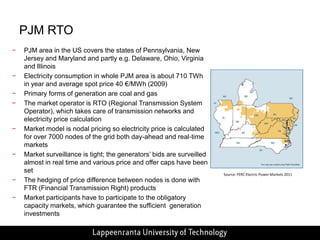
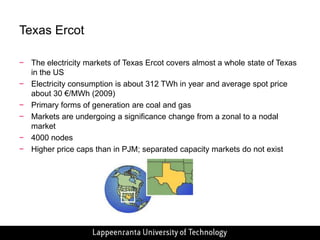
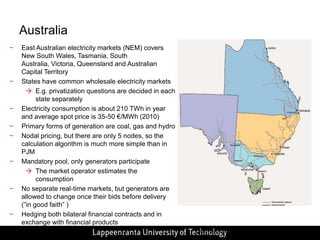
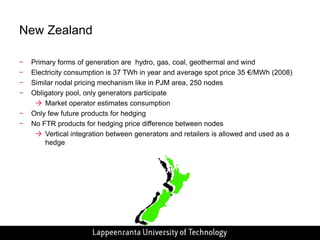


This document presents a vision for integrated European electricity markets in 2030. It discusses the development of electricity markets from national to regional models. As transmission networks expand, markets move from zonal pricing models to increasingly complex nodal pricing models to account for transmission constraints. The document examines existing market models in Europe, including the Nordic countries, Central West Europe, PJM, Texas, Australia and New Zealand; outlining their key features such as pricing mechanisms, generation sources, and consumption levels. The vision is for an efficient European market that ensures secure, affordable and sustainable electricity supply.


