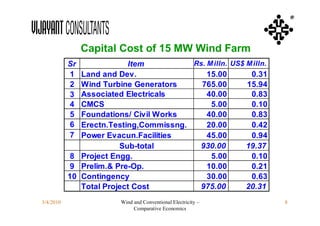
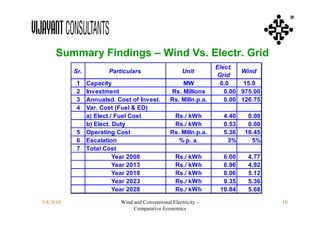
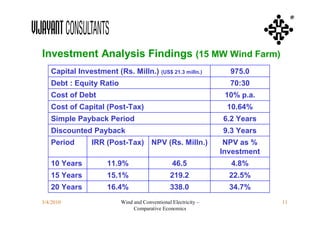
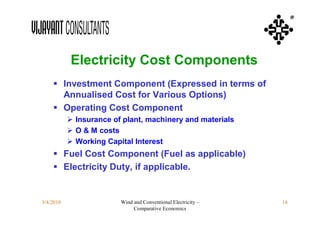
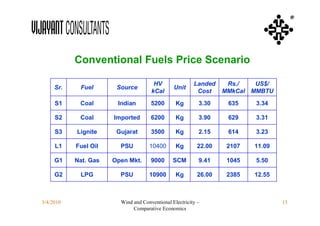
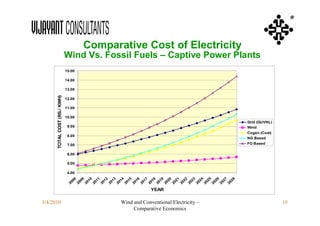
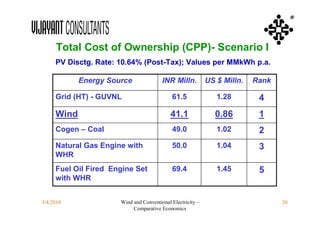
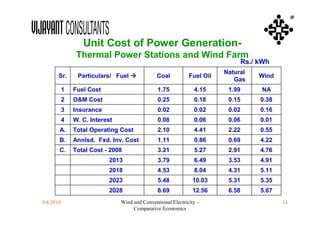
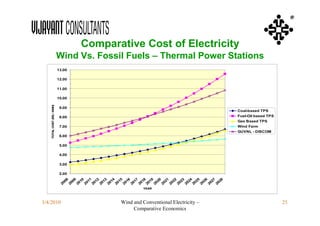
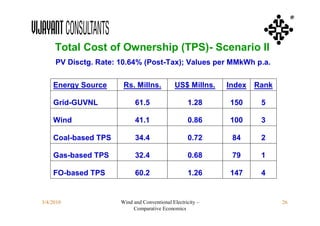
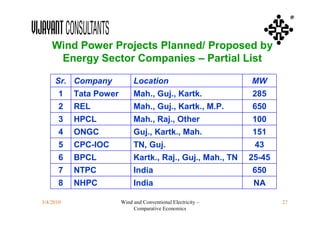
SYNERGY with ENERGY
                  Indian Energy Show 2009
                      National Conference on
           5th        Indian Energy Sector
      Wind and Conventional Electricity-
Comparative Economics for Captive Power Plants
         and Thermal Power Stations
                   Bharat J. Mehta
                Vijayant Consultants
                 Ahmedabad, India
                                        ®


                         June 17, 2009
         Wind and Conventional Electricity–Comparative Economics
®


            Flow of Presentation
   Present Scenario – Opportunities, Recent Trends
    and Technological Advances
   Basic Economic Viability Model for Wind Farm
   Comparative Economics of Wind Electricity vs.
    Conventional Power – Three Scenarios
   Scenario I: Wind Farm vs. Captive Power Plants
   Scenario II: Wind Farm vs. Thermal Power Stations
   Scenario III: Wind Farm specifically for Sale of
    Electricity
   Conclusions

3/4/2010         Wind and Conventional Electricity –    2
                      Comparative Economics
®


           PRESENT SCENARIO


3/4/2010      Wind and Conventional Electricity –   3
                   Comparative Economics
®


           Present Scenario – Opportunities
      Abundant Wind Energy Potential in India
      Installed Capacity of 10,000 MW of Wind Electricity in India
      Target for 10-12% Power Generation from Renewables
      Obligation on State Utilities for Min. Intake of upto 10% of
       Electricity from renewable energy sources, including wind energy
      Wind Energy is the Most Promising and Viable Source of
       Electricity Among Renewables
      Central and State Govt. Policies Are Generally Positive to
       Renewable in General and Wind in Particular
      Availability of Finance from Indian and Overseas Institutions and
       Investors
      Favourable Global Scenario in terms of Technology as well as
       Market Developments
      Implementation of Electricity Act 2003, National Electricity Policy,
       Open Access Regulations, Etc. at Central and State Levels

3/4/2010                  Wind and Conventional Electricity –                 4
                               Comparative Economics
®


           Recent Trends in the Wind Energy Sector
            Increasing costs of fossil fuels, increasing
               variable cost of electrical energy day by day;
              Advancements in wind turbine technology
              Relatively stable capital costs and O & M Costs
               over the years;
              Diminishing role of state subsidies/ incentives;
              Introduction of power sector reforms and
               development of electricity markets;
              CER credits under CDM and REC Mechanism
               for meeting RPO requirements
              Narrowing gap between the costs of generation
               of conventional electricity and wind electricity.
3/4/2010                  Wind and Conventional Electricity –      5
                               Comparative Economics
®


              Technological Advancements
    ON HARDWARE (WIND TURBINE GENERATOR) SIDE
     Increasing rotor diameters
     Increasing hub heights
     Advances in blade design
     Gearless technology
     Micro-processor based local and centralized controls, and,
     Overall Result - Multi-megawatt capacity wind turbines.
     Development of wind turbines for off-shore installations

    ON SOFTWARE SIDE
     Wind Profile Modeling using statistical techniques and software
      programs based on limited wind data and weather conditions
     Programs for wind energy potential at micto-level (Wind Farm
      and WTG)
     MIS for wind farms

3/4/2010                Wind and Conventional Electricity –             6
                             Comparative Economics
®


      BASIC ECONOMIC VIABILITY
        MODEL FOR WIND FARM


3/4/2010     Wind and Conventional Electricity –   7
                  Comparative Economics
®


                Capital Cost of 15 MW Wind Farm
           Sr             Item          Rs. M illn. US$ M illn.
           1  Land and Dev.                 15.00        0.31
           2  Wind Turbine Generators     765.00        15.94
           3  Associated Electricals        40.00        0.83
           4  CMCS                           5.00        0.10
           5  Foundations/ Civil Works      40.00        0.83
           6  Erectn.Testing,Commissng.     20.00        0.42
           7  Power Evacun.Facilities       45.00        0.94
                        Sub-total        930.00         19.37
            8 Project Engg.                  5.00        0.10
            9 Prelim.& Pre-Op.              10.00        0.21
           10 Contingency                   30.00        0.63
              Total Project Cost         975.00         20.31
3/4/2010                Wind and Conventional Electricity –       8
                             Comparative Economics
®


      Basis of Economic Viability of Wind Farm
        1   Installed Capacity (MW)                                15
        2   Project Cost (Rs. Milln.) (US$ 20.31 Milln.)         975.00
        3   Power Gen. (Milln.kWh p.a.)                            30
        4   Elect.Tariff-Var. Part (Rs./kWh) (US$ 0.11/kWh)       5.41
        5   O & M Exp. - 1st Yr. (Rs. Milln.) (US$0.22Milln.)     10.45
        6   Insurance Exp. (Rs. Milln.) (US$ 0.13 Milln.)         6.00
        7   Escaln. in Costs inclg. Ins. (% p.a.)                  5%
        8   Escaln. in Elect. Tariff (% p.a.)                      3%
        9   Deprecn. for wind farm eqpt.                          80%
       10   Amortsn. for P & P, etc.                              10%
       11   Rate of Income-tax                                   33.66%
       12   Cost of Capital (Post-tax)% p.a.                     10.64%
       13   Disctg. Rate for PV Analysis % p.a.                  10.64%
       14   Project Life (Years)                                   20
3/4/2010                   Wind and Conventional Electricity –            9
                                Comparative Economics
®


     Summary Findings – Wind Vs. Electr. Grid
                                                                  Elect.
           Sr.          Particulars                    Unit               Wind
                                                                   Grid
            1    Capacity                            MW             6.0    15.0
            2    Investment                      Rs. Millions        0.00 975.00
            3    Annualsd. Cost of Invest.       Rs. Milln.p.a.      0.00 126.75
            4    Var. Cost (Fuel & ED)
                 a) Elect./ Fuel Cost             Rs./ kWh          4.40    0.00
                 b) Elect. Duty                   Rs./ kWh          0.53    0.00
            5    Operating Cost                  Rs. Milln.p.a.     5.36   16.45
            6    Escalation                         % p. a.          3%      5%
            7    Total Cost
                           Year 2008                Rs./ kWh        6.00    4.77
                           Year 2013                Rs./ kWh        6.96    4.92
                           Year 2018                Rs./ kWh        8.06    5.12
                           Year 2023                Rs./ kWh        9.35    5.36
                           Year 2028                Rs./ kWh       10.84    5.68

3/4/2010                    Wind and Conventional Electricity –                    10
                                 Comparative Economics
®


Investment Analysis Findings (15 MW Wind Farm)
   Capital Investment (Rs. Milln.) (US$ 21.3 milln.)             975.0
   Debt : Equity Ratio                                           70:30
   Cost of Debt                                                 10% p.a.
   Cost of Capital (Post-Tax)                                   10.64%
   Simple Payback Period                                       6.2 Years
   Discounted Payback                                          9.3 Years
   Period       IRR (Post-Tax) NPV (Rs. Milln.)                 NPV as %
                                                               Investment
   10 Years          11.9%                     46.5              4.8%
   15 Years          15.1%                    219.2              22.5%
   20 Years          16.4%                    338.0              34.7%
3/4/2010                 Wind and Conventional Electricity –                11
                              Comparative Economics
®


           COMPARATIVE ECONOMICS –
              WIND ELECTRICITY VS.
           CONVENTIONAL ELECTRICITY


3/4/2010         Wind and Conventional Electricity –   12
                      Comparative Economics
®


            Comparison of Alternate Sources of
           Electricity – Methodology and Criteria
          Comparative Economics in terms of cost of
           electricity generation worked out for different
           options of conventional sources (including
           purchase from state grid) and wind energy
          Criteria followed:
            Unit cost of electricity generation for each option
             annually for entire life of the project; and
            Total cost of ownership and use of electricity over life
             of the project.


3/4/2010                  Wind and Conventional Electricity –           13
                               Comparative Economics
®


            Electricity Cost Components
     Investment Component (Expressed in terms of
      Annualised Cost for Various Options)
     Operating Cost Component
            Insurance of plant, machinery and materials
            O & M costs
            Working Capital Interest
     Fuel Cost Component (Fuel as applicable)
     Electricity Duty, if applicable.


3/4/2010                 Wind and Conventional Electricity –   14
                              Comparative Economics
®


           Conventional Fuels Price Scenario

                                      HV                Landed    Rs./   US$/
     Sr.    Fuel       Source                  Unit
                                     kCal                Cost    MMkCal MMBTU

     S1     Coal       Indian        5200       Kg        3.30    635    3.34

     S2     Coal      Imported       6200       Kg        3.90    629    3.31

     S3    Lignite     Gujarat       3500       Kg        2.15    614    3.23

     L1    Fuel Oil     PSU         10400       Kg       22.00    2107   11.09

     G1    Nat. Gas   Open Mkt.      9000      SCM        9.41    1045   5.50

     G2     LPG         PSU         10900       Kg       26.00    2385   12.55


3/4/2010                Wind and Conventional Electricity –                      15
                             Comparative Economics
®


               SCENARIO – I
           WIND ELECTRICITY FOR
                CAPTIVE USE


3/4/2010       Wind and Conventional Electricity –   16
                    Comparative Economics
®


      Conventional Energy Options Considered
           Basis: 30 milln. kWh Annual Electricity Generation


    Sr.     Fuel     Plant Type/ (PLF) Model and Nos.          Capacity
      1    Coal      Co-gen with               Generic         5.6 MW
                     Steam (67%)
      2    Natural   Gas Engine with           Deutz 1000 kW   5.0 MW
           Gas       WHR (75%)                 (5 sets)
      3    Fuel Oil Engine set with            Man B&W 1500    6.0 MW
                    WHR (62%)                  kW (4 sets)


3/4/2010                 Wind and Conventional Electricity –              17
                              Comparative Economics
®


    Summary Findings – Other Energy Options
                                                                Coal    NG     FO
       Sr.           Particulars                  Unit
                                                               Cogen Based Based
           1  Capacity                             MW            5.6    5.0    6.0
            2 Investment                       Rs. Millions     315.00 180.00 225.00
            3 Annualsd. Cost of Invest.       Rs. Milln.p.a.     40.94 25.43 31.79
           4 Var. Cost (Fuel & ED)
              a) Fuel Cost                      Rs./ kWh           2.75    3.21    4.49
              b) Elect. Duty                    Rs./ kWh           0.20    0.20    0.20
           5 Operating Cost                   Rs. Milln.p.a.       5.63    4.59   10.16
           6 Escalation                          % p. a.            5%      5%      5%
           7 Total Cost
                        Year 2008               Rs./ kWh           4.50    4.41    6.09
                        Year 2013               Rs./ kWh           5.37    5.40    7.48
                        Year 2018               Rs./ kWh           6.48    6.66    9.25
                        Year 2023               Rs./ kWh           7.89    8.26   11.52
                        Year 2028               Rs./ kWh           9.69   10.31   14.41

3/4/2010                     Wind and Conventional Electricity –                          18
                                  Comparative Economics
®


                                      Comparative Cost of Electricity
                              Wind Vs. Fossil Fuels – Captive Power Plants
                              15.00

                              14.00

                              13.00
      TOTAL COST (RS./ KWH)


                              12.00

                              11.00

                              10.00
                                                                                                   Grid (GUVNL)
                               9.00                                                                Wind
                                                                                                   Cogen (Coal)
                               8.00
                                                                                                   NG Based
                               7.00                                                                FO Based

                               6.00

                               5.00

                               4.00

                                  08 09 10 11 12 13 14 15 16 17 18 19 20 21 22 23 24 25 26 27 28
                                20 20 20 20 20 20 20 20 20 20 20 20 20 20 20 20 20 20 20 20 20
                                                                YEAR

3/4/2010                                           Wind and Conventional Electricity –                            19
                                                        Comparative Economics
®


      Total Cost of Ownership (CPP)- Scenario I
     PV Disctg. Rate: 10.64% (Post-Tax); Values per MMkWh p.a.

            Energy Source               INR Milln.          US $ Milln.   Rank

     Grid (HT) - GUVNL                      61.5               1.28        4
     Wind                                   41.1              0.86         1
     Cogen – Coal                           49.0               1.02        2
     Natural Gas Engine with                50.0               1.04        3
     WHR
     Fuel Oil Fired Engine Set              69.4               1.45        5
     with WHR


3/4/2010              Wind and Conventional Electricity –                        20
                           Comparative Economics
®


                SCENARIO – II
           WIND FARM FROM UTILITY
           COMPANY’S PERSPECTIVE


3/4/2010        Wind and Conventional Electricity –   21
                     Comparative Economics
®


Basis for Comparison- Thermal Power Stations
                                                                           Natural
     Sr.     Particulars/         Fuel             Coal       Fuel Oil              Wind
                                                                              Gas
      1    Typical Capacity (MW)                    500           500       500       150
           Fixed Capital Cost
      2                                              45               37     30       65
           (Rs. Miln. Per MW)
           Fixed Capital Investment
      3                                            22500        18500      15000     9750
           (Rs. Millns.)
           Net Working Capital
      4                                             2020         1620       1630      27
           (Rs. Millns.)
           Fixed Cap. Investment
      5                                             7399         5706       4602     32431
           (Rs. MWh p.a.)
      6    PLF (Capacity Factor)                    80%          80%        80%      27.3%
      7    Uptime (Hrs. p.a.)                       8400         8400       8400     8157
           Total Electricity Gen.
      8                                             3041         3242       3259      301
           (Milln. kWh)
3/4/2010                        Wind and Conventional Electricity –                          22
                                     Comparative Economics
®

                    Cost Comparison-
           Thermal Power Stations and Wind Farm
                                                                         Natural
     Sr.       Particulars/       Fuel            Coal       Fuel Oil             Wind
                                                                            Gas
      1     Heat Rate (kCal/ kWh)                  2500         1900      1850      NA
            Auxiliary Power Consn.
      2                                            9.5%         3.5%      3%       10%#
            (Wind Farm Losses#)
      3     Fuel Cost (US$ per MMBTU)               3.34        11.09      5.5      NA
            Fuel Cost (Rs./MT)
      4                                            3300        22000     9409@      NA
            @ (Rs./ 1000 SCM)
      5     Fuel Cost (Rs. Millns. p.a.)           5331        13453      6498      NA

      5     O&M Cost (Rs. Millns. p. a.)            750          600      500      112
      6     Insurance (Rs. Millns. p. a.)          67.50        55.50    45.00     48.75
      7     W. C. Interest (Rs. Millns. p.a.)     242.40       194.40    195.60    3.24
            Annualized Investment Cost
      8                                            3375         2775      2250     1267
               (Rs. Milln. p.a.)
3/4/2010                       Wind and Conventional Electricity –                         23
                                    Comparative Economics
®


                  Unit Cost of Power Generation-
                Thermal Power Stations and Wind Farm
                                                                                 Rs./ kWh
                                                                         Natural
       Sr.      Particulars/ Fuel              Coal          Fuel Oil                Wind
                                                                            Gas
           1   Fuel Cost                        1.75            4.15      1.99        NA
           2   O&M Cost                         0.25            0.18      0.15        0.38
           3   Insurance                        0.02            0.02      0.02        0.16
           4   W. C. Interest                   0.08            0.06      0.06        0.01
       A.      Total Operating Cost             2.10            4.41      2.22        0.55
       B.      Annlsd. Fxd. Inv. Cost           1.11            0.86      0.69        4.22
       C.      Total Cost - 2008                3.21            5.27      2.91        4.76
                           2013                 3.79            6.49      3.53        4.91
                           2018                 4.53            8.04      4.31        5.11
                           2023                 5.48           10.03      5.31        5.35
                           2028                 6.69           12.56      6.58        5.67
3/4/2010                        Wind and Conventional Electricity –                          24
                                     Comparative Economics
®


                                     Comparative Cost of Electricity
                            Wind Vs. Fossil Fuels – Thermal Power Stations
                            13.00

                            12.00

                            11.00

                            10.00
    TOTAL COST (RS./ KWH)


                             9.00
                                                                                                 Coal-based TPS
                             8.00                                                                Fuel-Oil based TPS
                                                                                                 Gas Based TPS
                             7.00                                                                Wind Farm
                                                                                                 GUVNL - DISCOM
                             6.00

                             5.00

                             4.00

                             3.00

                             2.00

                                08 09 10 11 12 13 14 15 16 17 18 19 20 21 22 23 24 25 26 27 28
                              20 20 20 20 20 20 20 20 20 20 20 20 20 20 20 20 20 20 20 20 20
                                                              YEAR


3/4/2010                                             Wind and Conventional Electricity –                              25
                                                          Comparative Economics
®


     Total Cost of Ownership (TPS)- Scenario II
     PV Disctg. Rate: 10.64% (Post-Tax); Values per MMkWh p.a.


    Energy Source      Rs. Millns.            US$ Millns.   Index   Rank

    Grid-GUVNL              61.5                   1.28     150      5

    Wind                    41.1                   0.86     100      3

    Coal-based TPS          34.4                   0.72      84      2

    Gas-based TPS           32.4                   0.68      79      1

    FO-based TPS            60.2                   1.26     147      4


3/4/2010              Wind and Conventional Electricity –                  26
                           Comparative Economics
®


    Wind Power Projects Planned/ Proposed by
     Energy Sector Companies – Partial List

     Sr. Company             Location                         MW
       1   Tata Power        Mah., Guj., Kartk.               285
       2   REL               Mah., Guj., Kartk., M.P.         650
       3   HPCL              Mah., Raj., Other                100
       4   ONGC              Guj., Kartk., Mah.               151
       5   CPC-IOC           TN, Guj.                          43
       6   BPCL              Kartk., Raj., Guj., Mah., TN     25-45
       7   NTPC              India                            650
       8   NHPC              India                             NA

3/4/2010                Wind and Conventional Electricity –           27
                             Comparative Economics
®


           Considerations for Putting up Wind/
              Renewable Energy Projects

    ● Abiding by national policy to reach 10%
      electricity generation from renewable sources.
    ● Renewable Power Purchase Obligation (RPO) of
      about 10%, with penalty attached for non-
      adherence to RPO.
    ● Forward looking policy with threatened viability
      or availability of fossil fuels.
    ● Viability of Renewable Energy Projects, by
      bridging viability gap through MNRE Incentive
      (Re. 0.50/ kWh), CERs and RECs

3/4/2010            Wind and Conventional Electricity –   28
                         Comparative Economics
®


                 SCENARIO – III
           WIND ELECTRICITY FOR SALE


3/4/2010          Wind and Conventional Electricity –   29
                       Comparative Economics
®


      Wind Electricity for Sale – Salient Points

    ● Purchase rates offered by state DISCOMs are
      much lower than total cost of wind electricity.
      Hence wind farm built exclusively for sale of
      electricity to state DISCOM may not be viable.
      For example:
           – Gujarat: Wind Electr. Cost Rs. 4.77/ kWh vs.
             GUVNL purchase rate at Rs. 3.50/ kWh.
           – Tamil Nadu: Wind Electr. Cost ~ Rs. 3.90/ kWh vs.
             State Grid purchase rate at Rs. 2.90/ kWh.


3/4/2010                Wind and Conventional Electricity –      30
                             Comparative Economics
®


               Wind Electricity for Sale (Contd.)

    ● Making a new wind farm exclusively for Third
      Party Sale, could be uneconomic due to
      applicability of additional levies such as:
           –   Cross subsidy
           –   Higher wheeling charges
           –   Applicability of common rates of T&D losses
           –   Applicability of electricity duty and/ or VAT


3/4/2010                  Wind and Conventional Electricity –   31
                               Comparative Economics
®


             Wind Electricity for Sale (Contd.)
    ● Favourable factors for Wind Electricity for Sale:
           – Continuity of CDM beyond 2012
           – Applicability of RPOs on utility companies
           – Institutionalisation of REC mechanism can
             favourably affect.
           – Power Trading Business


3/4/2010                Wind and Conventional Electricity –   32
                             Comparative Economics
®


                             Conclusions
    A. WIND ENERGY VS. POWER FROM GRID/ DISCOM:
       If there is no investment constraint, wind energy option is certainly
       more economical in terms of unit cost per kWh than purchase of
       electricity from state DISCOM in short-term as well as long-term. Even
       the conclusion is unchanged in terms of ‘Total Cost of Ownership’ over
       project life.

    B. SCENARIO- I: WIND ENERGY VS. CAPTIVE POWER PLANTS
           Total Unit Cost of Electricity Generation:
            In the medium to long run, wind energy offers cheapest option for
              generation of electricity.
            In the short run, in the present context, unit costs of electricity
              generation for co-gen using coal (or other solid fuels) and natural
              gas-based engines work out marginally lower for the initial 2 to 3
              years.
            Wind energy overtakes Co-gen and Natural Gas-based Engines
              from 3rd/ 4th year.
            Electricity based on liquid petroleum fuels is far expensive from the
              beginning and would work out several times higher in the years to
              come.
3/4/2010                     Wind and Conventional Electricity –                     33
                                  Comparative Economics
®


                             Conclusions (Contd.)
           Total cost of ownership
            Total cost of ownership of wind farms over the life is substantially
              lower than that of all options of conventional electricity from fossil
              fuels.
            To put it quantitatively, (Basis: total cost of ownership for wind
              farms = 100), total cost of ownership of conventional electricity
              plants is as follows:
                 Co-gen plants –                       119;
                 Natural gas-based plants –            122;
                 State grid electricity –              150;
                 Fuel oil based plants –               169.

   C. SCENARIO- II: WIND ENERGY VS. THERMAL POWER STATIONS

           Total Unit Cost of Electricity Generation:
            Coal and natural gas based thermal plants work out cheaper than
              wind energy for the initial 12 years. This is without consideration of
              any MNRE incentive or CDM credits (CERs) or RECs under
              proposed new mechanism.

3/4/2010                       Wind and Conventional Electricity –                     34
                                    Comparative Economics
®


                            Conclusions (Contd.)
            In later years of project life (after 12 years) wind energy yields
             lowest cost of electricity per kWh.

           Total cost of ownership
            Total cost of ownership over the life of coal and gas based thermal
             power stations is lower than wind farms.
            To put it quantitatively, (Basis: total cost of ownership for wind
             farms = 100), total cost of ownership of conventional electricity
             plants is as follows:
                Co-gen plants –                        84
                Natural gas-based plants –             79
                State grid electricity –               150
                Fuel oil based plants –                147

           Wind Power Projects by Utility Companies
            Despite cost economics not being in favour of wind-based power as
             compared to coal and natural gas based thermal power plants,
             many utility companies have decided to put up wind farms for
             several hundreds of MW, for meeting requirements of Government
             policy including RPOs.


3/4/2010                      Wind and Conventional Electricity –                  35
                                   Comparative Economics
®


                          Conclusions (Contd.)

       D. SCENARIO- III: WIND ENERGY FOR SALE
           Cost of wind electricity is higher than sale price available from
            DISCOMs. It is also higher than net price realised from third party
            sale (net after payment of cross subsiby, elect. duty etc.)
           In the long run, however, wind farms for sale of electricity could be
            profitable, depending upon supplementary realisations from CDM
            CERs, RECs, etc.


3/4/2010                    Wind and Conventional Electricity –                     36
                                 Comparative Economics
®


              Vijayant Consultants - Introduction
          Established in 1992. Engaged in Management and Project
           Consultancy practice.
          Have successful track record of pioneering wind energy
           projects in Gujarat, from Concept to Commissioning and Post-
           Project Performance Monitoring.
          Promotor Director: Bharat J. Mehta
           – B. Chem. Eng. From UICT Mumbai (1968) and M. B. A. from IIM-A
             (1970). Awarded Gold Medal for Scholastic Performance.
           – 22 years industry experience (1970-1992) and 17 years consultancy
             experience (1992-continue)
           – Certified Management consultant, globally recognized (IMCI, ICMCI)
           – Lead Auditor QMS, ISO 9001: 2000
           – Chairman IMCI, Ahmedabad, Past Treasurer, Past Regional
             Representative (West) and Member, Executive Council IMCI.
           – Past Chairman UICT Alumni Association
           – Past Vice Chairman, IIChE, ARC.
           – Visiting Professor IIM-A (1985-1994)


3/4/2010                    Wind and Conventional Electricity –                   37
                                 Comparative Economics
®


            Vijayant Consultants - Introduction (Contd.)

  Management Consultancy
          Business Strategy, diversifications and growth
          Competitive Strategy for Industrial Markets.
          Corporate Restructuring for Revival and Growth.
          Consultancy for ISO 9001: 2000 QMS and TQM
          Consultancy for ERP, BPR and SCM.
          Organisation Structure, OD, HRM
          Executive Placement.
          Management Information and Control Systems.
          Management Retainerships and Management Support Services.


3/4/2010                     Wind and Conventional Electricity –       38
                                  Comparative Economics
®


           Vijayant Consultants - Introduction (Contd.)
 Project Consultancy
      Identification of Investment Proposals.
      Strategic appraisal of diversification project proposals
      Techno-Economic Feasibility Studies.
      All Project Related Services from Concept to Commissioning, specially
       for Wind Energy, Captive Power, Water Systems, Environment Control,
       Chemicals, Pharmaceuticals, Oil and Gas, Agri-Food and others.
      Post-Project Services such as Performance Audit in relation to Technical
       Guarantees, Operations and Maintenance, etc.
      Technology Tie-ups, Joint Ventures and Financial Arrangements.

                          Contact: Bharat Mehta, Director
             Vijayant Consultants, 603, Sears Tower, Near Panchvati,
                     Gulbai Tekra, Ahmedabad 380006, India
               Phones: 91-70-26401460/ 61; Mobile: 91-9825060801
                 E-mail: consult@vijayant.com; www.vijayant.com

3/4/2010                   Wind and Conventional Electricity –                    39
                                Comparative Economics

Wind Vs Conventional Electricity Economics

  • 1.
    SYNERGY with ENERGY Indian Energy Show 2009 National Conference on 5th Indian Energy Sector Wind and Conventional Electricity- Comparative Economics for Captive Power Plants and Thermal Power Stations Bharat J. Mehta Vijayant Consultants Ahmedabad, India ® June 17, 2009 Wind and Conventional Electricity–Comparative Economics
  • 2.
    ® Flow of Presentation  Present Scenario – Opportunities, Recent Trends and Technological Advances  Basic Economic Viability Model for Wind Farm  Comparative Economics of Wind Electricity vs. Conventional Power – Three Scenarios  Scenario I: Wind Farm vs. Captive Power Plants  Scenario II: Wind Farm vs. Thermal Power Stations  Scenario III: Wind Farm specifically for Sale of Electricity  Conclusions 3/4/2010 Wind and Conventional Electricity – 2 Comparative Economics
  • 3.
    ® PRESENT SCENARIO 3/4/2010 Wind and Conventional Electricity – 3 Comparative Economics
  • 4.
    ® Present Scenario – Opportunities  Abundant Wind Energy Potential in India  Installed Capacity of 10,000 MW of Wind Electricity in India  Target for 10-12% Power Generation from Renewables  Obligation on State Utilities for Min. Intake of upto 10% of Electricity from renewable energy sources, including wind energy  Wind Energy is the Most Promising and Viable Source of Electricity Among Renewables  Central and State Govt. Policies Are Generally Positive to Renewable in General and Wind in Particular  Availability of Finance from Indian and Overseas Institutions and Investors  Favourable Global Scenario in terms of Technology as well as Market Developments  Implementation of Electricity Act 2003, National Electricity Policy, Open Access Regulations, Etc. at Central and State Levels 3/4/2010 Wind and Conventional Electricity – 4 Comparative Economics
  • 5.
    ® Recent Trends in the Wind Energy Sector  Increasing costs of fossil fuels, increasing variable cost of electrical energy day by day;  Advancements in wind turbine technology  Relatively stable capital costs and O & M Costs over the years;  Diminishing role of state subsidies/ incentives;  Introduction of power sector reforms and development of electricity markets;  CER credits under CDM and REC Mechanism for meeting RPO requirements  Narrowing gap between the costs of generation of conventional electricity and wind electricity. 3/4/2010 Wind and Conventional Electricity – 5 Comparative Economics
  • 6.
    ® Technological Advancements ON HARDWARE (WIND TURBINE GENERATOR) SIDE  Increasing rotor diameters  Increasing hub heights  Advances in blade design  Gearless technology  Micro-processor based local and centralized controls, and,  Overall Result - Multi-megawatt capacity wind turbines.  Development of wind turbines for off-shore installations ON SOFTWARE SIDE  Wind Profile Modeling using statistical techniques and software programs based on limited wind data and weather conditions  Programs for wind energy potential at micto-level (Wind Farm and WTG)  MIS for wind farms 3/4/2010 Wind and Conventional Electricity – 6 Comparative Economics
  • 7.
    ® BASIC ECONOMIC VIABILITY MODEL FOR WIND FARM 3/4/2010 Wind and Conventional Electricity – 7 Comparative Economics
  • 8.
    ® Capital Cost of 15 MW Wind Farm Sr Item Rs. M illn. US$ M illn. 1 Land and Dev. 15.00 0.31 2 Wind Turbine Generators 765.00 15.94 3 Associated Electricals 40.00 0.83 4 CMCS 5.00 0.10 5 Foundations/ Civil Works 40.00 0.83 6 Erectn.Testing,Commissng. 20.00 0.42 7 Power Evacun.Facilities 45.00 0.94 Sub-total 930.00 19.37 8 Project Engg. 5.00 0.10 9 Prelim.& Pre-Op. 10.00 0.21 10 Contingency 30.00 0.63 Total Project Cost 975.00 20.31 3/4/2010 Wind and Conventional Electricity – 8 Comparative Economics
  • 9.
    ® Basis of Economic Viability of Wind Farm 1 Installed Capacity (MW) 15 2 Project Cost (Rs. Milln.) (US$ 20.31 Milln.) 975.00 3 Power Gen. (Milln.kWh p.a.) 30 4 Elect.Tariff-Var. Part (Rs./kWh) (US$ 0.11/kWh) 5.41 5 O & M Exp. - 1st Yr. (Rs. Milln.) (US$0.22Milln.) 10.45 6 Insurance Exp. (Rs. Milln.) (US$ 0.13 Milln.) 6.00 7 Escaln. in Costs inclg. Ins. (% p.a.) 5% 8 Escaln. in Elect. Tariff (% p.a.) 3% 9 Deprecn. for wind farm eqpt. 80% 10 Amortsn. for P & P, etc. 10% 11 Rate of Income-tax 33.66% 12 Cost of Capital (Post-tax)% p.a. 10.64% 13 Disctg. Rate for PV Analysis % p.a. 10.64% 14 Project Life (Years) 20 3/4/2010 Wind and Conventional Electricity – 9 Comparative Economics
  • 10.
    ® Summary Findings – Wind Vs. Electr. Grid Elect. Sr. Particulars Unit Wind Grid 1 Capacity MW 6.0 15.0 2 Investment Rs. Millions 0.00 975.00 3 Annualsd. Cost of Invest. Rs. Milln.p.a. 0.00 126.75 4 Var. Cost (Fuel & ED) a) Elect./ Fuel Cost Rs./ kWh 4.40 0.00 b) Elect. Duty Rs./ kWh 0.53 0.00 5 Operating Cost Rs. Milln.p.a. 5.36 16.45 6 Escalation % p. a. 3% 5% 7 Total Cost Year 2008 Rs./ kWh 6.00 4.77 Year 2013 Rs./ kWh 6.96 4.92 Year 2018 Rs./ kWh 8.06 5.12 Year 2023 Rs./ kWh 9.35 5.36 Year 2028 Rs./ kWh 10.84 5.68 3/4/2010 Wind and Conventional Electricity – 10 Comparative Economics
  • 11.
    ® Investment Analysis Findings(15 MW Wind Farm) Capital Investment (Rs. Milln.) (US$ 21.3 milln.) 975.0 Debt : Equity Ratio 70:30 Cost of Debt 10% p.a. Cost of Capital (Post-Tax) 10.64% Simple Payback Period 6.2 Years Discounted Payback 9.3 Years Period IRR (Post-Tax) NPV (Rs. Milln.) NPV as % Investment 10 Years 11.9% 46.5 4.8% 15 Years 15.1% 219.2 22.5% 20 Years 16.4% 338.0 34.7% 3/4/2010 Wind and Conventional Electricity – 11 Comparative Economics
  • 12.
    ® COMPARATIVE ECONOMICS – WIND ELECTRICITY VS. CONVENTIONAL ELECTRICITY 3/4/2010 Wind and Conventional Electricity – 12 Comparative Economics
  • 13.
    ® Comparison of Alternate Sources of Electricity – Methodology and Criteria  Comparative Economics in terms of cost of electricity generation worked out for different options of conventional sources (including purchase from state grid) and wind energy  Criteria followed:  Unit cost of electricity generation for each option annually for entire life of the project; and  Total cost of ownership and use of electricity over life of the project. 3/4/2010 Wind and Conventional Electricity – 13 Comparative Economics
  • 14.
    ® Electricity Cost Components  Investment Component (Expressed in terms of Annualised Cost for Various Options)  Operating Cost Component  Insurance of plant, machinery and materials  O & M costs  Working Capital Interest  Fuel Cost Component (Fuel as applicable)  Electricity Duty, if applicable. 3/4/2010 Wind and Conventional Electricity – 14 Comparative Economics
  • 15.
    ® Conventional Fuels Price Scenario HV Landed Rs./ US$/ Sr. Fuel Source Unit kCal Cost MMkCal MMBTU S1 Coal Indian 5200 Kg 3.30 635 3.34 S2 Coal Imported 6200 Kg 3.90 629 3.31 S3 Lignite Gujarat 3500 Kg 2.15 614 3.23 L1 Fuel Oil PSU 10400 Kg 22.00 2107 11.09 G1 Nat. Gas Open Mkt. 9000 SCM 9.41 1045 5.50 G2 LPG PSU 10900 Kg 26.00 2385 12.55 3/4/2010 Wind and Conventional Electricity – 15 Comparative Economics
  • 16.
    ® SCENARIO – I WIND ELECTRICITY FOR CAPTIVE USE 3/4/2010 Wind and Conventional Electricity – 16 Comparative Economics
  • 17.
    ® Conventional Energy Options Considered Basis: 30 milln. kWh Annual Electricity Generation Sr. Fuel Plant Type/ (PLF) Model and Nos. Capacity 1 Coal Co-gen with Generic 5.6 MW Steam (67%) 2 Natural Gas Engine with Deutz 1000 kW 5.0 MW Gas WHR (75%) (5 sets) 3 Fuel Oil Engine set with Man B&W 1500 6.0 MW WHR (62%) kW (4 sets) 3/4/2010 Wind and Conventional Electricity – 17 Comparative Economics
  • 18.
    ® Summary Findings – Other Energy Options Coal NG FO Sr. Particulars Unit Cogen Based Based 1 Capacity MW 5.6 5.0 6.0 2 Investment Rs. Millions 315.00 180.00 225.00 3 Annualsd. Cost of Invest. Rs. Milln.p.a. 40.94 25.43 31.79 4 Var. Cost (Fuel & ED) a) Fuel Cost Rs./ kWh 2.75 3.21 4.49 b) Elect. Duty Rs./ kWh 0.20 0.20 0.20 5 Operating Cost Rs. Milln.p.a. 5.63 4.59 10.16 6 Escalation % p. a. 5% 5% 5% 7 Total Cost Year 2008 Rs./ kWh 4.50 4.41 6.09 Year 2013 Rs./ kWh 5.37 5.40 7.48 Year 2018 Rs./ kWh 6.48 6.66 9.25 Year 2023 Rs./ kWh 7.89 8.26 11.52 Year 2028 Rs./ kWh 9.69 10.31 14.41 3/4/2010 Wind and Conventional Electricity – 18 Comparative Economics
  • 19.
    ® Comparative Cost of Electricity Wind Vs. Fossil Fuels – Captive Power Plants 15.00 14.00 13.00 TOTAL COST (RS./ KWH) 12.00 11.00 10.00 Grid (GUVNL) 9.00 Wind Cogen (Coal) 8.00 NG Based 7.00 FO Based 6.00 5.00 4.00 08 09 10 11 12 13 14 15 16 17 18 19 20 21 22 23 24 25 26 27 28 20 20 20 20 20 20 20 20 20 20 20 20 20 20 20 20 20 20 20 20 20 YEAR 3/4/2010 Wind and Conventional Electricity – 19 Comparative Economics
  • 20.
    ® Total Cost of Ownership (CPP)- Scenario I PV Disctg. Rate: 10.64% (Post-Tax); Values per MMkWh p.a. Energy Source INR Milln. US $ Milln. Rank Grid (HT) - GUVNL 61.5 1.28 4 Wind 41.1 0.86 1 Cogen – Coal 49.0 1.02 2 Natural Gas Engine with 50.0 1.04 3 WHR Fuel Oil Fired Engine Set 69.4 1.45 5 with WHR 3/4/2010 Wind and Conventional Electricity – 20 Comparative Economics
  • 21.
    ® SCENARIO – II WIND FARM FROM UTILITY COMPANY’S PERSPECTIVE 3/4/2010 Wind and Conventional Electricity – 21 Comparative Economics
  • 22.
    ® Basis for Comparison-Thermal Power Stations Natural Sr. Particulars/ Fuel  Coal Fuel Oil Wind Gas 1 Typical Capacity (MW) 500 500 500 150 Fixed Capital Cost 2 45 37 30 65 (Rs. Miln. Per MW) Fixed Capital Investment 3 22500 18500 15000 9750 (Rs. Millns.) Net Working Capital 4 2020 1620 1630 27 (Rs. Millns.) Fixed Cap. Investment 5 7399 5706 4602 32431 (Rs. MWh p.a.) 6 PLF (Capacity Factor) 80% 80% 80% 27.3% 7 Uptime (Hrs. p.a.) 8400 8400 8400 8157 Total Electricity Gen. 8 3041 3242 3259 301 (Milln. kWh) 3/4/2010 Wind and Conventional Electricity – 22 Comparative Economics
  • 23.
    ® Cost Comparison- Thermal Power Stations and Wind Farm Natural Sr. Particulars/ Fuel  Coal Fuel Oil Wind Gas 1 Heat Rate (kCal/ kWh) 2500 1900 1850 NA Auxiliary Power Consn. 2 9.5% 3.5% 3% 10%# (Wind Farm Losses#) 3 Fuel Cost (US$ per MMBTU) 3.34 11.09 5.5 NA Fuel Cost (Rs./MT) 4 3300 22000 9409@ NA @ (Rs./ 1000 SCM) 5 Fuel Cost (Rs. Millns. p.a.) 5331 13453 6498 NA 5 O&M Cost (Rs. Millns. p. a.) 750 600 500 112 6 Insurance (Rs. Millns. p. a.) 67.50 55.50 45.00 48.75 7 W. C. Interest (Rs. Millns. p.a.) 242.40 194.40 195.60 3.24 Annualized Investment Cost 8 3375 2775 2250 1267 (Rs. Milln. p.a.) 3/4/2010 Wind and Conventional Electricity – 23 Comparative Economics
  • 24.
    ® Unit Cost of Power Generation- Thermal Power Stations and Wind Farm Rs./ kWh Natural Sr. Particulars/ Fuel  Coal Fuel Oil Wind Gas 1 Fuel Cost 1.75 4.15 1.99 NA 2 O&M Cost 0.25 0.18 0.15 0.38 3 Insurance 0.02 0.02 0.02 0.16 4 W. C. Interest 0.08 0.06 0.06 0.01 A. Total Operating Cost 2.10 4.41 2.22 0.55 B. Annlsd. Fxd. Inv. Cost 1.11 0.86 0.69 4.22 C. Total Cost - 2008 3.21 5.27 2.91 4.76 2013 3.79 6.49 3.53 4.91 2018 4.53 8.04 4.31 5.11 2023 5.48 10.03 5.31 5.35 2028 6.69 12.56 6.58 5.67 3/4/2010 Wind and Conventional Electricity – 24 Comparative Economics
  • 25.
    ® Comparative Cost of Electricity Wind Vs. Fossil Fuels – Thermal Power Stations 13.00 12.00 11.00 10.00 TOTAL COST (RS./ KWH) 9.00 Coal-based TPS 8.00 Fuel-Oil based TPS Gas Based TPS 7.00 Wind Farm GUVNL - DISCOM 6.00 5.00 4.00 3.00 2.00 08 09 10 11 12 13 14 15 16 17 18 19 20 21 22 23 24 25 26 27 28 20 20 20 20 20 20 20 20 20 20 20 20 20 20 20 20 20 20 20 20 20 YEAR 3/4/2010 Wind and Conventional Electricity – 25 Comparative Economics
  • 26.
    ® Total Cost of Ownership (TPS)- Scenario II PV Disctg. Rate: 10.64% (Post-Tax); Values per MMkWh p.a. Energy Source Rs. Millns. US$ Millns. Index Rank Grid-GUVNL 61.5 1.28 150 5 Wind 41.1 0.86 100 3 Coal-based TPS 34.4 0.72 84 2 Gas-based TPS 32.4 0.68 79 1 FO-based TPS 60.2 1.26 147 4 3/4/2010 Wind and Conventional Electricity – 26 Comparative Economics
  • 27.
    ® Wind Power Projects Planned/ Proposed by Energy Sector Companies – Partial List Sr. Company Location MW 1 Tata Power Mah., Guj., Kartk. 285 2 REL Mah., Guj., Kartk., M.P. 650 3 HPCL Mah., Raj., Other 100 4 ONGC Guj., Kartk., Mah. 151 5 CPC-IOC TN, Guj. 43 6 BPCL Kartk., Raj., Guj., Mah., TN 25-45 7 NTPC India 650 8 NHPC India NA 3/4/2010 Wind and Conventional Electricity – 27 Comparative Economics
  • 28.
    ® Considerations for Putting up Wind/ Renewable Energy Projects ● Abiding by national policy to reach 10% electricity generation from renewable sources. ● Renewable Power Purchase Obligation (RPO) of about 10%, with penalty attached for non- adherence to RPO. ● Forward looking policy with threatened viability or availability of fossil fuels. ● Viability of Renewable Energy Projects, by bridging viability gap through MNRE Incentive (Re. 0.50/ kWh), CERs and RECs 3/4/2010 Wind and Conventional Electricity – 28 Comparative Economics
  • 29.
    ® SCENARIO – III WIND ELECTRICITY FOR SALE 3/4/2010 Wind and Conventional Electricity – 29 Comparative Economics
  • 30.
    ® Wind Electricity for Sale – Salient Points ● Purchase rates offered by state DISCOMs are much lower than total cost of wind electricity. Hence wind farm built exclusively for sale of electricity to state DISCOM may not be viable. For example: – Gujarat: Wind Electr. Cost Rs. 4.77/ kWh vs. GUVNL purchase rate at Rs. 3.50/ kWh. – Tamil Nadu: Wind Electr. Cost ~ Rs. 3.90/ kWh vs. State Grid purchase rate at Rs. 2.90/ kWh. 3/4/2010 Wind and Conventional Electricity – 30 Comparative Economics
  • 31.
    ® Wind Electricity for Sale (Contd.) ● Making a new wind farm exclusively for Third Party Sale, could be uneconomic due to applicability of additional levies such as: – Cross subsidy – Higher wheeling charges – Applicability of common rates of T&D losses – Applicability of electricity duty and/ or VAT 3/4/2010 Wind and Conventional Electricity – 31 Comparative Economics
  • 32.
    ® Wind Electricity for Sale (Contd.) ● Favourable factors for Wind Electricity for Sale: – Continuity of CDM beyond 2012 – Applicability of RPOs on utility companies – Institutionalisation of REC mechanism can favourably affect. – Power Trading Business 3/4/2010 Wind and Conventional Electricity – 32 Comparative Economics
  • 33.
    ® Conclusions A. WIND ENERGY VS. POWER FROM GRID/ DISCOM: If there is no investment constraint, wind energy option is certainly more economical in terms of unit cost per kWh than purchase of electricity from state DISCOM in short-term as well as long-term. Even the conclusion is unchanged in terms of ‘Total Cost of Ownership’ over project life. B. SCENARIO- I: WIND ENERGY VS. CAPTIVE POWER PLANTS Total Unit Cost of Electricity Generation:  In the medium to long run, wind energy offers cheapest option for generation of electricity.  In the short run, in the present context, unit costs of electricity generation for co-gen using coal (or other solid fuels) and natural gas-based engines work out marginally lower for the initial 2 to 3 years.  Wind energy overtakes Co-gen and Natural Gas-based Engines from 3rd/ 4th year.  Electricity based on liquid petroleum fuels is far expensive from the beginning and would work out several times higher in the years to come. 3/4/2010 Wind and Conventional Electricity – 33 Comparative Economics
  • 34.
    ® Conclusions (Contd.) Total cost of ownership  Total cost of ownership of wind farms over the life is substantially lower than that of all options of conventional electricity from fossil fuels.  To put it quantitatively, (Basis: total cost of ownership for wind farms = 100), total cost of ownership of conventional electricity plants is as follows:  Co-gen plants – 119;  Natural gas-based plants – 122;  State grid electricity – 150;  Fuel oil based plants – 169. C. SCENARIO- II: WIND ENERGY VS. THERMAL POWER STATIONS Total Unit Cost of Electricity Generation:  Coal and natural gas based thermal plants work out cheaper than wind energy for the initial 12 years. This is without consideration of any MNRE incentive or CDM credits (CERs) or RECs under proposed new mechanism. 3/4/2010 Wind and Conventional Electricity – 34 Comparative Economics
  • 35.
    ® Conclusions (Contd.)  In later years of project life (after 12 years) wind energy yields lowest cost of electricity per kWh. Total cost of ownership  Total cost of ownership over the life of coal and gas based thermal power stations is lower than wind farms.  To put it quantitatively, (Basis: total cost of ownership for wind farms = 100), total cost of ownership of conventional electricity plants is as follows:  Co-gen plants – 84  Natural gas-based plants – 79  State grid electricity – 150  Fuel oil based plants – 147 Wind Power Projects by Utility Companies  Despite cost economics not being in favour of wind-based power as compared to coal and natural gas based thermal power plants, many utility companies have decided to put up wind farms for several hundreds of MW, for meeting requirements of Government policy including RPOs. 3/4/2010 Wind and Conventional Electricity – 35 Comparative Economics
  • 36.
    ® Conclusions (Contd.) D. SCENARIO- III: WIND ENERGY FOR SALE  Cost of wind electricity is higher than sale price available from DISCOMs. It is also higher than net price realised from third party sale (net after payment of cross subsiby, elect. duty etc.)  In the long run, however, wind farms for sale of electricity could be profitable, depending upon supplementary realisations from CDM CERs, RECs, etc. 3/4/2010 Wind and Conventional Electricity – 36 Comparative Economics
  • 37.
    ® Vijayant Consultants - Introduction  Established in 1992. Engaged in Management and Project Consultancy practice.  Have successful track record of pioneering wind energy projects in Gujarat, from Concept to Commissioning and Post- Project Performance Monitoring.  Promotor Director: Bharat J. Mehta – B. Chem. Eng. From UICT Mumbai (1968) and M. B. A. from IIM-A (1970). Awarded Gold Medal for Scholastic Performance. – 22 years industry experience (1970-1992) and 17 years consultancy experience (1992-continue) – Certified Management consultant, globally recognized (IMCI, ICMCI) – Lead Auditor QMS, ISO 9001: 2000 – Chairman IMCI, Ahmedabad, Past Treasurer, Past Regional Representative (West) and Member, Executive Council IMCI. – Past Chairman UICT Alumni Association – Past Vice Chairman, IIChE, ARC. – Visiting Professor IIM-A (1985-1994) 3/4/2010 Wind and Conventional Electricity – 37 Comparative Economics
  • 38.
    ® Vijayant Consultants - Introduction (Contd.) Management Consultancy  Business Strategy, diversifications and growth  Competitive Strategy for Industrial Markets.  Corporate Restructuring for Revival and Growth.  Consultancy for ISO 9001: 2000 QMS and TQM  Consultancy for ERP, BPR and SCM.  Organisation Structure, OD, HRM  Executive Placement.  Management Information and Control Systems.  Management Retainerships and Management Support Services. 3/4/2010 Wind and Conventional Electricity – 38 Comparative Economics
  • 39.
    ® Vijayant Consultants - Introduction (Contd.) Project Consultancy  Identification of Investment Proposals.  Strategic appraisal of diversification project proposals  Techno-Economic Feasibility Studies.  All Project Related Services from Concept to Commissioning, specially for Wind Energy, Captive Power, Water Systems, Environment Control, Chemicals, Pharmaceuticals, Oil and Gas, Agri-Food and others.  Post-Project Services such as Performance Audit in relation to Technical Guarantees, Operations and Maintenance, etc.  Technology Tie-ups, Joint Ventures and Financial Arrangements. Contact: Bharat Mehta, Director Vijayant Consultants, 603, Sears Tower, Near Panchvati, Gulbai Tekra, Ahmedabad 380006, India Phones: 91-70-26401460/ 61; Mobile: 91-9825060801 E-mail: consult@vijayant.com; www.vijayant.com 3/4/2010 Wind and Conventional Electricity – 39 Comparative Economics