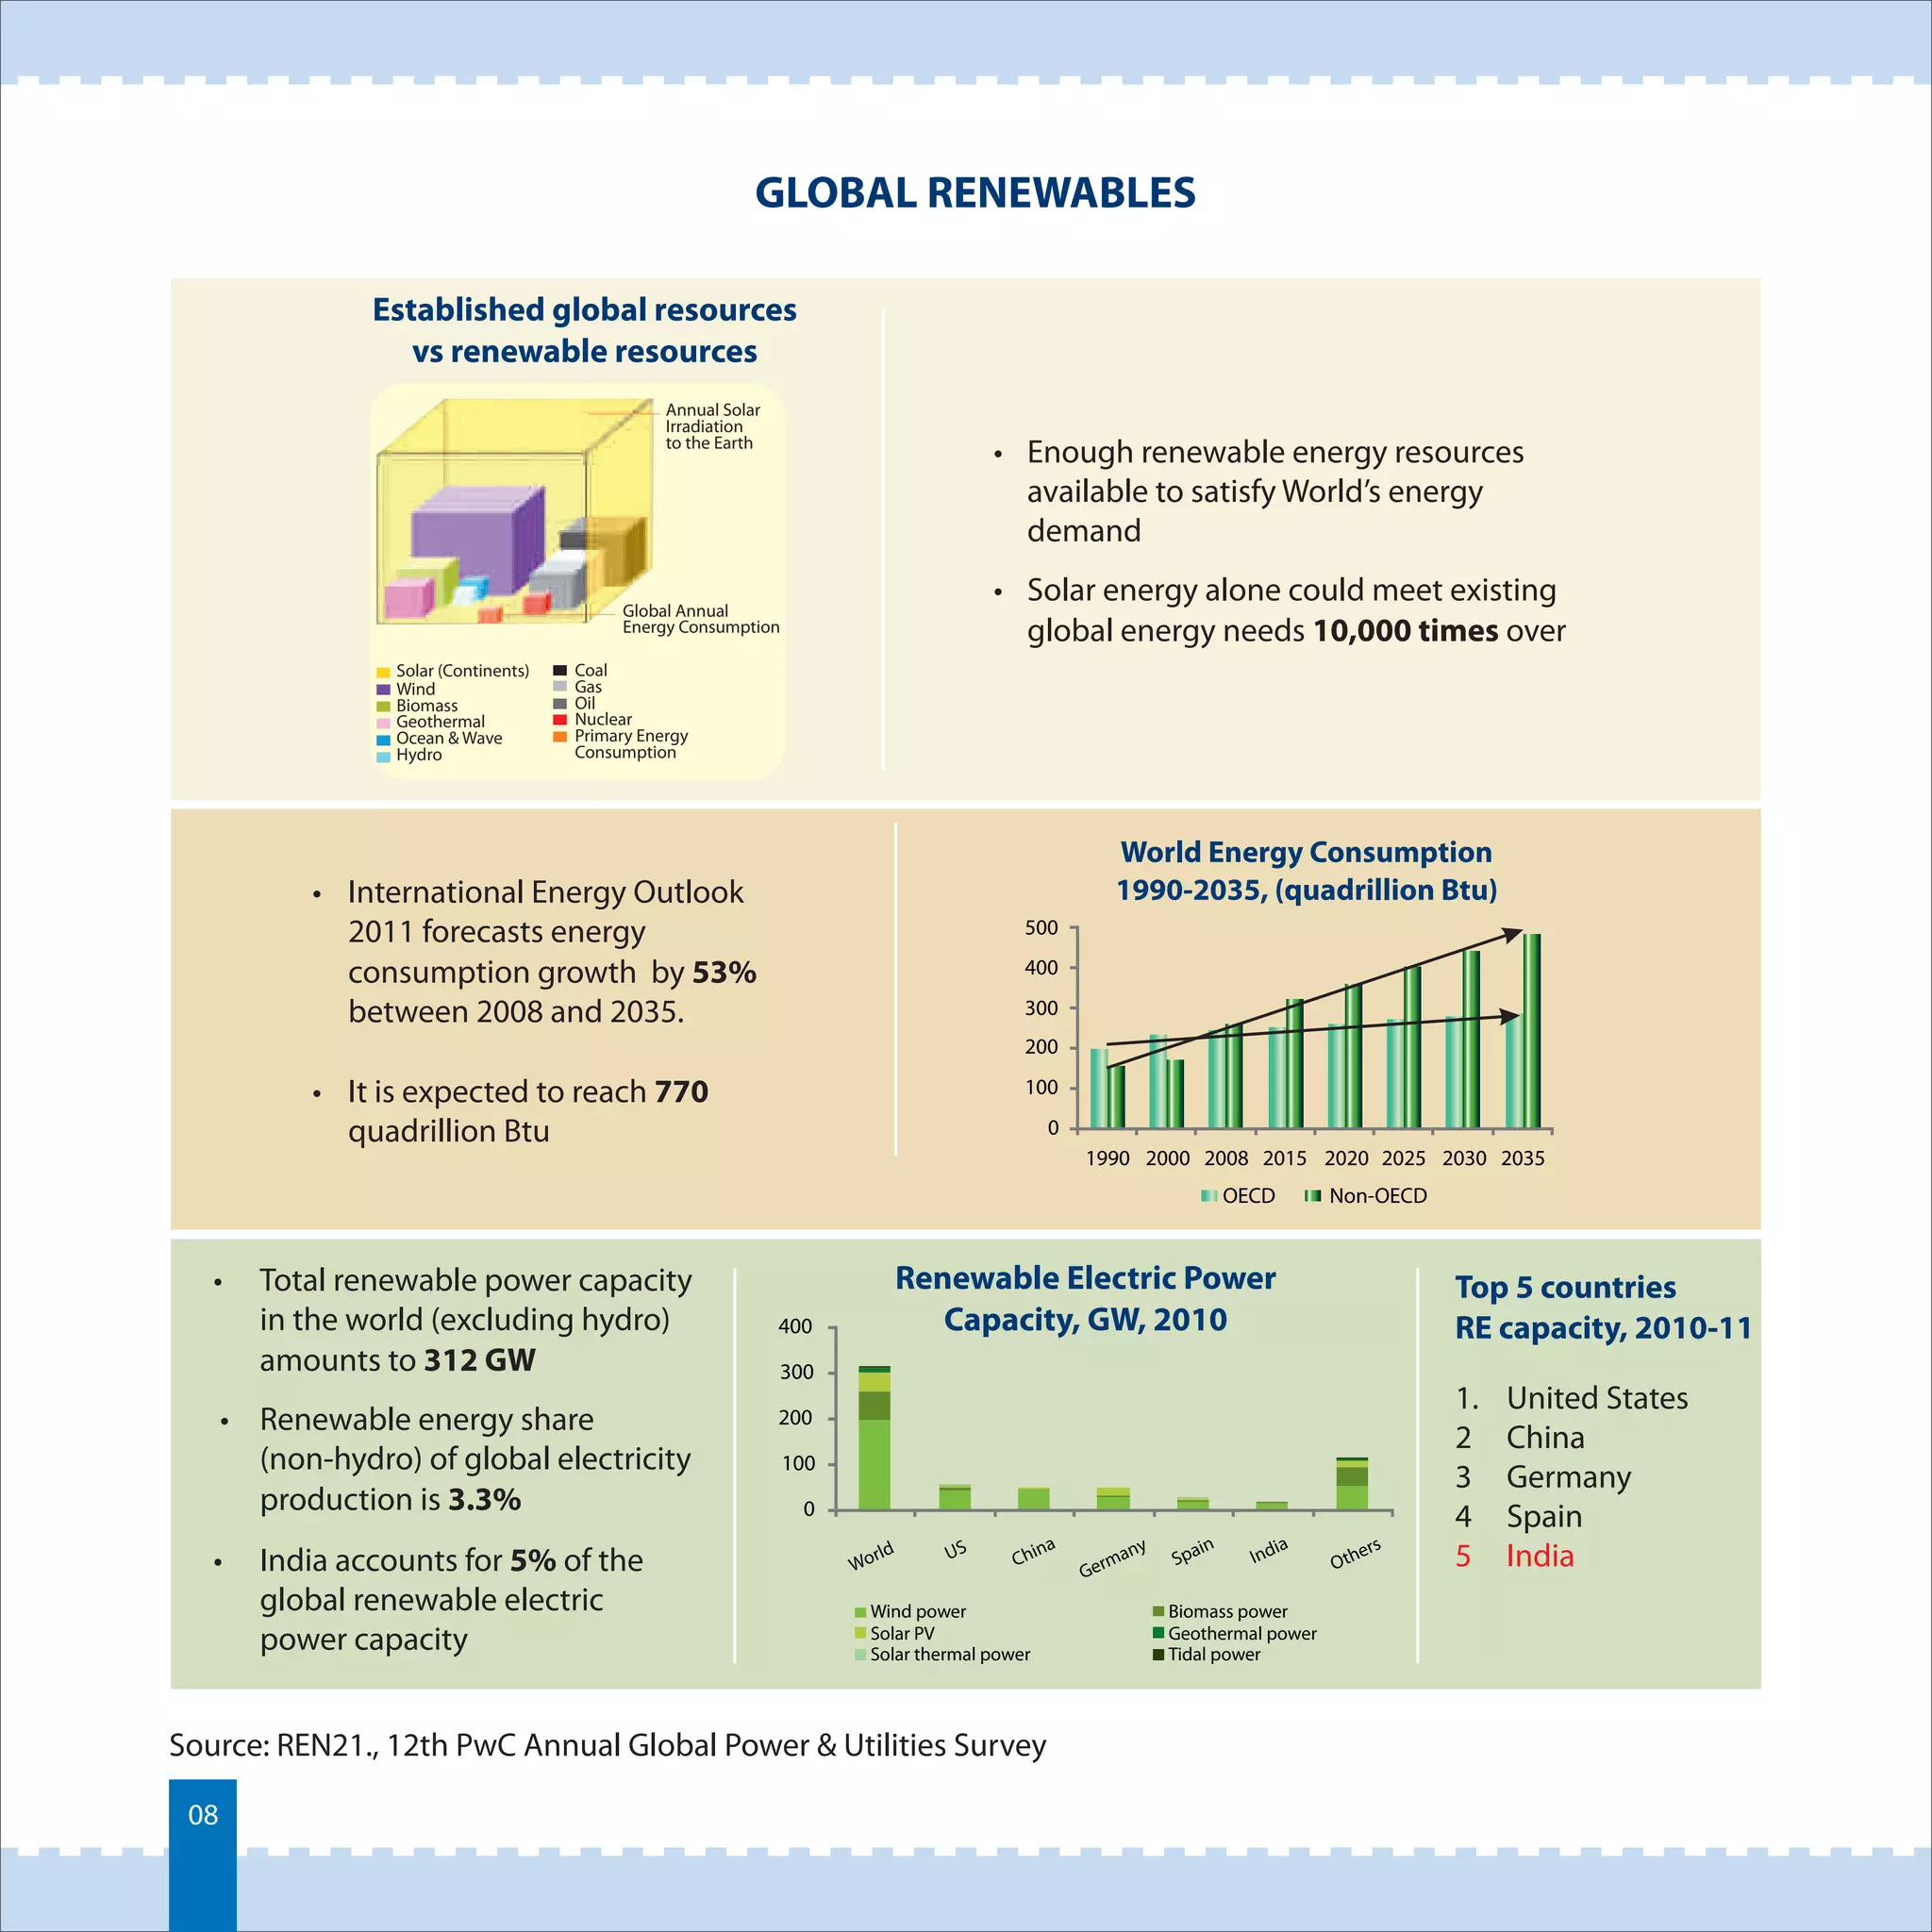
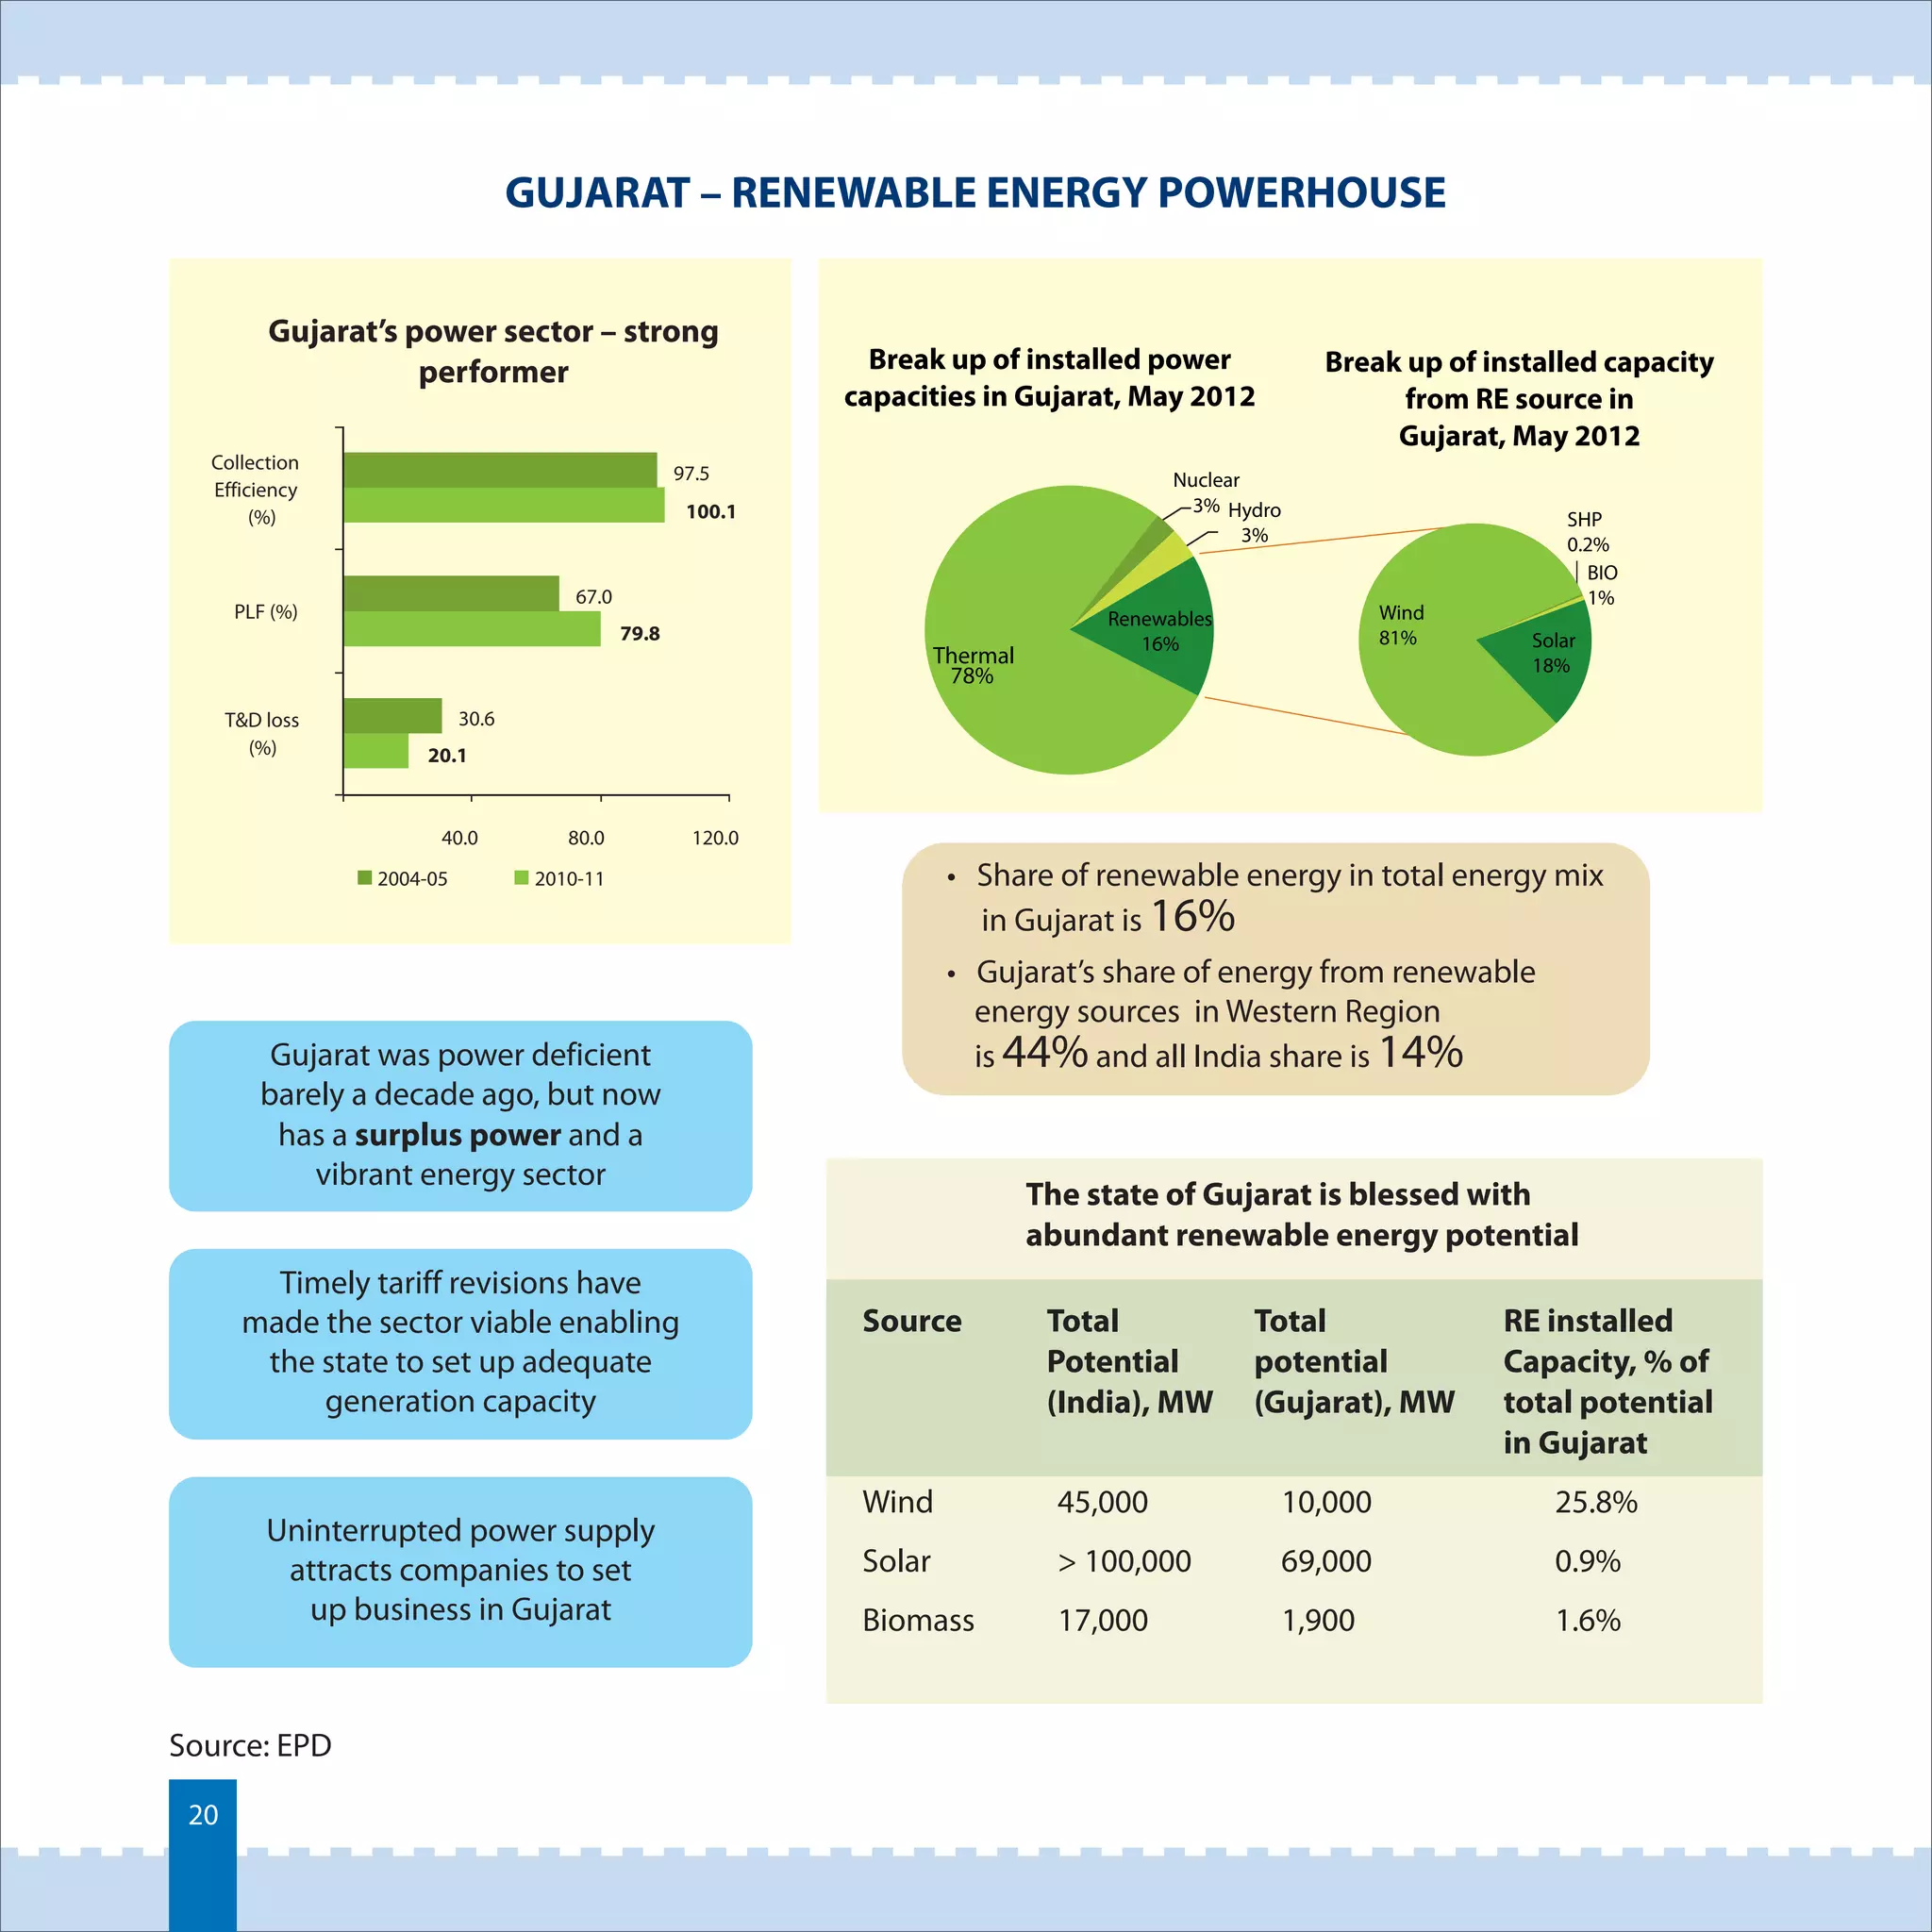
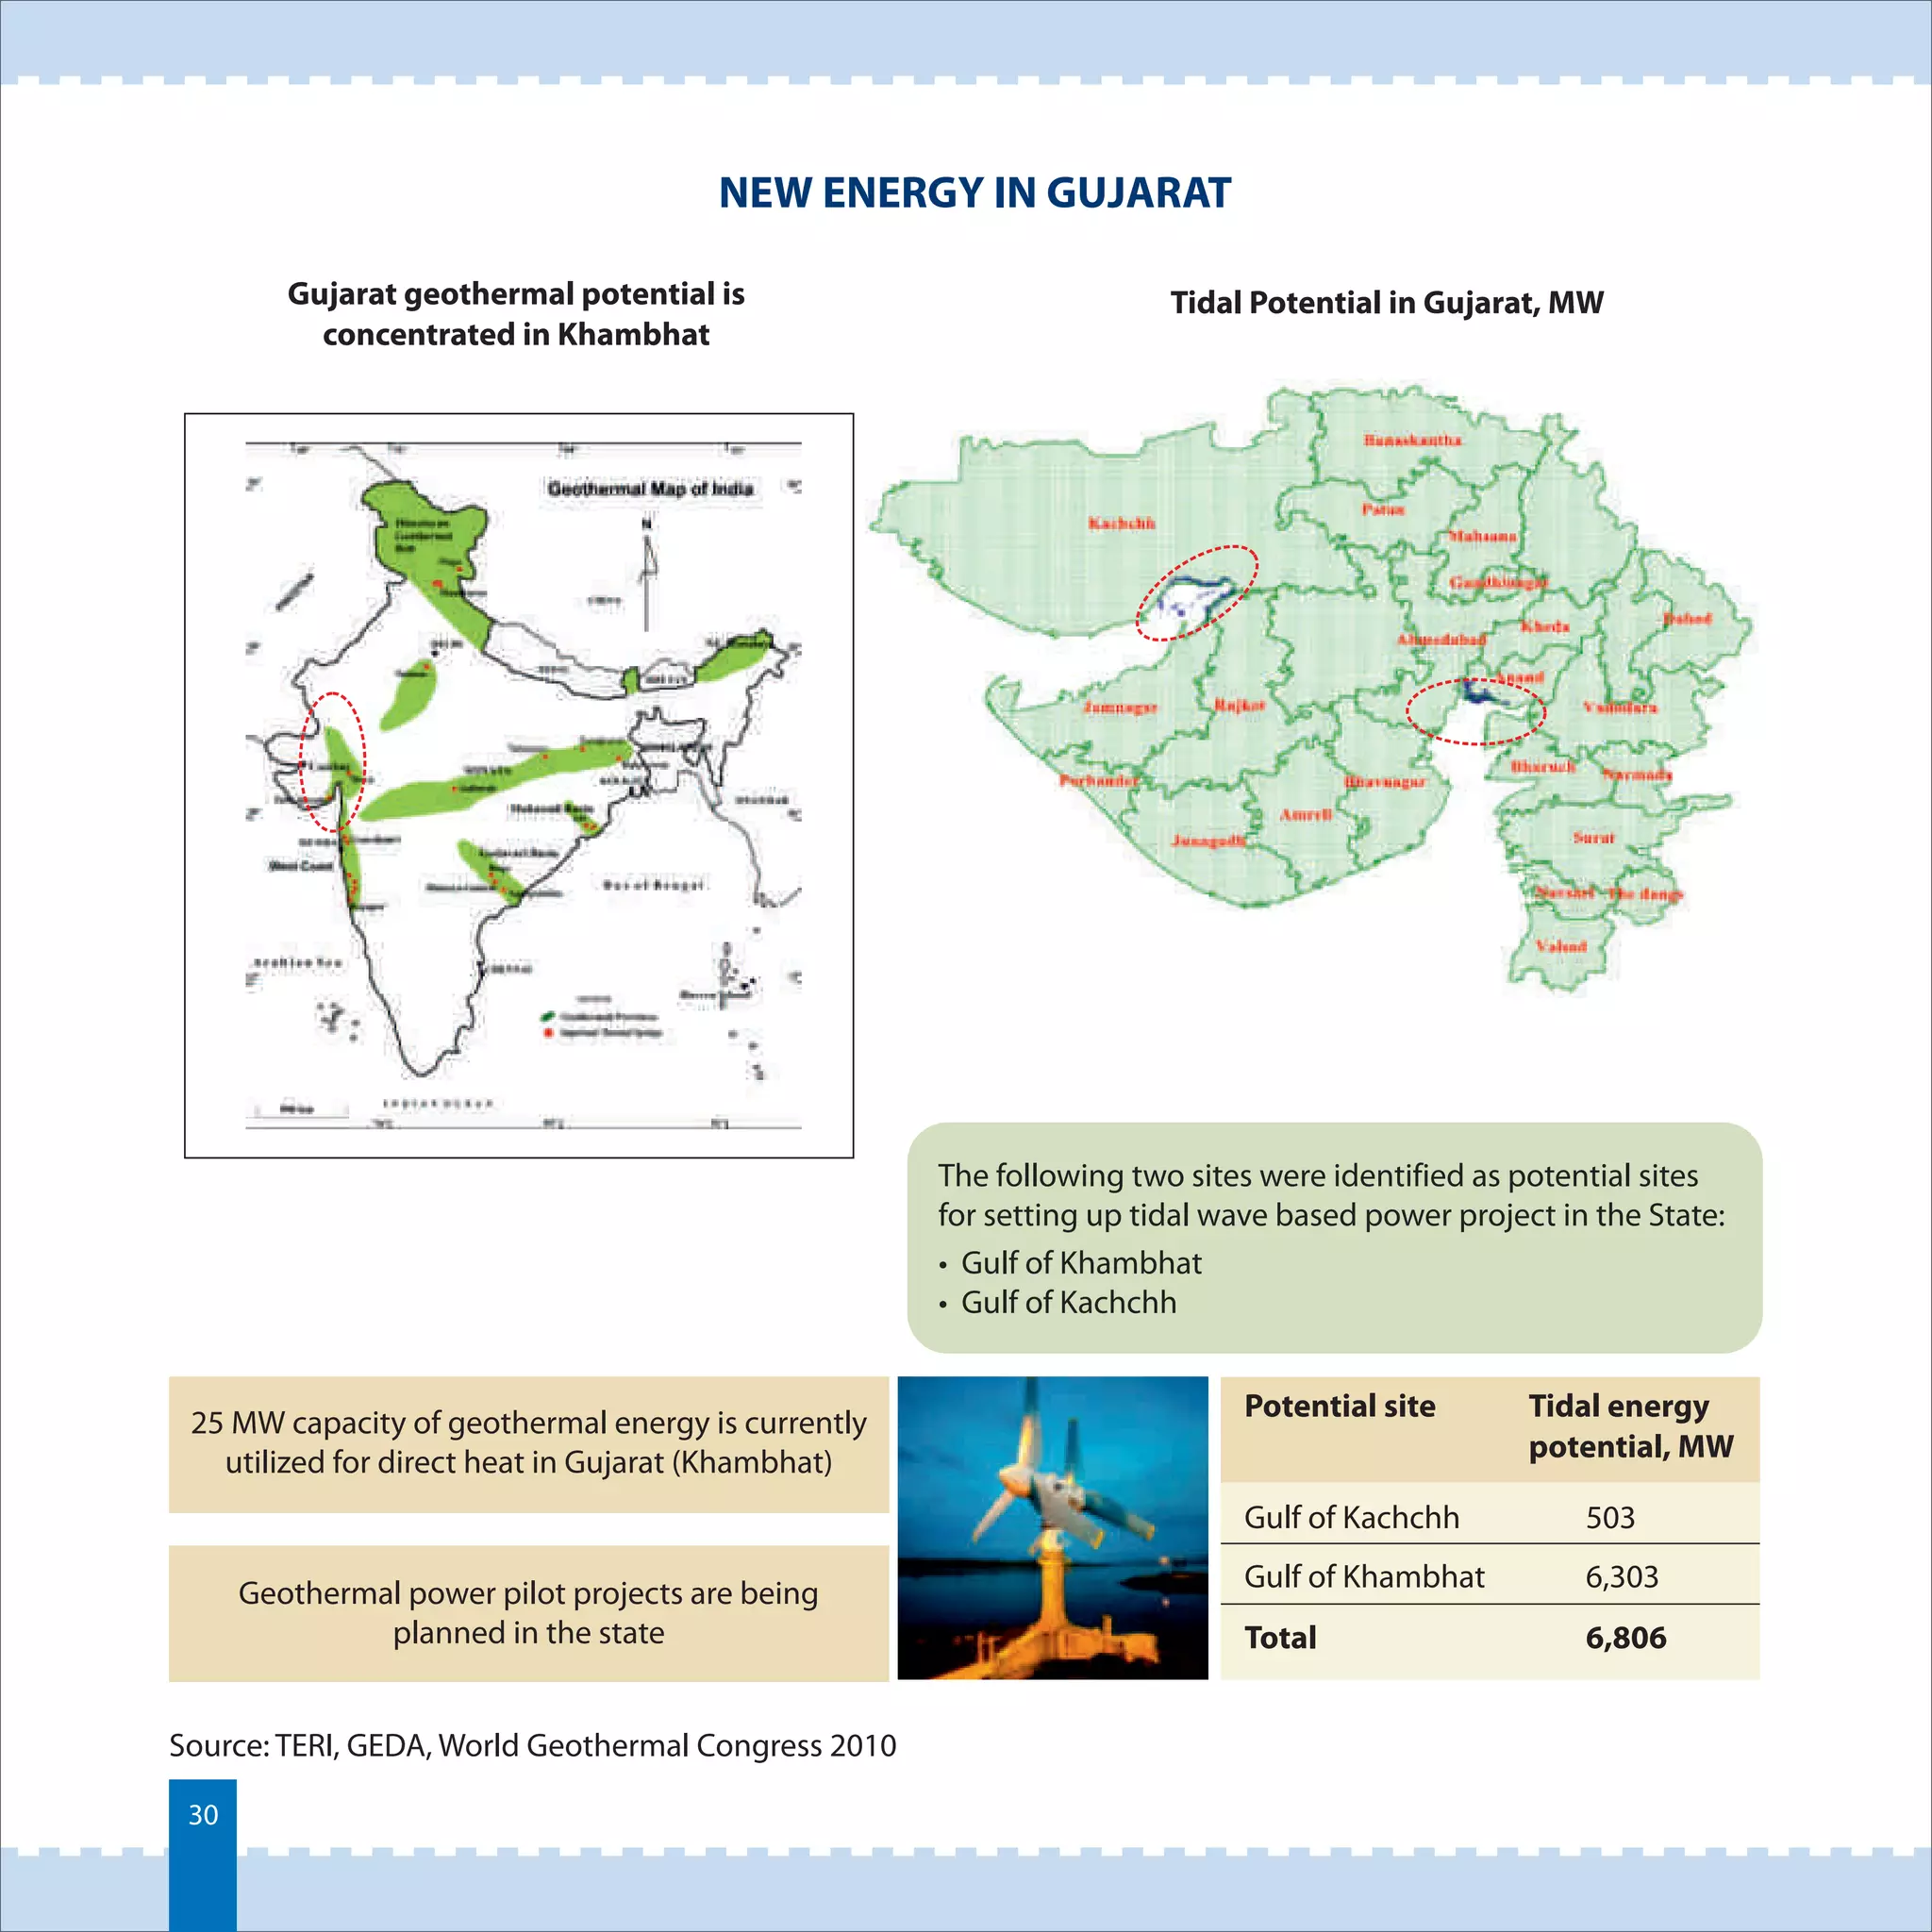
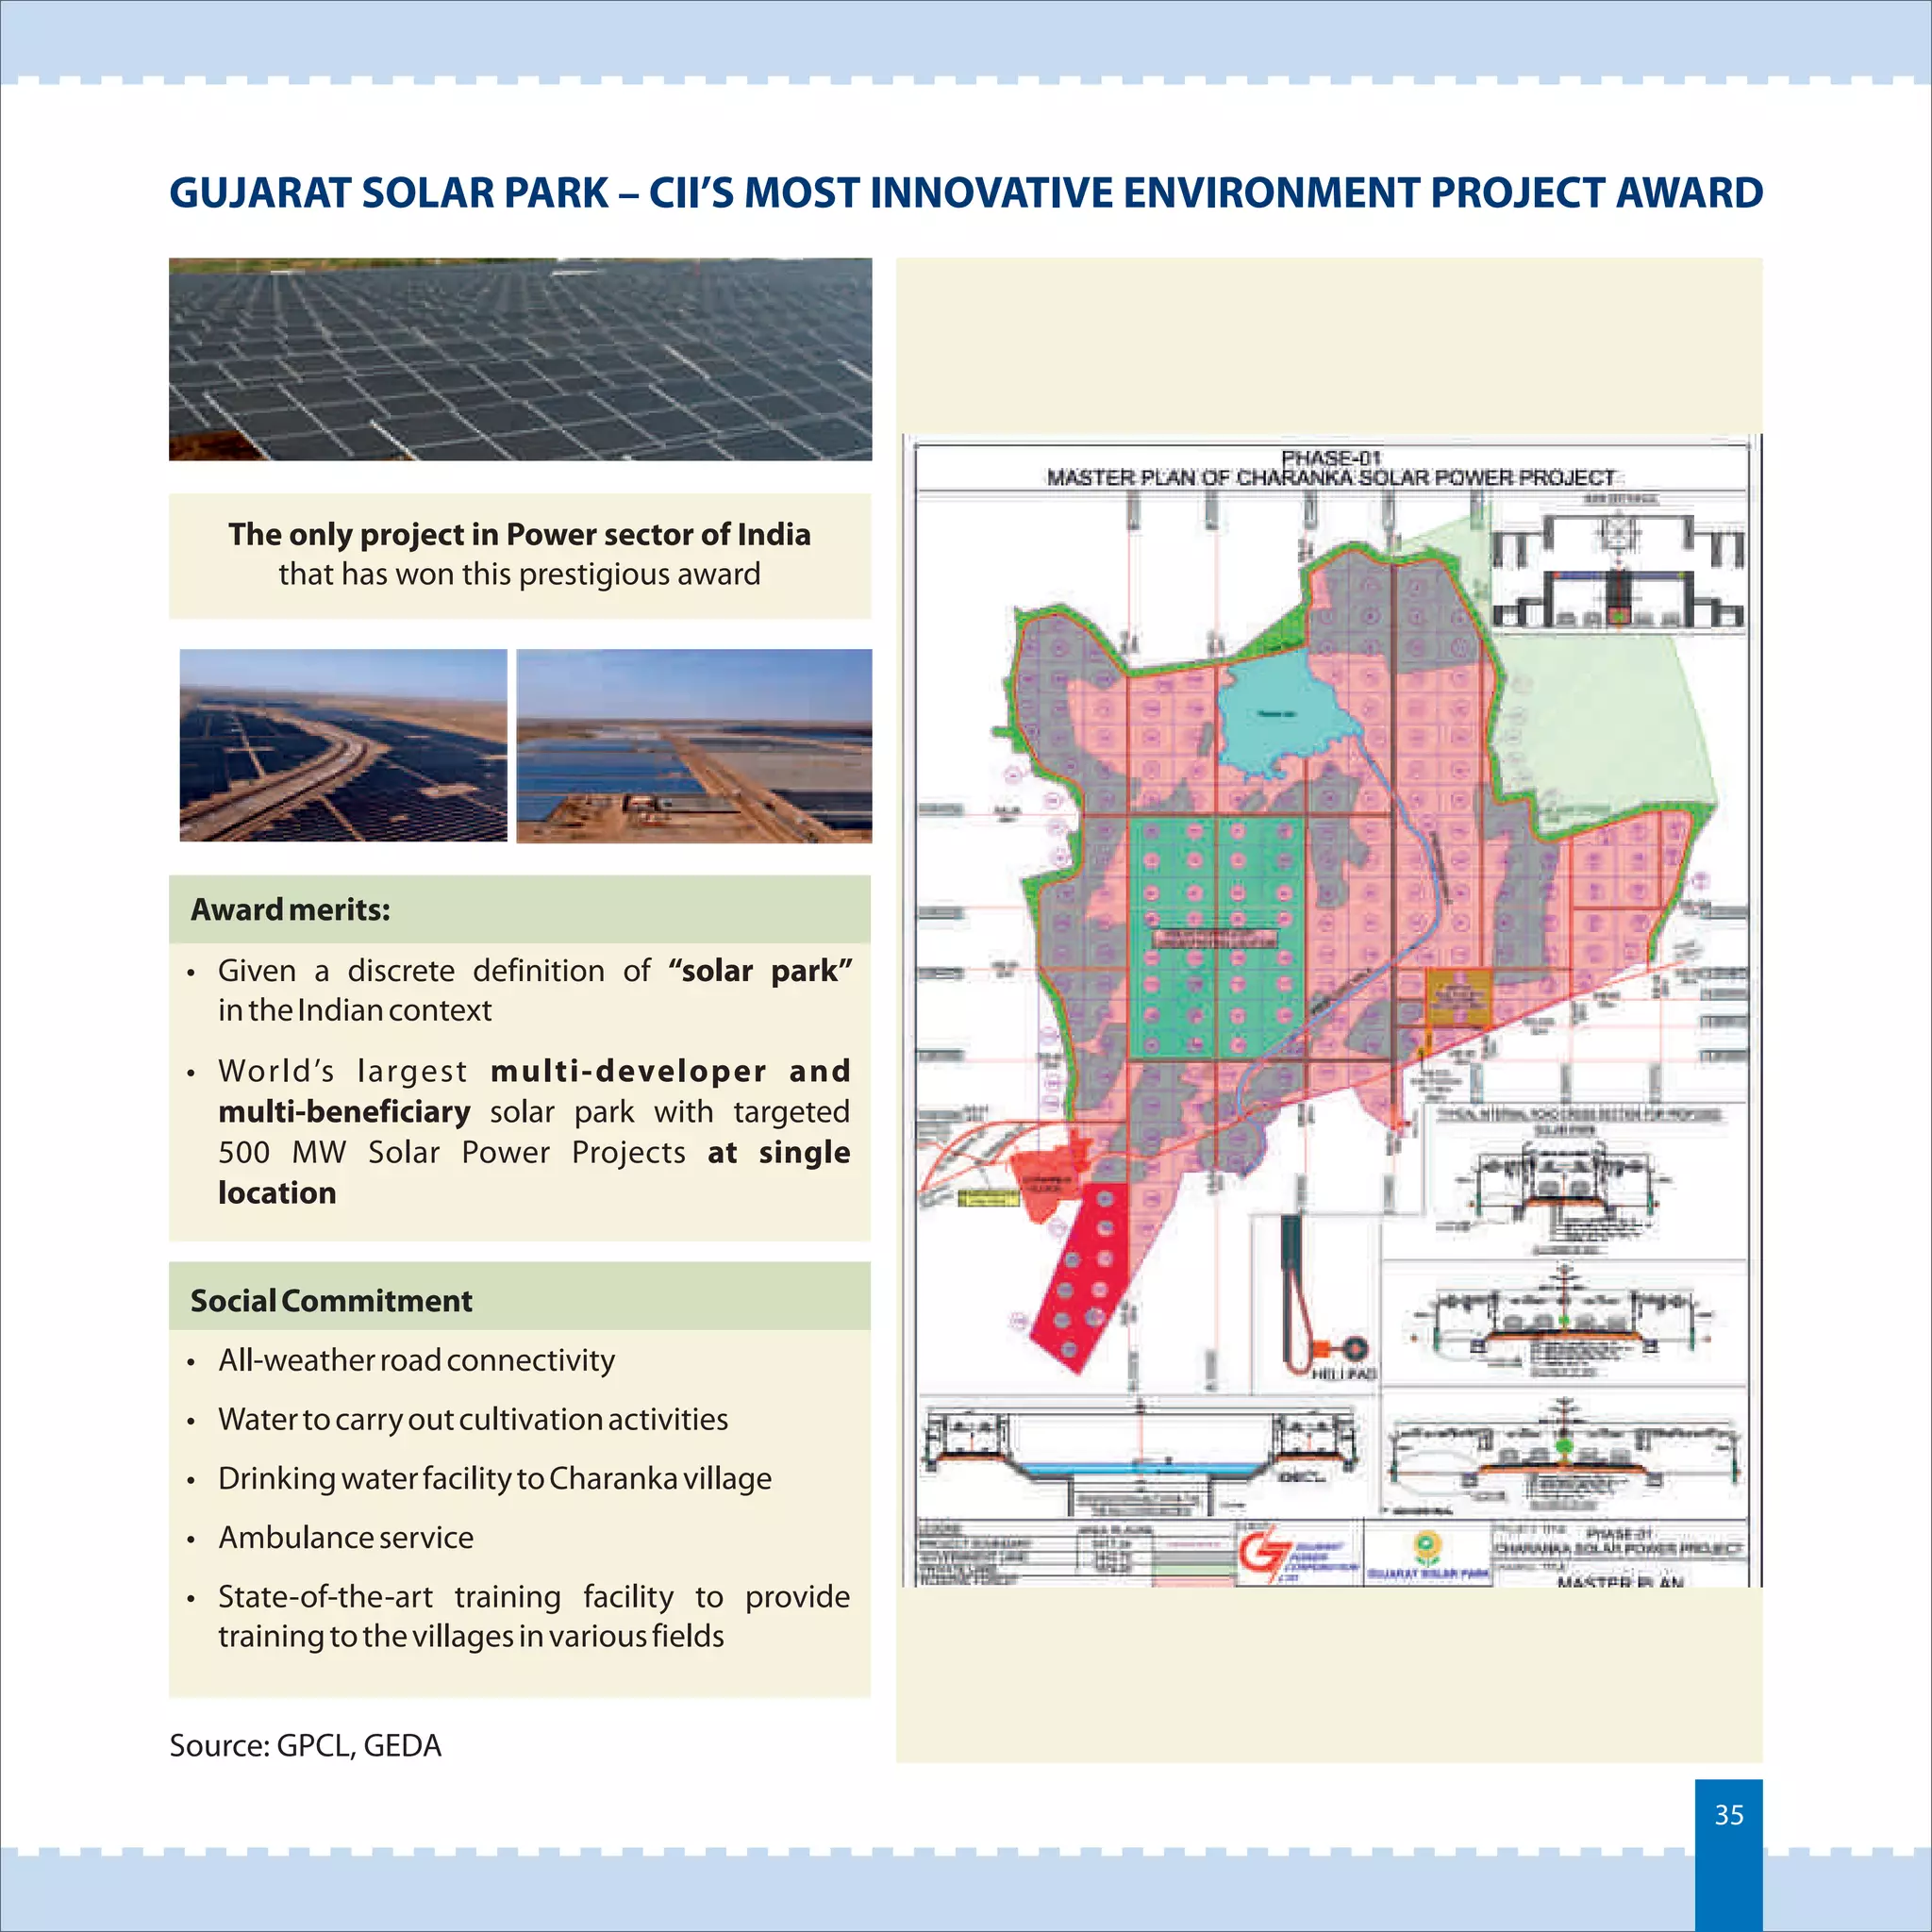
Renewable Energy and Technologies 
SECTOR PROFILE
1. India – Preferred Investment Destination 
2. Gujarat – Preferred Investment Destination in India 
3. Renewable Energy and Technologies 
3.1. Global scenario 
3.2. Indian scenario 
3.3. Gujarat scenario 
3.4. Success stories 
3.5. Scenario in Gujarat by 2020 and investment opportunities 
4. Advantage Gujarat 
5. Doing Business in Gujarat 
6. Key Government Agencies 
Table of Contents
INDIA - PREFERRED INVESTMENT DESTINATION 
1 
01
INDIA - PREFERRED INVESTMENT DESTINATION 
9th largest economy in the 
world by nominal GDP and 
3rd largest by purchasing 
power parity (PPP) 
Recorded the highest growth 
rates in the mid-2000s 
One of the fastest growing 
economies in the world (GDP 
growth rate – 8.6% in 2011) 
GDP growth rate 
15.0% 
10.0% 
5.0% 
Sectors’ contribution to GDP 
CAGR 
Exports 
14% 
CAGR 
Imports 
14% 
India is one of the 
major G-20 economies: 
400 
350 
300 
250 
200 
150 
100 
50 
th the 17 largest exporter and 
th 11 largest importer in the world 
Main Export Partners 
1.73 
1.6 
1.52 
Automobile 
industry 
Construction 
activities 
nd The 2 preferred global 
investment destination 
China 
India 
Brazil 
US 
10% 
Growth 
Decline 
No Change 
(World Investment Prospects Survey 
2010-2012 by UNCTAD) 
USD 254 billion of FDI inflows 
between April 2000 and 
March 2012 
US 
13% 
UAE 
12% 
China 
8% 
Hong Kong 
4% 
Main Import Partners 
China 
12% 
UAE 
7% 
Saudi Arabia 
6% 
US 
6% 
Australia 
5% 
FDI Confidence Index, 2012 
A.T. Kearney Survey 
FDI - Top Sectors 
9.5% 9.6% 9.3% 
6.8% 8.0% 8.6% 
0.0% 
2006 2007 2008 2009 2010 2011 
1.52 
1.87 
0 0.5 1 1.5 2 
Germany 
Services 
30% 
Telecommunications 
12% 
Computer software 
and hardware 
11% 
Real estate 
11% 
Power 
7% 
6% 
Metallurgical 
industries 
5% 
Pharmaceuticals 
5% 
Petroleum 
and natural 
gas 
3% 
- 200 400 600 800 1,000 1,200 
Agriculture Industry Services 
USD, billion 
16% 
17% 
17% 
18% 
19% 
20% 
25% 
26% 
26% 
26% 
25% 
26% 
59% 
58% 
57% 
56% 
56% 
2011-12 
(A) 
2010-11 
(Q) 
2009-10 
2008-09 
2007-08 
2006-07 54% 
Trade Scenario, USD billion 
0 
1990-91 1994-95 2000-01 2004-05 2010-11 
Export Import 
02
World's largest 
democracy with 
1.2 billion people 
Land of abundant 
natural resources 
and diverse 
climatic conditions 
Enabling business 
environment 
with greater global 
participation 
Strong Market 
Fundamentals 
Access to 
technology as 
a result of the 
IT revolution 
Impetus on 
Infrastructure 
Development 
Progressive 
simplification and 
rationalization of 
direct and indirect 
tax structures 
Competitively 
priced skilled 
labour 
ADVANTAGE INDIA 
03
GUJARAT - PREFERRED INVESTMENT DESTINATION IN INDIA 
2 
04
GUJARAT HAS BEEN RANKED 1ST AS PER THE “ECONOMIC FREEDOM RANKINGS 
FOR THE STATES OF INDIA, 2012” REPORT 
Double digit growth rate with Gross State 
Domestic Product of USD 75 billion 
(2010-11) growing at a five year average of 10% 
Growth in agricultural output in 
the state over the last 10 years 11% 
A highly industrialized state - Gross State 
Domestic Product contribution from 
manufacturing sector 28% 
Gujarat’s Degree of Openness 
(ratio of exports from state to 
Gross State Domestic Product) 53% 
A state with a population of 60 million and 
one of the highest urbanization levels 43% 
Increase in seat availability in 
technical institutions over last 3 years 100% 
A state with a high and 
growing literacy rate 79% 
26% A state with one of the highest share in 
investments under implemented projects 
in India 
05
RENEWABLE ENERGY AND TECHNOLOGIES 
3 
06
RENEWABLE ENERGY AND TECHNOLOGIES 
GLOBAL SCENARIO 
India 
3.1 
07
GLOBAL RENEWABLES 
Established global resources 
vs renewable resources 
Solar (Continents) 
Wind 
Biomass 
Geothermal 
Ocean & Wave 
Hydro 
Annual Solar 
Irradiation 
to the Earth 
Global Annual 
Energy Consumption 
Coal 
Gas 
Oil 
Nuclear 
Primary Energy 
Consumption 
• Enough renewable energy resources 
available to satisfy World’s energy 
demand 
• Solar energy alone could meet existing 
global energy needs 10,000 times over 
• International Energy Outlook 
2011 forecasts energy 
consumption growth by 53% 
between 2008 and 2035. 
• It is expected to reach 770 
quadrillion Btu 
World Energy Consumption 
1990-2035, (quadrillion Btu) 
500 
400 
300 
200 
100 
0 
1990 2000 2008 2015 2020 2025 2030 2035 
OECD Non-OECD 
• Total renewable power capacity 
in the world (excluding hydro) 
amounts to 312 GW 
• Renewable energy share 
(non-hydro) of global electricity 
production is 3.3% 
• India accounts for 5% of the 
global renewable electric 
power capacity 
Renewable Electric Power 
Capacity, GW, 2010 
Wind power Biomass power 
Solar PV Geothermal power 
Solar thermal power Tidal power 
400 
300 
200 
100 
0 
World 
US 
China 
Germany 
Spain 
India 
Others 
Top 5 countries 
RE capacity, 2010-11 
1. United States 
2 China 
3 Germany 
4 Spain 
5 India 
Source: REN21., 12th PwC Annual Global Power & Utilities Survey 
08
DRIVERS OF GLOBAL RE MARKET DEVELOPMENT 
market Unit 2008 2010 
Source: REN21., 12th PwC Annual Global Power & Utilities Survey 
Forces driving development of 
renewable energy market 
Focus on 
sustainability 
and lowering 
environmental 
impact 
Continued 
growth in 
energy 
demand 
Stakeholder 
pressure for 
environmental 
action 
Technological 
progress 
driving down 
capital cost 
Energy 
dependence 
and energy 
security 
12th PwC Annual Global Power & 
Utilities Survey – Cleaner energy 
perspectives 
• A major ramping-up of non-hydro 
renewables by 2030 
• 43% is the forecast share of non-fossil 
fuel in generation by 2030 
• Energy Security, energy 
from clean and sustainable 
sources, market competition 
and energy infrastructure are 
the main issues of the power 
market 
• Commitment to a 20:20:20 
a m b i t i o n ( E U ) o f 2 0 % 
emissions reduction, 20% 
renewable energy and 20% 
imp roveme nt i n e n e rg y 
efficiency by 2020 
Select indicators of RE 
development 
Global new investment in 
billion 
renewable energy (annual) USD 130 211 
Solar PV cell production (annual) GW 6.9 24 
Ethanol production (annual) billion litres 67 86 
Biodiesel production (annual) billion litres 12 19 
Countries with policy targets # 79 98 
Countries with feed-in policies # 71 87 
09
RENEWABLE ENERGY AND TECHNOLOGIES 
INDIAN SCENARIO 
3.2 10
RENEWABLE ENERGY – GROWING SHARE IN FUEL MIX 
Pressure on availability and 
cost of primary fuels 
due to growth and 
climate change actions 
are the key drivers 
India installed capacity mix, MW 
Source: MoP, MNRE 
RE market is now seeing a 
slow but definite 
convergence 
Renewable sector is 
dominated by private sector 
and moving towards 
IPP scale producers 
Renewable capacity, MW 
70% 
0.3% 2% 
5% 9% 
14% 
Wind Power 
Small Hydro Power 
Biomass Power 
Bagasse Cogeneration 
Waste to Power 
Solar Power (SPV) 
4,780 , 2% 
131,603 
, 66% 
38,990 
, 20% 
24,503 
, 12% 
Thermal 
Nuclear 
Hydro 
RES 
• India has an installed renewable capacity of 24,500 MW (excluding large hydro) as on March 2012 
• Renewable energy is 12% in total capacity and 4% of energy generation. 
• By 2050 69% of energy generation will be from renewable energy (Greenpeace vision) 
11
INDIA’ S RENEWABLE ENERGY OPTIONS 
India possesses a large, 
untapped renewable 
energy potential 
The resource potential is 
large even with 
current assessments 
Renewable Energy 
Opportunity, MW 
140,000 
120,000 
100,000 
80,000 
60,000 
40,000 
20,000 
- 
Tapped Potential 
Wind Power Small Hydro Power 
Biomass Power Bagasse Cogeneration 
Waste to Power Solar Power 
Grid Interactive Strengths Challenges 
Wind Power 
• • Seasonality- peaks 
Most established renewable 
energy source in India 
• India possesses significant 
untapped potential 
• Strong domestic 
manufacturing base 
• Regulatory support 
in monsoon 
• Higher capital cost per 
unit of generation- relatively 
lower returns due to maturity 
of markets and strong 
discipline of wind turbine 
manufacturers 
Small Hydro 
Power 
(up to 25 MW) 
• Require significantly lower 
time to commissioning 
• Fewer environmental or 
CERC clearances 
• Viable option for base load 
for perennial rivers 
• Regulatory support 
• Seasonality- for rain-fed rivers, 
PLFs contract sharply after 
the monsoon months 
• Relatively capital intensive 
and longer construction 
period compared to other 
renewable options 
• Abundance of biomass 
(agricultural and forestry 
residues) 
• Viable option for base load 
• Relatively short time to 
commissioning 
• Regulatory support 
• Availability of quality feedstock 
round the year- can be a 
challenge, particularly for 
single fuel/ bagasse 
based plants 
Bio-Power (Agro 
residues and 
plantation) 
Bagasse based 
generation 
Energy from 
• Large amount of waste 
Waste generated in India 
• Foreign technology - requires 
adaptability 
• Fuel availability and 
seasonality poses challenges 
Solar 
• Large untapped potential 
Photovoltaic in India 
• Expensive technology as 
compared to other sources 
Geothermal 
• 
Long term solution and 
ability to manage scheduling 
• Technology is yet to pick up 
at commercial scale 
12
POLICIES AND REGULATIONS 
• Renewable power is expected to constitute a significant part of India’s incremental 
capacity addition. 
• A robust regulatory framework has been put in place to realize India’s wind, hydel, solar 
and biomass potential. 
Electricity 
Act 2003 
• Mandated State Electricity Regulatory Commissions (SERCs) to 
• Promote generation of electricity from renewable sources of energy by providing 
suitable measures for connectivity with the grid and sale of electricity to any person 
• Fix certain minimum percentages for purchase of renewable power 
National 
Electricity 
Policy 2005 
• Further provided for progressive increase in generation of electricity from renewable 
sources and supported purchases by distribution companies through competitive bidding 
process 
Tariff 
Policy 2006 
• Provided for fixation by SERCs of a minimum percentage of Renewable Purchase Obligation 
(RPO) from RE sources taking into account availability of such resources in the region and its 
impact on retail tariffs and procurement by distribution companies at preferential tariffs 
determined by the SERCs 
National Action 
Plan on Climate 
Change 2008 
• Outlined existing and future policies and programs addressing climate mitigation and 
adaptation 
• NAPCC has advised that starting 2009-10, RPOs be set at 5% of total grid purchase, and be 
increased by 1% each year for 10 years. 
13
POLICIES AND REGULATIONS – NATIONAL SOLAR MISSION 
• Conceived under the National Action Plan on Climate 
Change 
• Establish India as global leader in solar power by creating 
favourable policy conditions 
• Accelerate generation capacity addition to drive down 
costs and achieve grid parity by 2022 
• National Tariff Policy amended (January 2011) for 
mandatory Solar RPOs for all power utilities 
Phase 1: 2010-13 
Policy framework to 
attract and scale-up 
Grid: 1,100 MW 
Off-grid: 200 MW 
Market based on FIT 
mandatory solar RPO 
Grid competitive 
solar power 
and Grid: 4-10,000 MW 
Grid: 20,000 MW 
Off-grid: 2,000 MW 
Phase 3: 2017-22 
Off-grid: 1,000 MW 
Phase 2: 2013-17 
A. 20 GW Grid based solar power 
projects by 2022 
• Large power plants (5 MW solar PV; 5 to 
100 MW CSP in NSM 1 and 5MW to 
50MW solar PV in NSM 2) 
100 MW rooftop and small projects 
• Connected below 33 kV. Target (10 MW 
of up to 100kW ; and 90 MW of 0.1 to 
2 MW. 
B. 2000 MW off-Grid project by 2022 
• Off grid solar and decentralized solar 
applications. 
• Capital and interest subsidy; refinance 
by IREDA, etc. 
• Other channels to supply & maintain 
products 
C. Support projects 
• Centre of excellence and incubation 
• Demonstration and pilot projects 
- 100 MW parabolic trough based 
- 100-150 MW solar hybrid plant 
- 50-100 MW CSP with storage 
- BIPV projects 
National Solar Mission 
14
SUPPORT MECHANISM FOR RENEWABLE POWER IN INDIA 
Policy Instrument Indian Experience Positives for Developer 
Accelerated 
Depreciation (AD) 
by most states • Financial as well as economic costs and 
wind industry • The sector has attained scale & 
• Acknowledged as the key instrument for success of 
in India 
• Most wind installations in India have been developed under AD. 
viability on its own. 
commercial 
Generation Based 
Incentives (GBI) 
• Recently introduced to shift investment focus from capacity 
to electricity generation – move from capital subsidies (AD) to 
generation based incentive. 
addition • Presents avenues for additional guaranteed 
revenues for project developers 
Renewable 
Purchase 
Obligation (RPO) 
• RPOs are mandated by the Electricity Act 2003 and National 
• RPOs adopted by 23 SERCs 
Tariff Policy • Readymade market for renewable 
power sources 
Clean Energy 
Cess 
• The government plans to develop these funds for 
renewable energy 
development of 
Renewable 
Energy Certificates 
(RECs) 
• MNRE and CERC have developed a REC regime which has kicked 
off recently 
• Serves as a mechanism to fulfill the RPO obligations thereby reducing 
penalties 
• Helps renewable power developers 
to trade RECs and realise the value 
of power 
Carbon 
Trading 
projects • Additional cushion for developers 
• India has largest number of registered and pipeline CDM 
in the world. 
• Helped to push the RE industry by making projects more financially 
attractive 
to increase their project returns 
and RoE 
Tax Incentives - 
Exemptions on 
Capital Investments 
and Generation 
• Tax exemption instruments such as exemptions or reductions on excise 
and customs duty have been introduced 
• Tax Incentives help improving RoE of 
developer 
State RE 
Policies 
• Examples of state with policies for RE include Karnataka, Punjab, Madhya 
Pradesh, Gujarat, Himachal Pradesh, Uttarakhand etc 
• The number of clearances required for 
renewable projects has come down 
Feed in Tariffs/ 
Preferential Tariffs 
• Being used for all active RE technologies. introduced 
except J&K, Bihar, Jharkhand, Odisha and the North Eastern states. 
• Preferred by developers because it enhances project bankability 
benefits of RE are not yet factored in FIT 
• Technology upgradation could lead to better 
returns as it is not considered in FIT 
15
RENEWABLE ENERGY CERTIFICATE 
• Mass market: not subject to the geographic and physical limitations 
• One REC to be issued for every MWh of electricity fed to the grid and metered at the bus-bar of generator 
• REC issued is valid for a period of 1 year 
• Not related to Carbon Credits, both mechanisms operate independent of each other. 
• Pricing of REC component: 
- Sold in the exchange within a range of floor price and ceiling price as fixed by CERC from time to time 
• A renewable generating entity that has: 
Not entered into any PPA at a preferential tariff 
- Sells its power to a local distribution licensee at a cost at or below the Average Power Purchase 
Cost (excl. RE power cost) 
- Sells power either to the third party or through Power Exchanges 
Overview 
Eligibility 
REC: Operational Framework 
Accreditation of RE power plants (State nodal agency: SNA) 
Registration of Eligible entities (Central level agency) 
Information related to accredited RE plants for registered entities sent to REC registry 
Issuance of REC 
RE Generator Central REC 
Sale of electricity at par with 
conventional power 
Discom issuing RE 
injection certificate 
Information 
related to RE 
generation 
State Load 
Despatch Centre 
(SLDC) 
Registry (NLDC) REC exchange 
Auditing Panel 
SERC: Compliance 
based on SNA Report 
2 
3 
5 6 
4 
Electricity Energy 
accounting 
Information on REC purchase/redemption 
State Nodal 
Agency (SNA) 
1 
16
RENEWABLE PURCHASE OBLIGATIONS 
• The Government has set a target of 10% energy 
generation from renewable sources* by 2012 
• In 2007, the Government released draft versions 
of a new policy which seeks to increase the target 
to 20% by 2020 
• Several State Regulators (“SERC”) have translated 
this national target into Renewable Purchase 
Obligations (RPO) 
• RPOs mandate the minimum quantum of 
electricity which distribution utilities in the 
States have to source from renewable sources 
(failing which, a penalty may be imposed on 
them) 
• On a pan-Indian basis, the total RPO 
commitment by the 12 States that have 
implemented it constitutes ~5.33% of the total 
power consumption in 2007-08 
• The RPO system passes on the onus of increasing 
renewable energy consumption to the State 
DISCOMS – effectively the cost of acquiring this 
renewable electricity is passed onto the 
consumer through higher power tariffs 
RPO Targets* (2012) 
STATE RPO 
(% OF 
UNITS SOLD) 
Andhra Pradesh 5% 
Gujarat 6% 
Haryana 1.5% 
Karnataka 7% &10% 
Kerala 3.3% 
Madhya Pradesh 10% 
Maharashtra 7% 
Odisha 5% 
Rajasthan 6% 
Himachal Pradesh 11.1% 
Tamil Nadu 14% 
Uttar Pradesh 5% 
West Bengal 3.8% 
Uttarakhand 4.525% 
Chhattisgarh 5.25% 
* Excludes large hydro projects and nuclear power 
17
CLEAN ENERGY SECTOR IN INDIA-WAY FORWARD 
Interplay of favorable risk-return profile at project level coupled with the emerging Indian 
merchant power opportunity creates a positive strategic framework for Indian renewable IPP players 
Project Level 
• Shorter time-to-commissioning than conventional power projects 
• Fast-track project approval- significantly fewer environmental or CERC clearances required 
compared to conventional power projects 
• Easier to achieve financial closure vis-à-vis larger projects, Greater predictability of project 
execution 
• Plethora of small-to-mid size units in “locally constrained” entrepreneurial setups: ideal for 
consolidation play 
• Bidding route not mandatory for new capacities 
Financial Perspectives 
• Low working capital requirements, particularly for small hydro and wind projects 
• Ability to boost returns through emissions trading options 
• Regulatory support, including preferential tariffs 
• Fiscal incentives (subsidies, grants and tax incentives) available in some States 
Sustainability 
• Lower fuel sourcing and pricing risk compared to conventional power projects 
• Opportunity to de-risk asset portfolio through geographic and technological options- exposure to 
multiple markets, regulatory regimes, technologies and climatic conditions 
• Lower social friction concerns by promoting ‘inclusive growth’ 
• Broadening fuel base complements efforts to decouple India’s economic growth from emissions 
growth and helps to achieve energy security 
Fund requirement 
• Consolidated fund requirement estimated by MNRE (Strategic plan for new and renewable energy 
sector for the period 2011 -17 is 
• For grid connected renewable energy technologies – USD 2.6 billion 
• For off grid renewable energy programs – USD 2.7 billion 
18
RENEWABLE ENERGY AND TECHNOLOGIES 
GUJARAT SCENARIO 
3.319
GUJARAT – RENEWABLE ENERGY POWERHOUSE 
Gujarat’s power sector – strong 
performer 
20.1 
79.8 
100.1 
30.6 
67.0 
97.5 
40.0 80.0 120.0 
Collection 
Efficiency 
(%) 
PLF (%) 
T&D loss 
(%) 
2004-05 2010-11 
Break up of installed power 
capacities in Gujarat, May 2012 
Thermal 
78% 
Nuclear 
3% Hydro 
3% 
Renewabl 
16% 
es 
Break up of installed capacity 
from RE source in 
Gujarat, May 2012 
Wind 
81% 
SHP 
0.2% 
BIO 
1% 
Solar 
18% 
• Share of renewable energy in total energy mix 
in Gujarat is 16% 
• Gujarat’s share of energy from renewable 
energy sources in Western Region 
Gujarat was power deficient is 44% and all India share is 14% 
barely a decade ago, but now 
has a surplus power and a 
vibrant energy sector 
Source: EPD 
The state of Gujarat is blessed with 
abundant renewable energy potential 
Source Total 
Total RE installed 
Potential potential Capacity, % of 
(India), MW (Gujarat), MW total potential 
in Gujarat 
Wind 45,000 10,000 25.8% 
Solar > 100,000 69,000 0.9% 
Biomass 17,000 1,900 1.6% 
Timely tariff revisions have 
made the sector viable enabling 
the state to set up adequate 
generation capacity 
Uninterrupted power supply 
attracts companies to set 
up business in Gujarat 
20
WIND POWER IN GUJARAT 
Over the last 25 years more 
than 65 sites have been 
monitored for wind 
speed and wind power 
density, and over 50 sites have 
been found feasible for 
harnessing wind power 
The State of Gujarat with its longest coast line in the 
country and inland windy sites has a potential of 
over 10,000 MW of wind power. 
Wind Power Density in Gujarat, W/m2 
The Centre for Wind Energy Technology, an autonomous R&D institution under MNRE, 
Source: TERI, GEDA 
has identified and approved 40 sites for wind energy deployment with annual 
average wind power density greater than 200 W/sq. m. at a 50 m height in Gujarat. 
21
WIND POWER IN GUJARAT 
The state, having embarked upon an ambition plan to tap 
the large wind power potential, achieved commendable 
results: total installed capacity of wind power grew from 
271 MW in 2005-06 to 2,885 MW in 2011-12 
at CAGR of 48% 
Cumulative wind capacity in Gujarat, MW 
271 
3500 
3000 
2500 
2000 
1500 
1000 
500 
Wheeling: At 66 kV: Normal charges as applicable to open access 
Source: GEDA, GERC 
2,885 
0 
Up to 
2005-06 
CAGR 
48% 
2006-07 2007-08 2008-09 2009-10 2010-11 2011-12 
In November 2008 Gujarat won the Best 
Wind Power Developer State (Percentage 
Increase) Award 2008 for achieving the 
maximum capacity additions during 
the two consequent year FY07 and 
FY 08 alone the coast of Saurashtra 
Wind Power Policy and GERC regulatory features 
Eligible Unit: Any company/corporate body/association/body of individuals 
Sale: Fixed tariff 
Tariff: Rs. 3.56 / kWh for 25 years 
Open Access / 3rd party sale: Allowed 
Below 66 kV: Normal charges as applicable to open access + 10% of generated 
fed to the grid 
Land: Revenue waste land @ 1 hectare per Wind turbine generator on long term lease of 
20 years to the developer at a lease rent of Rs. 10,000/ha/year 
22
SOLAR POWER IN GUJARAT 
Gujarat has one of the highest 
solar generation potential 
in India (solar radiation – 
5.6-6.0 kWh/m2/day for 300 days 
The area with the highest solar 
potential is the district of 
Kachchh with the highest direct 
solar insolation 6.4 kWh/sq. m. 
/ day throughout the year and 
310 sunny days. 
It covers a total area of 45,652 sq 
km and located on the Tropic of 
Cancer 23.26 N. The sites do not 
require sun tracing. 
Districts with the highest 
GH/DN Irradiance, kWh/m2/year 
Source: TERI, GEDA 
23 
GHI DNI 
Jamnagar 2,216 2,697 
Junagadh 2,212 2,661 
Navsari 2,110 2,427 
Patan 1,883 2,008
SOLAR POWER IN GUJARAT 
Asia’s first 500 MW Solar Power Park at 
Charanka, district Patan 
Source: TERI, GEDA 
Gujarat has taken the lead over other states in renewable 
energy initiatives, particularly in solar power generation. 
It is the first state in India to achieve RPO target 
654.81 MW of solar power capacities commissioned 
by 64 developers in the state of Gujarat 
Solar Power Policy 
1st state policy in the country 
Phase Developers Capacity, 
(Nos.) MW 
Phase I allotment 57 406.5 
Phase II allotment 27 562.0 
Total 84 968.5 
Gujarat’s largest solar 
power plants, as on May 2012 
District MW 
Adani Enterprises Ltd. Kachchh 40 
Sanland Real Estate Pvt. Ltd. Banaskantha 25 
Tata Power Company Ltd. Jamnagar 25 
Alex Astral Power Pvt. Ltd. Patan 25 
Roha Dyechem Pvt. Ltd. Patan 25 
Sun Edison Energy India Pvt. Ltd. Patan 25 
Kiran Energy Solar Power Pvt. Ltd. Patan 20 
PLG Photovoltaic Patan 20 
Hiraco Renewable Energy Pvt. Ltd. Porbandar 20 
• 76% of developers who signed PPAs under the 
policy have commissioned their projects 
• 68% of allocated capacities have been 
commissioned. They help 
• generating ~1,048 million kWh of electricity 
annually 
• avoiding 0.72 million tonnes of coal 
annually 
• reducing carbon emissions of 1.04 million 
tonnes annually 
24
SOLAR POWER IN GUJARAT 
Source: GETCO, GPCL 
Geographical locations of solar power projects 
25
SOLAR POWER IN GUJARAT 
Summary of solar Tariffs, Rs./kWh 
(projects commissioned Jan 29, 2012 - March 31, 2015) 
Period Jan 29, 2012 – 
Apr 1, 2013 – Apr 1, 2014 – 
Mar 31, 2012 Mar 31, 2014 Mar 31, 2015 
Megawatt-scale PV projects availing 
accelerated depreciation 
Levelized tariff for 25 years 9.28 8.63 8.03 
First 12 years 9.98 9.13 8.35 
Subsequent 13 years 7.00 7.00 7.00 
Megawatt-scale PV projects not availing 
accelerated depreciation 
Levelized tariff for 25 years 10.37 9.64 8.97 
First 12 years 11.25 10.30 9.42 
Subsequent 13 years 7.50 7.50 7.50 
Kilowatt-scale PV projects availing 
accelerated depreciation 
Levelized tariff for 25 years 11.14 10.36 9.63 
Kilowatt-scale PV projects availing 
accelerated depreciation 
Levelized tariff for 25 years 12.44 11.57 10.76 
Levelized Tariff for Solar Thermal Projects 
With accelerated depreciation benefit 11.55 per kWh for 25 years 
Without accelerated depreciation benefit 12.91 per kWh for 25 years 
Source: GERC Order No. 1 of 2012: Determination of tariff for Procurement by the Distribution Licensees and others 
from Solar Energy Projects; 27 Jan. 2012 
26
BIOENERGY IN GUJARAT 
Biomass potential in Gujarat 
Crop Residue 
Forest Residue 
Districts with the highest biomass potential, MW 
Crop 
Rajkot 228 
Jamnagar 203 
Bhavnagar 192 
Junagadh 168 
Surendranagar 142 
Amreli 137 
Source: TERI, GEDA 
Forest 
Junagadh 18 
The dangs 18 
Sabarkantha 16 
Valsad 15 
Dahod 12 
Banaskantha 11 
The total biomass potential for 
Gujarat is about 1,800 MW from crop 
residue and about 140 MW from 
forest residue 
Bioenergy power generation 
31.20 MW capacity biomass projects 
commissioned in Amreli, Junagadh 
and Vadodara 
13.23 MW waste-to-energy power 
generation projects 
Bioenergy programmes 
Institutional biogas plants 9835 m3/day 
capacity in various institutions 
across the state 
27
BIOENERGY IN GUJARAT 
Tariff for Biomass based power projects to be commissioned in the state of Gujarat 
during the control period (June 2010 – March 2013), Rs/kWh 
Tariff Initial 10 years 11th year onwards 
With accelerated depreciation 4.40 4.75 
Without accelerated depreciation 4.45 4.80 
Tariff for Bagasse based co-generation projects to be commissioned in the state of 
Gujarat during the control period (June 2010 – May 2013), Rs/kWh 
Tariff Initial 10 years 11th year onwards 
With accelerated depreciation 4.55 4.90 
Without accelerated depreciation 4.61 4.96 
Source: GERC Order No. 5 of 2010: Determination of tariff for Procurement of Power by Distribution Licensees from 
Biomass based Power Generator and Other Commercial Issues, 17 May 2010 
GERC Order No. 4 of 2010:Determination of tariff for Procurement of Power by Distribution Licensees from Bagasse 
based co-generation Power Plants and Other Commercial Issues, 31 May 2010 
28
NEW ENERGY IN GUJARAT 
Source: TERI, GEDA 
The state endeavors to become the leader in terms of capacity and introduction 
of new technologies in other renewable energy sources, like wind-solar 
hybrid, WTE, OTEC, tidal energy, etc. 
The total potential for wind solar 
hybrid installations is about 
74,000 MW with the largest potential 
in Rajkot and Kachchh 
Gujarat has the 1,600 km coast line 
and good wind velocity offshore. 
The total offshore wind 
potential is about 4,000 MW 
Districts with the highest hybrid potential, MW 
Wind solar hybrid 
installation, MW 
Rajkot 23,182 
Kachchh 16,151 
Jamnagar 8,707 
Surendranagar 6,625 
Amreli 3,585 
Bhavnagar 2,514 
Sabarkantha 2,303 
Banaskantha 2,044 
Junagadh 2,038 
29
NEW ENERGY IN GUJARAT 
Gujarat geothermal potential is 
concentrated in Khambhat 
25 MW capacity of geothermal energy is currently 
utilized for direct heat in Gujarat (Khambhat) 
Geothermal power pilot projects are being 
planned in the state 
Source: TERI, GEDA, World Geothermal Congress 2010 
Tidal Potential in Gujarat, MW 
The following two sites were identified as potential sites 
for setting up tidal wave based power project in the State: 
• Gulf of Khambhat 
• Gulf of Kachchh 
Potential site Tidal energy 
potential, MW 
Gulf of Kachchh 503 
Gulf of Khambhat 6,303 
Total 6,806 
30
RENEWABLE ENERGY AND TECHNOLOGIES 
SUCCESS STORIES IN GUJARAT 
Source: TERI, GEDA 3.431
MODEL SOLAR CITY PROJECT - GANDHINAGAR 
Source: MNRE, GEDA 
Government of India declared 
Gandhinagar as a Model Solar City 
setting example for Solar Cities 
throughout India and other nations 
Ministry of New and Renewable Energy 
(MNRE) has launched a program on 
“Development of Solar Cities” on January 24, 2011 
The program assists Urban Local Governments in: 
• Preparation of a master plan for increasing energy 
efficiency and renewable energy supply in the city 
• Setting-up institutional arrangements for the 
implementation of the master plan. 
• Awareness generation and capacity building 
activities. 
The program aims at minimum 10% reduction in 
projected demand of conventional energy at the 
end of five years, which can be achieved through a 
combination of energy efficiency measures and 
enhancing supply from renewable energy sources 
Rajkot and Surat have received 
in-principle approval under this programme 
Gandhinagar: 
The Model Solar City project 
10 KW capacity wind-solar hybrid system 
commissioned at Udyog Bhavan, Gandhinagar 
19 solar rooftop systems of 10 KW each 
commissioned at government buildings 
in Sachivalaya, Gandhinagar 
1,240 KW SPV-based grid-connected 
power generating rooftop systems at 
government buildings 
240 solar rooftop systems of 1 KW each 
commissioned at godowns 
6 solar hybrid systems of 5 KW each 
commissioned on government buildings 
32
5 MW GANDHINAGAR SOLAR ROOFTOP PROGRAMME 
Government of Gujarat has launched the ambitious “Gandhinagar (Solar) Photovoltaic Rooftop 
Programme” to encourage alternative clean energy sources like solar energy as well as social participation to 
advance towards energy self-sustainability 
To be implemented in 
• Surat 
• Rajkot 
• Mehsana 
• Bhavnagar 
• Vadodara 
Opportunity for rooftop owners 
• This Programme provides an opportunity to property owners in Gandhinagar City for participation by offering 
their rooftop or terrace for installation of Solar Photovoltaic System (SPV) for solar power 
• The owner of property will be paid a “Green Incentive,” which shall be based on the units (kWh) of electricity 
generated by the SPV system installed on the property 
Role of project developer 
• In this programme the developer is selected through a transparent competitive bidding process. The selected 
developer will finance/Install/Own/Operate and maintain PV roof systems on owners roof tops 
• The energy generated from this system will be sold to Distribution Company and Distribution Company will 
pay duly approved tariff to developers 
• Selected developers will execute the “Green Incentive and Lease Agreement” with individual property owners, 
whose rooftop or terrace will be utilized for the SPV system 
Source: GPCL 
33
SOLAR PARK – FLAGSHIP PROJECT OF GUJARAT 
Solar Park Concept 
Concentrated zone of development for 
solar power related activities 
• Solar thermal/PV generation based 
projects 
• Solar components manufacturing/ 
assembling 
• Research and development 
• Capacity Building 
Single window facility for solar power project 
d e v e l o p e r s f o r p r o v i d i n g c o m m o n 
infrastructure facilities like 
• Land facilities 
• Water and drainage facilities 
• Water treatment plant 
• Electrical network with 66 kV substation for 
auxiliary power 
• 400x220x66 kV substation – Power 
evacuation system 
• Excellent Road (approach and internal 
roads) 
• Green belt 
• Helipad 
• Fully developed office space 
• Residential accommodation and medical 
assistance 
Ensure implementation of the policies of 
government of Gujarat for development of 
the solar power sector 
Source: GEDA, GPCL 
Key Features 
Area: approx. 2,000 Ha 
Capacity Installed: 231 MW 
No. of developers: 21 
Solar Park Framework 
Gujarat Solar Park, Charanka, Patan district 
GEDA Financial Institutes 
GPCL 
Nodal Agency for Solar 
Park development 
GETCO 
SSNNL 
GERC/CERC 
Government 
agencies 
Transmission 
infrastructure 
Water 
availability 
Tariff 
determination 
Tariff 
determination 
Shared with solar 
developer, 
manufacture, R&D 
setup 
Processed 
applications 
Policy 
directives 
Project 
funding 
Infrastructure 
development 
charge 
34
GUJARAT SOLAR PARK – CII’S MOST INNOVATIVE ENVIRONMENT PROJECT AWARD 
The only project in Power sector of India 
that has won this prestigious award 
Award merits: 
• Given a discrete definition of “solar park” 
in the Indian context 
• World’s largest multi-developer and 
multi-beneficiary solar park with targeted 
500 MW Solar Power Projects at single 
location 
Social Commitment 
• All-weather road connectivity 
• Water to carry out cultivation activities 
• Drinking water facility to Charanka village 
• Ambulance service 
• State-of-the-art training facility to provide 
training to the villages in various fields 
Source: GPCL, GEDA 
35
INDIA’S FIRST CANAL-TOP SOLAR POWER PROJECT 
Gujarat has initiated the world’s first 
canal-based solar power project on Narmada 
branch canal new Chandrasan 
village of Mehsana district 
Technical details Innovative ideas 
• Projected energy production: 1.5 million 
units/year/MW 
• Irradiation: 4.6 – 6.4 kWh/m2 
• Installed capacity: 1 MWp 
• Technology: polycrystalline solar modules, 280 Wp 
• Number of modules: 3616 
• Canal length used: 750 m 
• Power evacuation system: 11 KV 
Source: GSECL 
1 MW CANAL BASED SOLAR POWER PLANT 
Energy generated from this pilot project will be 
directly fed into the local electricity grid and 
utilized by nearby towns and villages 
Cover the canal with Solar Panels to 
• Save Land @ 5 acre per MW 
• Minimize evaporation from canal (9 million liters 
water saving per MW per year) 
• Produce eco-friendly power 
• Shadowing effect of panel results in reduced 
photosynthesis and less algae growth leading to 
less maintenance cost 
36
BIOENERGY 
Source: GEDA 
0.95 MW biogas based power project at Sayaji Industries, Kathwada, 2009-10 
Sayaji Industries, Kathwada is dealing with maize starch products. As a result of maize corn milling, grinding and 
processing, about 14000 nm3 biogas is generated. Earlier biogas was being used in the coal fired boilers. 
Under the MNRE programme of energy recovery from industrial & commercial wastes, the biogas based power 
project was taken up. The project commissioned in April 2009 and has been running successfully at about 80% 
PLF since commissioning 
12000 nm3 biogas per day (1 MWeq.) maize starch industry liquid waste based biomethanation 
plant by Gujarat Ambuja Exports Ltd., at Dalpur , Dist: Sabarkantha 2009-10 
12000nm3 /day capacity biomethanation plant is completed & commissioned in December 2009 under MNRE 
waste-to-energy (WTE) scheme. Plant has been running successfully since its commissioning date. Produced 
biogas gas is used in 100% biogas engines in CPP. 
0.833 MWeq.(10000 nm3/day) capacity maize starch industry liquid waste based biomethanation 
plant at Sayaji Industries Ltd., Kathwada, 2010-11 
Sayaji Industries, Kathwada increased its maize grinding capacity from 325 MT/day to 550 MT/day, the effluent also 
increased with higher COD value of about 16000 to 20000 KGs COD. One 10000 nm3/day capacity biomethanation 
plant has been installed & commissioned December 2011.The same is working with more than 80% efficiency. 
The produced biogas is used in its CPP. 
Industrial Waste based 4800 nm3/day capacity biomethanation project at 
Anil Starch Products Ltd., Ahmedabad, 2000-01 
An up flow anaerobic sludge blanket technology reactor (UASB) having total bio-gas generation capacity of 
4800 nm3/day has been installed at M/s Anil Starch Products Ltd. under waste-to-energy project related interest 
subsidy scheme of MNRE for WTE projects during financial year 2000-2001 
2.0 MW capacity Bio-gas based Power Generation Project, Ankleshwar, 1997-98 
This project was commissioned during FY98 under MNRE capital investment subsidy scheme on WTE projects by 
Kanoria Chemicals Industries Ltd. 
37
GUJARAT – PREFERRED DESTINATION FOR INVESTMENTS IN RENEWABLES 
Renewable Energy Sector received a major boost at Vibrant Gujarat Summit in 2009 and 2011 
Special Investment Packages announced for Solar and Wind Power Generation 
2011 
Sector MoU signed Capacity Amount 
Source: GEDA, iNDEXTb 
Employment 
(Nos) (MW) (USD billion) Generation 
Potential (Nos) 
Solar Equipment Manufacturing 36 2,440 4.5 27,500 
Wind Power Generation 28 5,071 6.7 10,142 
Tidal Power Generation 1 250 1.1 2,440 
Electromagnetism 1 
TOTAL 66 7,761 12.3 40,082 
2009 
• Highest number of MoUs signed in the renewable energy sector (32% of total number of MoUs) 
• Total capital investment of USD 22 billion 
• 70 MoUs signed for solar and wind power projects for 10,321 MWe. 
• Expected employment generation is 45,000 over the next five years 
38
LARGE RENEWABLE ENERGY PLAYERS IN GUJARAT 
Solar power developers 
Solar PV manufacturers 
Wind power developers 
Wind equipment 
manufacturers 
JJ PV Solar Pvt. Limited 
Ritika Systems Private Limited 
Sunrise Technology 
Sonki Solar India 
Topsun Energy Limited 
Vimal Electronics 
TATA BP Solar India Ltd. 
Star Energy Systems 
Jain Energy 
Waaree 
GreenBrilliance Energy Pvt. Ltd. 
Euro Solar Power Pvt. Ltd. 
39
RENEWABLE ENERGY AND TECHNOLOGIES 
SCENARIO IN GUJARAT BY 2020 AND INVESTMENT OPPORTUNITIES 
SSoouurrccee:: TGEERDI,A G, EiNDDAEXTb 3.5 40
RENEWABLE ENERGY IN GUJARAT BY 2020 
NAPCC* goal: 1% annual increase of 
RE power to the national grid, from 5% in 
2009-10 to 15% of the energy mix by 2020 
Expected capacity addition in RE sector by 2017 
will be 4,297 MW with highest contribution 
from wind – 50% and solar – 44% 
Total installed capacity from RE 
ources by 2017 – 7,863 MW 
Installed 12th five year Plan period Capacity 
Source / 
Technology capacity (MW) additions 
as on May 2012 FY13 FY14 FY15 FY16 FY17 12th Plan 
Wind 2,885 326 377 456 498 508 2,165 
SHP 6 2 3 4 3 3 15 
BIO 20 35 45 55 60 44 239 
Solar 655 209 331 331 441 560 1,872 
WTE 0 2 2 0 2 6 
Total 3,566 572 758 848 1,002 1,117 4,297 
Source: Energy and Petrochemicals Department 
* National Action Plan on Climate Change 
41
INVESTMENT OPPORTUNITIES 
Fund requirement 
Non- Conventional power 
projects under private sector 
Project Fund required 
(USD billion) 
Wind 2.65 
SHP 0.02 
Bio Mass 0.24 
Solar 3.82 
WTE 0.01 
Total 6.74 
Development of 
distributed gas 
based power combined 
Source: Energy and Petrochemicals Department, Government of Gujarat 
with non 
conventional sources 
Tidal and geothermal 
projects first at a pilot 
scale, and then at a 
commercial scales 
Development of 
wind-solar hybrid 
installations and 
biomass projects 
Development of large 
scale solar parks and 
canal-top 
solar projects 
Offshore wind 
projects 
development 
Development of solar 
manufacturing 
capacities 
Development of 
projects under solar 
rooftop programme 
(Bhavnagar, Surat, 
Rajkot, Mehsana) 
42
ADVANTAGE GUJARAT 
Source: TERI, GEDA 4 43
GUJARAT – THE STATE WITH STRATEGIC LOCATION 
44
GUJARAT – INDIA’S ECONOMIC POWERHOUSE 
45
GUJARAT – ROBUST INFRASTRUCTURE 
46
GUJARAT – STRONG URBAN, SOCIAL AND EDUCATIONAL INFRASTRUCTURE 
47
GUJARAT – LAND OF INNOVATIVE HUMAN CAPITAL 
48
GUJARAT – NEW PARADIGM FOR INDUSTRIAL GROWTH 
The current phase – involving Integrated development of large areas like SIRs, 
PCPIR and DMIC – is poised to transform the industrial scenario in the state 
Phase of industrial development 
Level of Integration 
202 Industrial 
Estates 
83 product 
clusters 
SEZs 
• Multi product 
• Chemical 
• Textile 
• Pharma 
• IT / ITeS 
• Electronics 
• Engineering 
• Biotech 
• Gems & 
Jewellery 
Integrated large area 
developments 
• Special Investment Regions 
(>100 sq. km.) and Industrial Areas 
(50-100 sq. km.) 
• Delhi Mumbai Industrial Corridor 
• GIDC Industrial Estates 
• Petroleum, Chemicals and 
Petrochemicals Investment Region 
• Knowledge corridor 
• Logistics parks 
• Theme towns 
Phase I Phase II Phase III Phase IV 
49
GUJARAT - PROACTIVE GOVERNANCE 
Source: Socio-Economic Review Gujarat, 2011-12, Department of Economic affairs, March 2009 
50
OPPORTUNITIES TO INVEST IN GUJARAT 
51
DOING BUSINESS IN GUJARAT 
5 
Source: TERI, GEDA 52
OVERALL FRAMEWORK FOR DOING BUSINESS 
53
TAX FRAMEWORK 
54
EXCHANGE CONTROL REGIME 
55
FRAMEWORK FOR SETTING UP INDUSTRY IN GUJARAT 
56
KEY GOVERNMENT AGENCIES 
Source: TERI, GEDA 6 
57
INDUSTRIAL PROMOTION FACILITATORS 
58
KEY CONTACT PERSONS 
Mr. Maheshwar Sahu, IAS 
Principal Secretary (Industries & Mines) 
Industries & Mines Department 
Phone: +91 79 23250703 
secimd@gujarat.gov.in 
www.imd-gujarat.gov.in 
Mr. D.J. Pandian, IAS 
Principal Secretary (Energy & Petrochemicals) 
Energy & Petrochemicals Department 
Phone: +91 79 23250771 
secepd@gujarat.gov.in 
www. guj-epd.gov.in 
Mr. B.B. Swain, IAS 
Vice Chairman & Managing Director 
Gujarat Industrial Development Corporation 
Phone: +91 79 23250583, Fax: +91 79 23250587 
vcmd@gidcgujarat.org 
www.gidc.gov.in 
Mr. Kamal Dayani, IAS 
Industries Commissioner 
Industries Commissionerate 
Phone: +91 79 23252683, Fax : 91(79)232 52683 
comind@gujarat.gov.in 
www.ic.gujarat.gov.in 
Mr. Mukesh Kumar, IAS 
Managing Director 
Industrial Extension Bureau 
Phone: +91 79 232 50492, Fax: +91 79 232 50490 
indextb@indextb.com 
www.indextb.com 
Mr. A.K. Sharma, IAS 
Chief Executive Officer 
Gujarat Infrastructure Development Board 
Phone: +91 79 23232701, Fax: +91 79 23222481 
ceo@gidb.org 
www.gidb.org 
Dr. K.U. Mistry 
Chairman 
Gujarat Pollution Control Board 
Phone: +91 79 23232152, Fax: +91 79 23232156 
chairman-gpcb@gujarat.gov.in 
www.gpcb.gov.in 
Mr. D.P. Joshi 
Director 
Gujarat Energy Development Agency 
Phone: +91 79 23257251 
director@geda.org.in 
www. http://geda.gujarat.gov.in 
59
National Partner Knowledge Partner Exhibition Partner 
Relationship Partner Airline Partners 
nd Head Office: Block No. 18, 2 Floor, Udyog Bhavan, GH-4, Sector 11, Gandhinagar 382 010 Gujarat, INDIA 
Phone: +91-79-23250492/93 Fax: +91-79-23250490 
www.indextb.com, www.ic.gujarat.gov.in E-mail: indextb@indextb.com 
Regional Office: A-6, State Emporia Building, Baba Kharak Singh Marg, New Delhi 110 001, INDIA 
Telefax: 011-23747002, 23360049 E-mail: indextbnd@indextb.com 
For more details and online registration, log on to www.vibrantgujarat.com

Vibrant Gujarat - Renewable Energy Sector Profile

  • 1.
    Renewable Energy andTechnologies SECTOR PROFILE
  • 2.
    1. India –Preferred Investment Destination 2. Gujarat – Preferred Investment Destination in India 3. Renewable Energy and Technologies 3.1. Global scenario 3.2. Indian scenario 3.3. Gujarat scenario 3.4. Success stories 3.5. Scenario in Gujarat by 2020 and investment opportunities 4. Advantage Gujarat 5. Doing Business in Gujarat 6. Key Government Agencies Table of Contents
  • 3.
    INDIA - PREFERREDINVESTMENT DESTINATION 1 01
  • 4.
    INDIA - PREFERREDINVESTMENT DESTINATION 9th largest economy in the world by nominal GDP and 3rd largest by purchasing power parity (PPP) Recorded the highest growth rates in the mid-2000s One of the fastest growing economies in the world (GDP growth rate – 8.6% in 2011) GDP growth rate 15.0% 10.0% 5.0% Sectors’ contribution to GDP CAGR Exports 14% CAGR Imports 14% India is one of the major G-20 economies: 400 350 300 250 200 150 100 50 th the 17 largest exporter and th 11 largest importer in the world Main Export Partners 1.73 1.6 1.52 Automobile industry Construction activities nd The 2 preferred global investment destination China India Brazil US 10% Growth Decline No Change (World Investment Prospects Survey 2010-2012 by UNCTAD) USD 254 billion of FDI inflows between April 2000 and March 2012 US 13% UAE 12% China 8% Hong Kong 4% Main Import Partners China 12% UAE 7% Saudi Arabia 6% US 6% Australia 5% FDI Confidence Index, 2012 A.T. Kearney Survey FDI - Top Sectors 9.5% 9.6% 9.3% 6.8% 8.0% 8.6% 0.0% 2006 2007 2008 2009 2010 2011 1.52 1.87 0 0.5 1 1.5 2 Germany Services 30% Telecommunications 12% Computer software and hardware 11% Real estate 11% Power 7% 6% Metallurgical industries 5% Pharmaceuticals 5% Petroleum and natural gas 3% - 200 400 600 800 1,000 1,200 Agriculture Industry Services USD, billion 16% 17% 17% 18% 19% 20% 25% 26% 26% 26% 25% 26% 59% 58% 57% 56% 56% 2011-12 (A) 2010-11 (Q) 2009-10 2008-09 2007-08 2006-07 54% Trade Scenario, USD billion 0 1990-91 1994-95 2000-01 2004-05 2010-11 Export Import 02
  • 5.
    World's largest democracywith 1.2 billion people Land of abundant natural resources and diverse climatic conditions Enabling business environment with greater global participation Strong Market Fundamentals Access to technology as a result of the IT revolution Impetus on Infrastructure Development Progressive simplification and rationalization of direct and indirect tax structures Competitively priced skilled labour ADVANTAGE INDIA 03
  • 6.
    GUJARAT - PREFERREDINVESTMENT DESTINATION IN INDIA 2 04
  • 7.
    GUJARAT HAS BEENRANKED 1ST AS PER THE “ECONOMIC FREEDOM RANKINGS FOR THE STATES OF INDIA, 2012” REPORT Double digit growth rate with Gross State Domestic Product of USD 75 billion (2010-11) growing at a five year average of 10% Growth in agricultural output in the state over the last 10 years 11% A highly industrialized state - Gross State Domestic Product contribution from manufacturing sector 28% Gujarat’s Degree of Openness (ratio of exports from state to Gross State Domestic Product) 53% A state with a population of 60 million and one of the highest urbanization levels 43% Increase in seat availability in technical institutions over last 3 years 100% A state with a high and growing literacy rate 79% 26% A state with one of the highest share in investments under implemented projects in India 05
  • 8.
    RENEWABLE ENERGY ANDTECHNOLOGIES 3 06
  • 9.
    RENEWABLE ENERGY ANDTECHNOLOGIES GLOBAL SCENARIO India 3.1 07
  • 10.
    GLOBAL RENEWABLES Establishedglobal resources vs renewable resources Solar (Continents) Wind Biomass Geothermal Ocean & Wave Hydro Annual Solar Irradiation to the Earth Global Annual Energy Consumption Coal Gas Oil Nuclear Primary Energy Consumption • Enough renewable energy resources available to satisfy World’s energy demand • Solar energy alone could meet existing global energy needs 10,000 times over • International Energy Outlook 2011 forecasts energy consumption growth by 53% between 2008 and 2035. • It is expected to reach 770 quadrillion Btu World Energy Consumption 1990-2035, (quadrillion Btu) 500 400 300 200 100 0 1990 2000 2008 2015 2020 2025 2030 2035 OECD Non-OECD • Total renewable power capacity in the world (excluding hydro) amounts to 312 GW • Renewable energy share (non-hydro) of global electricity production is 3.3% • India accounts for 5% of the global renewable electric power capacity Renewable Electric Power Capacity, GW, 2010 Wind power Biomass power Solar PV Geothermal power Solar thermal power Tidal power 400 300 200 100 0 World US China Germany Spain India Others Top 5 countries RE capacity, 2010-11 1. United States 2 China 3 Germany 4 Spain 5 India Source: REN21., 12th PwC Annual Global Power & Utilities Survey 08
  • 11.
    DRIVERS OF GLOBALRE MARKET DEVELOPMENT market Unit 2008 2010 Source: REN21., 12th PwC Annual Global Power & Utilities Survey Forces driving development of renewable energy market Focus on sustainability and lowering environmental impact Continued growth in energy demand Stakeholder pressure for environmental action Technological progress driving down capital cost Energy dependence and energy security 12th PwC Annual Global Power & Utilities Survey – Cleaner energy perspectives • A major ramping-up of non-hydro renewables by 2030 • 43% is the forecast share of non-fossil fuel in generation by 2030 • Energy Security, energy from clean and sustainable sources, market competition and energy infrastructure are the main issues of the power market • Commitment to a 20:20:20 a m b i t i o n ( E U ) o f 2 0 % emissions reduction, 20% renewable energy and 20% imp roveme nt i n e n e rg y efficiency by 2020 Select indicators of RE development Global new investment in billion renewable energy (annual) USD 130 211 Solar PV cell production (annual) GW 6.9 24 Ethanol production (annual) billion litres 67 86 Biodiesel production (annual) billion litres 12 19 Countries with policy targets # 79 98 Countries with feed-in policies # 71 87 09
  • 12.
    RENEWABLE ENERGY ANDTECHNOLOGIES INDIAN SCENARIO 3.2 10
  • 13.
    RENEWABLE ENERGY –GROWING SHARE IN FUEL MIX Pressure on availability and cost of primary fuels due to growth and climate change actions are the key drivers India installed capacity mix, MW Source: MoP, MNRE RE market is now seeing a slow but definite convergence Renewable sector is dominated by private sector and moving towards IPP scale producers Renewable capacity, MW 70% 0.3% 2% 5% 9% 14% Wind Power Small Hydro Power Biomass Power Bagasse Cogeneration Waste to Power Solar Power (SPV) 4,780 , 2% 131,603 , 66% 38,990 , 20% 24,503 , 12% Thermal Nuclear Hydro RES • India has an installed renewable capacity of 24,500 MW (excluding large hydro) as on March 2012 • Renewable energy is 12% in total capacity and 4% of energy generation. • By 2050 69% of energy generation will be from renewable energy (Greenpeace vision) 11
  • 14.
    INDIA’ S RENEWABLEENERGY OPTIONS India possesses a large, untapped renewable energy potential The resource potential is large even with current assessments Renewable Energy Opportunity, MW 140,000 120,000 100,000 80,000 60,000 40,000 20,000 - Tapped Potential Wind Power Small Hydro Power Biomass Power Bagasse Cogeneration Waste to Power Solar Power Grid Interactive Strengths Challenges Wind Power • • Seasonality- peaks Most established renewable energy source in India • India possesses significant untapped potential • Strong domestic manufacturing base • Regulatory support in monsoon • Higher capital cost per unit of generation- relatively lower returns due to maturity of markets and strong discipline of wind turbine manufacturers Small Hydro Power (up to 25 MW) • Require significantly lower time to commissioning • Fewer environmental or CERC clearances • Viable option for base load for perennial rivers • Regulatory support • Seasonality- for rain-fed rivers, PLFs contract sharply after the monsoon months • Relatively capital intensive and longer construction period compared to other renewable options • Abundance of biomass (agricultural and forestry residues) • Viable option for base load • Relatively short time to commissioning • Regulatory support • Availability of quality feedstock round the year- can be a challenge, particularly for single fuel/ bagasse based plants Bio-Power (Agro residues and plantation) Bagasse based generation Energy from • Large amount of waste Waste generated in India • Foreign technology - requires adaptability • Fuel availability and seasonality poses challenges Solar • Large untapped potential Photovoltaic in India • Expensive technology as compared to other sources Geothermal • Long term solution and ability to manage scheduling • Technology is yet to pick up at commercial scale 12
  • 15.
    POLICIES AND REGULATIONS • Renewable power is expected to constitute a significant part of India’s incremental capacity addition. • A robust regulatory framework has been put in place to realize India’s wind, hydel, solar and biomass potential. Electricity Act 2003 • Mandated State Electricity Regulatory Commissions (SERCs) to • Promote generation of electricity from renewable sources of energy by providing suitable measures for connectivity with the grid and sale of electricity to any person • Fix certain minimum percentages for purchase of renewable power National Electricity Policy 2005 • Further provided for progressive increase in generation of electricity from renewable sources and supported purchases by distribution companies through competitive bidding process Tariff Policy 2006 • Provided for fixation by SERCs of a minimum percentage of Renewable Purchase Obligation (RPO) from RE sources taking into account availability of such resources in the region and its impact on retail tariffs and procurement by distribution companies at preferential tariffs determined by the SERCs National Action Plan on Climate Change 2008 • Outlined existing and future policies and programs addressing climate mitigation and adaptation • NAPCC has advised that starting 2009-10, RPOs be set at 5% of total grid purchase, and be increased by 1% each year for 10 years. 13
  • 16.
    POLICIES AND REGULATIONS– NATIONAL SOLAR MISSION • Conceived under the National Action Plan on Climate Change • Establish India as global leader in solar power by creating favourable policy conditions • Accelerate generation capacity addition to drive down costs and achieve grid parity by 2022 • National Tariff Policy amended (January 2011) for mandatory Solar RPOs for all power utilities Phase 1: 2010-13 Policy framework to attract and scale-up Grid: 1,100 MW Off-grid: 200 MW Market based on FIT mandatory solar RPO Grid competitive solar power and Grid: 4-10,000 MW Grid: 20,000 MW Off-grid: 2,000 MW Phase 3: 2017-22 Off-grid: 1,000 MW Phase 2: 2013-17 A. 20 GW Grid based solar power projects by 2022 • Large power plants (5 MW solar PV; 5 to 100 MW CSP in NSM 1 and 5MW to 50MW solar PV in NSM 2) 100 MW rooftop and small projects • Connected below 33 kV. Target (10 MW of up to 100kW ; and 90 MW of 0.1 to 2 MW. B. 2000 MW off-Grid project by 2022 • Off grid solar and decentralized solar applications. • Capital and interest subsidy; refinance by IREDA, etc. • Other channels to supply & maintain products C. Support projects • Centre of excellence and incubation • Demonstration and pilot projects - 100 MW parabolic trough based - 100-150 MW solar hybrid plant - 50-100 MW CSP with storage - BIPV projects National Solar Mission 14
  • 17.
    SUPPORT MECHANISM FORRENEWABLE POWER IN INDIA Policy Instrument Indian Experience Positives for Developer Accelerated Depreciation (AD) by most states • Financial as well as economic costs and wind industry • The sector has attained scale & • Acknowledged as the key instrument for success of in India • Most wind installations in India have been developed under AD. viability on its own. commercial Generation Based Incentives (GBI) • Recently introduced to shift investment focus from capacity to electricity generation – move from capital subsidies (AD) to generation based incentive. addition • Presents avenues for additional guaranteed revenues for project developers Renewable Purchase Obligation (RPO) • RPOs are mandated by the Electricity Act 2003 and National • RPOs adopted by 23 SERCs Tariff Policy • Readymade market for renewable power sources Clean Energy Cess • The government plans to develop these funds for renewable energy development of Renewable Energy Certificates (RECs) • MNRE and CERC have developed a REC regime which has kicked off recently • Serves as a mechanism to fulfill the RPO obligations thereby reducing penalties • Helps renewable power developers to trade RECs and realise the value of power Carbon Trading projects • Additional cushion for developers • India has largest number of registered and pipeline CDM in the world. • Helped to push the RE industry by making projects more financially attractive to increase their project returns and RoE Tax Incentives - Exemptions on Capital Investments and Generation • Tax exemption instruments such as exemptions or reductions on excise and customs duty have been introduced • Tax Incentives help improving RoE of developer State RE Policies • Examples of state with policies for RE include Karnataka, Punjab, Madhya Pradesh, Gujarat, Himachal Pradesh, Uttarakhand etc • The number of clearances required for renewable projects has come down Feed in Tariffs/ Preferential Tariffs • Being used for all active RE technologies. introduced except J&K, Bihar, Jharkhand, Odisha and the North Eastern states. • Preferred by developers because it enhances project bankability benefits of RE are not yet factored in FIT • Technology upgradation could lead to better returns as it is not considered in FIT 15
  • 18.
    RENEWABLE ENERGY CERTIFICATE • Mass market: not subject to the geographic and physical limitations • One REC to be issued for every MWh of electricity fed to the grid and metered at the bus-bar of generator • REC issued is valid for a period of 1 year • Not related to Carbon Credits, both mechanisms operate independent of each other. • Pricing of REC component: - Sold in the exchange within a range of floor price and ceiling price as fixed by CERC from time to time • A renewable generating entity that has: Not entered into any PPA at a preferential tariff - Sells its power to a local distribution licensee at a cost at or below the Average Power Purchase Cost (excl. RE power cost) - Sells power either to the third party or through Power Exchanges Overview Eligibility REC: Operational Framework Accreditation of RE power plants (State nodal agency: SNA) Registration of Eligible entities (Central level agency) Information related to accredited RE plants for registered entities sent to REC registry Issuance of REC RE Generator Central REC Sale of electricity at par with conventional power Discom issuing RE injection certificate Information related to RE generation State Load Despatch Centre (SLDC) Registry (NLDC) REC exchange Auditing Panel SERC: Compliance based on SNA Report 2 3 5 6 4 Electricity Energy accounting Information on REC purchase/redemption State Nodal Agency (SNA) 1 16
  • 19.
    RENEWABLE PURCHASE OBLIGATIONS • The Government has set a target of 10% energy generation from renewable sources* by 2012 • In 2007, the Government released draft versions of a new policy which seeks to increase the target to 20% by 2020 • Several State Regulators (“SERC”) have translated this national target into Renewable Purchase Obligations (RPO) • RPOs mandate the minimum quantum of electricity which distribution utilities in the States have to source from renewable sources (failing which, a penalty may be imposed on them) • On a pan-Indian basis, the total RPO commitment by the 12 States that have implemented it constitutes ~5.33% of the total power consumption in 2007-08 • The RPO system passes on the onus of increasing renewable energy consumption to the State DISCOMS – effectively the cost of acquiring this renewable electricity is passed onto the consumer through higher power tariffs RPO Targets* (2012) STATE RPO (% OF UNITS SOLD) Andhra Pradesh 5% Gujarat 6% Haryana 1.5% Karnataka 7% &10% Kerala 3.3% Madhya Pradesh 10% Maharashtra 7% Odisha 5% Rajasthan 6% Himachal Pradesh 11.1% Tamil Nadu 14% Uttar Pradesh 5% West Bengal 3.8% Uttarakhand 4.525% Chhattisgarh 5.25% * Excludes large hydro projects and nuclear power 17
  • 20.
    CLEAN ENERGY SECTORIN INDIA-WAY FORWARD Interplay of favorable risk-return profile at project level coupled with the emerging Indian merchant power opportunity creates a positive strategic framework for Indian renewable IPP players Project Level • Shorter time-to-commissioning than conventional power projects • Fast-track project approval- significantly fewer environmental or CERC clearances required compared to conventional power projects • Easier to achieve financial closure vis-à-vis larger projects, Greater predictability of project execution • Plethora of small-to-mid size units in “locally constrained” entrepreneurial setups: ideal for consolidation play • Bidding route not mandatory for new capacities Financial Perspectives • Low working capital requirements, particularly for small hydro and wind projects • Ability to boost returns through emissions trading options • Regulatory support, including preferential tariffs • Fiscal incentives (subsidies, grants and tax incentives) available in some States Sustainability • Lower fuel sourcing and pricing risk compared to conventional power projects • Opportunity to de-risk asset portfolio through geographic and technological options- exposure to multiple markets, regulatory regimes, technologies and climatic conditions • Lower social friction concerns by promoting ‘inclusive growth’ • Broadening fuel base complements efforts to decouple India’s economic growth from emissions growth and helps to achieve energy security Fund requirement • Consolidated fund requirement estimated by MNRE (Strategic plan for new and renewable energy sector for the period 2011 -17 is • For grid connected renewable energy technologies – USD 2.6 billion • For off grid renewable energy programs – USD 2.7 billion 18
  • 21.
    RENEWABLE ENERGY ANDTECHNOLOGIES GUJARAT SCENARIO 3.319
  • 22.
    GUJARAT – RENEWABLEENERGY POWERHOUSE Gujarat’s power sector – strong performer 20.1 79.8 100.1 30.6 67.0 97.5 40.0 80.0 120.0 Collection Efficiency (%) PLF (%) T&D loss (%) 2004-05 2010-11 Break up of installed power capacities in Gujarat, May 2012 Thermal 78% Nuclear 3% Hydro 3% Renewabl 16% es Break up of installed capacity from RE source in Gujarat, May 2012 Wind 81% SHP 0.2% BIO 1% Solar 18% • Share of renewable energy in total energy mix in Gujarat is 16% • Gujarat’s share of energy from renewable energy sources in Western Region Gujarat was power deficient is 44% and all India share is 14% barely a decade ago, but now has a surplus power and a vibrant energy sector Source: EPD The state of Gujarat is blessed with abundant renewable energy potential Source Total Total RE installed Potential potential Capacity, % of (India), MW (Gujarat), MW total potential in Gujarat Wind 45,000 10,000 25.8% Solar > 100,000 69,000 0.9% Biomass 17,000 1,900 1.6% Timely tariff revisions have made the sector viable enabling the state to set up adequate generation capacity Uninterrupted power supply attracts companies to set up business in Gujarat 20
  • 23.
    WIND POWER INGUJARAT Over the last 25 years more than 65 sites have been monitored for wind speed and wind power density, and over 50 sites have been found feasible for harnessing wind power The State of Gujarat with its longest coast line in the country and inland windy sites has a potential of over 10,000 MW of wind power. Wind Power Density in Gujarat, W/m2 The Centre for Wind Energy Technology, an autonomous R&D institution under MNRE, Source: TERI, GEDA has identified and approved 40 sites for wind energy deployment with annual average wind power density greater than 200 W/sq. m. at a 50 m height in Gujarat. 21
  • 24.
    WIND POWER INGUJARAT The state, having embarked upon an ambition plan to tap the large wind power potential, achieved commendable results: total installed capacity of wind power grew from 271 MW in 2005-06 to 2,885 MW in 2011-12 at CAGR of 48% Cumulative wind capacity in Gujarat, MW 271 3500 3000 2500 2000 1500 1000 500 Wheeling: At 66 kV: Normal charges as applicable to open access Source: GEDA, GERC 2,885 0 Up to 2005-06 CAGR 48% 2006-07 2007-08 2008-09 2009-10 2010-11 2011-12 In November 2008 Gujarat won the Best Wind Power Developer State (Percentage Increase) Award 2008 for achieving the maximum capacity additions during the two consequent year FY07 and FY 08 alone the coast of Saurashtra Wind Power Policy and GERC regulatory features Eligible Unit: Any company/corporate body/association/body of individuals Sale: Fixed tariff Tariff: Rs. 3.56 / kWh for 25 years Open Access / 3rd party sale: Allowed Below 66 kV: Normal charges as applicable to open access + 10% of generated fed to the grid Land: Revenue waste land @ 1 hectare per Wind turbine generator on long term lease of 20 years to the developer at a lease rent of Rs. 10,000/ha/year 22
  • 25.
    SOLAR POWER INGUJARAT Gujarat has one of the highest solar generation potential in India (solar radiation – 5.6-6.0 kWh/m2/day for 300 days The area with the highest solar potential is the district of Kachchh with the highest direct solar insolation 6.4 kWh/sq. m. / day throughout the year and 310 sunny days. It covers a total area of 45,652 sq km and located on the Tropic of Cancer 23.26 N. The sites do not require sun tracing. Districts with the highest GH/DN Irradiance, kWh/m2/year Source: TERI, GEDA 23 GHI DNI Jamnagar 2,216 2,697 Junagadh 2,212 2,661 Navsari 2,110 2,427 Patan 1,883 2,008
  • 26.
    SOLAR POWER INGUJARAT Asia’s first 500 MW Solar Power Park at Charanka, district Patan Source: TERI, GEDA Gujarat has taken the lead over other states in renewable energy initiatives, particularly in solar power generation. It is the first state in India to achieve RPO target 654.81 MW of solar power capacities commissioned by 64 developers in the state of Gujarat Solar Power Policy 1st state policy in the country Phase Developers Capacity, (Nos.) MW Phase I allotment 57 406.5 Phase II allotment 27 562.0 Total 84 968.5 Gujarat’s largest solar power plants, as on May 2012 District MW Adani Enterprises Ltd. Kachchh 40 Sanland Real Estate Pvt. Ltd. Banaskantha 25 Tata Power Company Ltd. Jamnagar 25 Alex Astral Power Pvt. Ltd. Patan 25 Roha Dyechem Pvt. Ltd. Patan 25 Sun Edison Energy India Pvt. Ltd. Patan 25 Kiran Energy Solar Power Pvt. Ltd. Patan 20 PLG Photovoltaic Patan 20 Hiraco Renewable Energy Pvt. Ltd. Porbandar 20 • 76% of developers who signed PPAs under the policy have commissioned their projects • 68% of allocated capacities have been commissioned. They help • generating ~1,048 million kWh of electricity annually • avoiding 0.72 million tonnes of coal annually • reducing carbon emissions of 1.04 million tonnes annually 24
  • 27.
    SOLAR POWER INGUJARAT Source: GETCO, GPCL Geographical locations of solar power projects 25
  • 28.
    SOLAR POWER INGUJARAT Summary of solar Tariffs, Rs./kWh (projects commissioned Jan 29, 2012 - March 31, 2015) Period Jan 29, 2012 – Apr 1, 2013 – Apr 1, 2014 – Mar 31, 2012 Mar 31, 2014 Mar 31, 2015 Megawatt-scale PV projects availing accelerated depreciation Levelized tariff for 25 years 9.28 8.63 8.03 First 12 years 9.98 9.13 8.35 Subsequent 13 years 7.00 7.00 7.00 Megawatt-scale PV projects not availing accelerated depreciation Levelized tariff for 25 years 10.37 9.64 8.97 First 12 years 11.25 10.30 9.42 Subsequent 13 years 7.50 7.50 7.50 Kilowatt-scale PV projects availing accelerated depreciation Levelized tariff for 25 years 11.14 10.36 9.63 Kilowatt-scale PV projects availing accelerated depreciation Levelized tariff for 25 years 12.44 11.57 10.76 Levelized Tariff for Solar Thermal Projects With accelerated depreciation benefit 11.55 per kWh for 25 years Without accelerated depreciation benefit 12.91 per kWh for 25 years Source: GERC Order No. 1 of 2012: Determination of tariff for Procurement by the Distribution Licensees and others from Solar Energy Projects; 27 Jan. 2012 26
  • 29.
    BIOENERGY IN GUJARAT Biomass potential in Gujarat Crop Residue Forest Residue Districts with the highest biomass potential, MW Crop Rajkot 228 Jamnagar 203 Bhavnagar 192 Junagadh 168 Surendranagar 142 Amreli 137 Source: TERI, GEDA Forest Junagadh 18 The dangs 18 Sabarkantha 16 Valsad 15 Dahod 12 Banaskantha 11 The total biomass potential for Gujarat is about 1,800 MW from crop residue and about 140 MW from forest residue Bioenergy power generation 31.20 MW capacity biomass projects commissioned in Amreli, Junagadh and Vadodara 13.23 MW waste-to-energy power generation projects Bioenergy programmes Institutional biogas plants 9835 m3/day capacity in various institutions across the state 27
  • 30.
    BIOENERGY IN GUJARAT Tariff for Biomass based power projects to be commissioned in the state of Gujarat during the control period (June 2010 – March 2013), Rs/kWh Tariff Initial 10 years 11th year onwards With accelerated depreciation 4.40 4.75 Without accelerated depreciation 4.45 4.80 Tariff for Bagasse based co-generation projects to be commissioned in the state of Gujarat during the control period (June 2010 – May 2013), Rs/kWh Tariff Initial 10 years 11th year onwards With accelerated depreciation 4.55 4.90 Without accelerated depreciation 4.61 4.96 Source: GERC Order No. 5 of 2010: Determination of tariff for Procurement of Power by Distribution Licensees from Biomass based Power Generator and Other Commercial Issues, 17 May 2010 GERC Order No. 4 of 2010:Determination of tariff for Procurement of Power by Distribution Licensees from Bagasse based co-generation Power Plants and Other Commercial Issues, 31 May 2010 28
  • 31.
    NEW ENERGY INGUJARAT Source: TERI, GEDA The state endeavors to become the leader in terms of capacity and introduction of new technologies in other renewable energy sources, like wind-solar hybrid, WTE, OTEC, tidal energy, etc. The total potential for wind solar hybrid installations is about 74,000 MW with the largest potential in Rajkot and Kachchh Gujarat has the 1,600 km coast line and good wind velocity offshore. The total offshore wind potential is about 4,000 MW Districts with the highest hybrid potential, MW Wind solar hybrid installation, MW Rajkot 23,182 Kachchh 16,151 Jamnagar 8,707 Surendranagar 6,625 Amreli 3,585 Bhavnagar 2,514 Sabarkantha 2,303 Banaskantha 2,044 Junagadh 2,038 29
  • 32.
    NEW ENERGY INGUJARAT Gujarat geothermal potential is concentrated in Khambhat 25 MW capacity of geothermal energy is currently utilized for direct heat in Gujarat (Khambhat) Geothermal power pilot projects are being planned in the state Source: TERI, GEDA, World Geothermal Congress 2010 Tidal Potential in Gujarat, MW The following two sites were identified as potential sites for setting up tidal wave based power project in the State: • Gulf of Khambhat • Gulf of Kachchh Potential site Tidal energy potential, MW Gulf of Kachchh 503 Gulf of Khambhat 6,303 Total 6,806 30
  • 33.
    RENEWABLE ENERGY ANDTECHNOLOGIES SUCCESS STORIES IN GUJARAT Source: TERI, GEDA 3.431
  • 34.
    MODEL SOLAR CITYPROJECT - GANDHINAGAR Source: MNRE, GEDA Government of India declared Gandhinagar as a Model Solar City setting example for Solar Cities throughout India and other nations Ministry of New and Renewable Energy (MNRE) has launched a program on “Development of Solar Cities” on January 24, 2011 The program assists Urban Local Governments in: • Preparation of a master plan for increasing energy efficiency and renewable energy supply in the city • Setting-up institutional arrangements for the implementation of the master plan. • Awareness generation and capacity building activities. The program aims at minimum 10% reduction in projected demand of conventional energy at the end of five years, which can be achieved through a combination of energy efficiency measures and enhancing supply from renewable energy sources Rajkot and Surat have received in-principle approval under this programme Gandhinagar: The Model Solar City project 10 KW capacity wind-solar hybrid system commissioned at Udyog Bhavan, Gandhinagar 19 solar rooftop systems of 10 KW each commissioned at government buildings in Sachivalaya, Gandhinagar 1,240 KW SPV-based grid-connected power generating rooftop systems at government buildings 240 solar rooftop systems of 1 KW each commissioned at godowns 6 solar hybrid systems of 5 KW each commissioned on government buildings 32
  • 35.
    5 MW GANDHINAGARSOLAR ROOFTOP PROGRAMME Government of Gujarat has launched the ambitious “Gandhinagar (Solar) Photovoltaic Rooftop Programme” to encourage alternative clean energy sources like solar energy as well as social participation to advance towards energy self-sustainability To be implemented in • Surat • Rajkot • Mehsana • Bhavnagar • Vadodara Opportunity for rooftop owners • This Programme provides an opportunity to property owners in Gandhinagar City for participation by offering their rooftop or terrace for installation of Solar Photovoltaic System (SPV) for solar power • The owner of property will be paid a “Green Incentive,” which shall be based on the units (kWh) of electricity generated by the SPV system installed on the property Role of project developer • In this programme the developer is selected through a transparent competitive bidding process. The selected developer will finance/Install/Own/Operate and maintain PV roof systems on owners roof tops • The energy generated from this system will be sold to Distribution Company and Distribution Company will pay duly approved tariff to developers • Selected developers will execute the “Green Incentive and Lease Agreement” with individual property owners, whose rooftop or terrace will be utilized for the SPV system Source: GPCL 33
  • 36.
    SOLAR PARK –FLAGSHIP PROJECT OF GUJARAT Solar Park Concept Concentrated zone of development for solar power related activities • Solar thermal/PV generation based projects • Solar components manufacturing/ assembling • Research and development • Capacity Building Single window facility for solar power project d e v e l o p e r s f o r p r o v i d i n g c o m m o n infrastructure facilities like • Land facilities • Water and drainage facilities • Water treatment plant • Electrical network with 66 kV substation for auxiliary power • 400x220x66 kV substation – Power evacuation system • Excellent Road (approach and internal roads) • Green belt • Helipad • Fully developed office space • Residential accommodation and medical assistance Ensure implementation of the policies of government of Gujarat for development of the solar power sector Source: GEDA, GPCL Key Features Area: approx. 2,000 Ha Capacity Installed: 231 MW No. of developers: 21 Solar Park Framework Gujarat Solar Park, Charanka, Patan district GEDA Financial Institutes GPCL Nodal Agency for Solar Park development GETCO SSNNL GERC/CERC Government agencies Transmission infrastructure Water availability Tariff determination Tariff determination Shared with solar developer, manufacture, R&D setup Processed applications Policy directives Project funding Infrastructure development charge 34
  • 37.
    GUJARAT SOLAR PARK– CII’S MOST INNOVATIVE ENVIRONMENT PROJECT AWARD The only project in Power sector of India that has won this prestigious award Award merits: • Given a discrete definition of “solar park” in the Indian context • World’s largest multi-developer and multi-beneficiary solar park with targeted 500 MW Solar Power Projects at single location Social Commitment • All-weather road connectivity • Water to carry out cultivation activities • Drinking water facility to Charanka village • Ambulance service • State-of-the-art training facility to provide training to the villages in various fields Source: GPCL, GEDA 35
  • 38.
    INDIA’S FIRST CANAL-TOPSOLAR POWER PROJECT Gujarat has initiated the world’s first canal-based solar power project on Narmada branch canal new Chandrasan village of Mehsana district Technical details Innovative ideas • Projected energy production: 1.5 million units/year/MW • Irradiation: 4.6 – 6.4 kWh/m2 • Installed capacity: 1 MWp • Technology: polycrystalline solar modules, 280 Wp • Number of modules: 3616 • Canal length used: 750 m • Power evacuation system: 11 KV Source: GSECL 1 MW CANAL BASED SOLAR POWER PLANT Energy generated from this pilot project will be directly fed into the local electricity grid and utilized by nearby towns and villages Cover the canal with Solar Panels to • Save Land @ 5 acre per MW • Minimize evaporation from canal (9 million liters water saving per MW per year) • Produce eco-friendly power • Shadowing effect of panel results in reduced photosynthesis and less algae growth leading to less maintenance cost 36
  • 39.
    BIOENERGY Source: GEDA 0.95 MW biogas based power project at Sayaji Industries, Kathwada, 2009-10 Sayaji Industries, Kathwada is dealing with maize starch products. As a result of maize corn milling, grinding and processing, about 14000 nm3 biogas is generated. Earlier biogas was being used in the coal fired boilers. Under the MNRE programme of energy recovery from industrial & commercial wastes, the biogas based power project was taken up. The project commissioned in April 2009 and has been running successfully at about 80% PLF since commissioning 12000 nm3 biogas per day (1 MWeq.) maize starch industry liquid waste based biomethanation plant by Gujarat Ambuja Exports Ltd., at Dalpur , Dist: Sabarkantha 2009-10 12000nm3 /day capacity biomethanation plant is completed & commissioned in December 2009 under MNRE waste-to-energy (WTE) scheme. Plant has been running successfully since its commissioning date. Produced biogas gas is used in 100% biogas engines in CPP. 0.833 MWeq.(10000 nm3/day) capacity maize starch industry liquid waste based biomethanation plant at Sayaji Industries Ltd., Kathwada, 2010-11 Sayaji Industries, Kathwada increased its maize grinding capacity from 325 MT/day to 550 MT/day, the effluent also increased with higher COD value of about 16000 to 20000 KGs COD. One 10000 nm3/day capacity biomethanation plant has been installed & commissioned December 2011.The same is working with more than 80% efficiency. The produced biogas is used in its CPP. Industrial Waste based 4800 nm3/day capacity biomethanation project at Anil Starch Products Ltd., Ahmedabad, 2000-01 An up flow anaerobic sludge blanket technology reactor (UASB) having total bio-gas generation capacity of 4800 nm3/day has been installed at M/s Anil Starch Products Ltd. under waste-to-energy project related interest subsidy scheme of MNRE for WTE projects during financial year 2000-2001 2.0 MW capacity Bio-gas based Power Generation Project, Ankleshwar, 1997-98 This project was commissioned during FY98 under MNRE capital investment subsidy scheme on WTE projects by Kanoria Chemicals Industries Ltd. 37
  • 40.
    GUJARAT – PREFERREDDESTINATION FOR INVESTMENTS IN RENEWABLES Renewable Energy Sector received a major boost at Vibrant Gujarat Summit in 2009 and 2011 Special Investment Packages announced for Solar and Wind Power Generation 2011 Sector MoU signed Capacity Amount Source: GEDA, iNDEXTb Employment (Nos) (MW) (USD billion) Generation Potential (Nos) Solar Equipment Manufacturing 36 2,440 4.5 27,500 Wind Power Generation 28 5,071 6.7 10,142 Tidal Power Generation 1 250 1.1 2,440 Electromagnetism 1 TOTAL 66 7,761 12.3 40,082 2009 • Highest number of MoUs signed in the renewable energy sector (32% of total number of MoUs) • Total capital investment of USD 22 billion • 70 MoUs signed for solar and wind power projects for 10,321 MWe. • Expected employment generation is 45,000 over the next five years 38
  • 41.
    LARGE RENEWABLE ENERGYPLAYERS IN GUJARAT Solar power developers Solar PV manufacturers Wind power developers Wind equipment manufacturers JJ PV Solar Pvt. Limited Ritika Systems Private Limited Sunrise Technology Sonki Solar India Topsun Energy Limited Vimal Electronics TATA BP Solar India Ltd. Star Energy Systems Jain Energy Waaree GreenBrilliance Energy Pvt. Ltd. Euro Solar Power Pvt. Ltd. 39
  • 42.
    RENEWABLE ENERGY ANDTECHNOLOGIES SCENARIO IN GUJARAT BY 2020 AND INVESTMENT OPPORTUNITIES SSoouurrccee:: TGEERDI,A G, EiNDDAEXTb 3.5 40
  • 43.
    RENEWABLE ENERGY INGUJARAT BY 2020 NAPCC* goal: 1% annual increase of RE power to the national grid, from 5% in 2009-10 to 15% of the energy mix by 2020 Expected capacity addition in RE sector by 2017 will be 4,297 MW with highest contribution from wind – 50% and solar – 44% Total installed capacity from RE ources by 2017 – 7,863 MW Installed 12th five year Plan period Capacity Source / Technology capacity (MW) additions as on May 2012 FY13 FY14 FY15 FY16 FY17 12th Plan Wind 2,885 326 377 456 498 508 2,165 SHP 6 2 3 4 3 3 15 BIO 20 35 45 55 60 44 239 Solar 655 209 331 331 441 560 1,872 WTE 0 2 2 0 2 6 Total 3,566 572 758 848 1,002 1,117 4,297 Source: Energy and Petrochemicals Department * National Action Plan on Climate Change 41
  • 44.
    INVESTMENT OPPORTUNITIES Fundrequirement Non- Conventional power projects under private sector Project Fund required (USD billion) Wind 2.65 SHP 0.02 Bio Mass 0.24 Solar 3.82 WTE 0.01 Total 6.74 Development of distributed gas based power combined Source: Energy and Petrochemicals Department, Government of Gujarat with non conventional sources Tidal and geothermal projects first at a pilot scale, and then at a commercial scales Development of wind-solar hybrid installations and biomass projects Development of large scale solar parks and canal-top solar projects Offshore wind projects development Development of solar manufacturing capacities Development of projects under solar rooftop programme (Bhavnagar, Surat, Rajkot, Mehsana) 42
  • 45.
  • 46.
    GUJARAT – THESTATE WITH STRATEGIC LOCATION 44
  • 47.
    GUJARAT – INDIA’SECONOMIC POWERHOUSE 45
  • 48.
    GUJARAT – ROBUSTINFRASTRUCTURE 46
  • 49.
    GUJARAT – STRONGURBAN, SOCIAL AND EDUCATIONAL INFRASTRUCTURE 47
  • 50.
    GUJARAT – LANDOF INNOVATIVE HUMAN CAPITAL 48
  • 51.
    GUJARAT – NEWPARADIGM FOR INDUSTRIAL GROWTH The current phase – involving Integrated development of large areas like SIRs, PCPIR and DMIC – is poised to transform the industrial scenario in the state Phase of industrial development Level of Integration 202 Industrial Estates 83 product clusters SEZs • Multi product • Chemical • Textile • Pharma • IT / ITeS • Electronics • Engineering • Biotech • Gems & Jewellery Integrated large area developments • Special Investment Regions (>100 sq. km.) and Industrial Areas (50-100 sq. km.) • Delhi Mumbai Industrial Corridor • GIDC Industrial Estates • Petroleum, Chemicals and Petrochemicals Investment Region • Knowledge corridor • Logistics parks • Theme towns Phase I Phase II Phase III Phase IV 49
  • 52.
    GUJARAT - PROACTIVEGOVERNANCE Source: Socio-Economic Review Gujarat, 2011-12, Department of Economic affairs, March 2009 50
  • 53.
  • 54.
    DOING BUSINESS INGUJARAT 5 Source: TERI, GEDA 52
  • 55.
    OVERALL FRAMEWORK FORDOING BUSINESS 53
  • 56.
  • 57.
  • 58.
    FRAMEWORK FOR SETTINGUP INDUSTRY IN GUJARAT 56
  • 59.
    KEY GOVERNMENT AGENCIES Source: TERI, GEDA 6 57
  • 60.
  • 61.
    KEY CONTACT PERSONS Mr. Maheshwar Sahu, IAS Principal Secretary (Industries & Mines) Industries & Mines Department Phone: +91 79 23250703 secimd@gujarat.gov.in www.imd-gujarat.gov.in Mr. D.J. Pandian, IAS Principal Secretary (Energy & Petrochemicals) Energy & Petrochemicals Department Phone: +91 79 23250771 secepd@gujarat.gov.in www. guj-epd.gov.in Mr. B.B. Swain, IAS Vice Chairman & Managing Director Gujarat Industrial Development Corporation Phone: +91 79 23250583, Fax: +91 79 23250587 vcmd@gidcgujarat.org www.gidc.gov.in Mr. Kamal Dayani, IAS Industries Commissioner Industries Commissionerate Phone: +91 79 23252683, Fax : 91(79)232 52683 comind@gujarat.gov.in www.ic.gujarat.gov.in Mr. Mukesh Kumar, IAS Managing Director Industrial Extension Bureau Phone: +91 79 232 50492, Fax: +91 79 232 50490 indextb@indextb.com www.indextb.com Mr. A.K. Sharma, IAS Chief Executive Officer Gujarat Infrastructure Development Board Phone: +91 79 23232701, Fax: +91 79 23222481 ceo@gidb.org www.gidb.org Dr. K.U. Mistry Chairman Gujarat Pollution Control Board Phone: +91 79 23232152, Fax: +91 79 23232156 chairman-gpcb@gujarat.gov.in www.gpcb.gov.in Mr. D.P. Joshi Director Gujarat Energy Development Agency Phone: +91 79 23257251 director@geda.org.in www. http://geda.gujarat.gov.in 59
  • 62.
    National Partner KnowledgePartner Exhibition Partner Relationship Partner Airline Partners nd Head Office: Block No. 18, 2 Floor, Udyog Bhavan, GH-4, Sector 11, Gandhinagar 382 010 Gujarat, INDIA Phone: +91-79-23250492/93 Fax: +91-79-23250490 www.indextb.com, www.ic.gujarat.gov.in E-mail: indextb@indextb.com Regional Office: A-6, State Emporia Building, Baba Kharak Singh Marg, New Delhi 110 001, INDIA Telefax: 011-23747002, 23360049 E-mail: indextbnd@indextb.com For more details and online registration, log on to www.vibrantgujarat.com