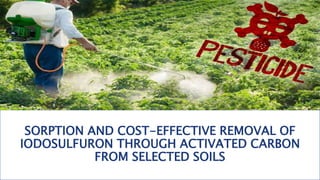
1. The study investigated the adsorption and removal of the herbicide Iodosulfuron from soils using activated carbon.
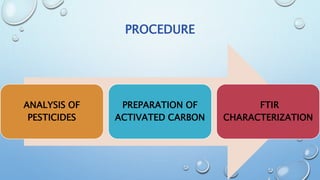
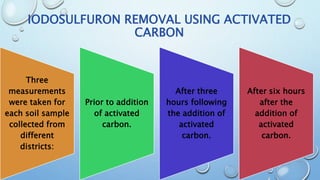
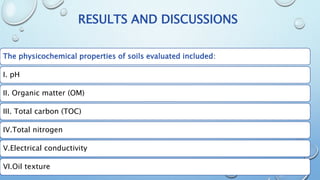
2. Soil samples were collected from different regions of Pakistan and tested for properties like pH, organic matter. Batch experiments examined the adsorption capacity of activated carbon for removing Iodosulfuron from soils.
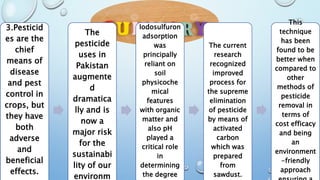
3. Results found the adsorption and removal of Iodosulfuron depended on soil physicochemical properties like organic matter and pH. Soils with higher organic matter and lower pH showed greater adsorption. Activated carbon prepared from sawdust proved effective for removing the pesticide from soils in a cost-effective and environmentally-friendly way.


![PESTICIDES WASTE present [Autosaved].pptx](https://cdn.slidesharecdn.com/ss_thumbnails/pesticideswastepresentautosaved-230619151657-c215b694-thumbnail.jpg?width=640&height=640&fit=bounds)


