Download to read offline

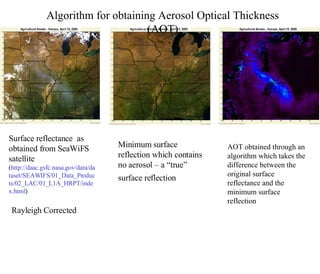
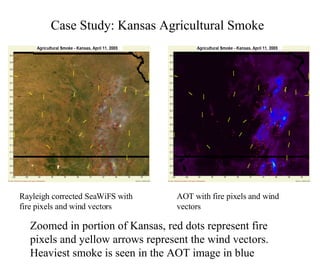
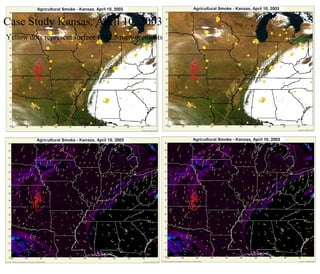
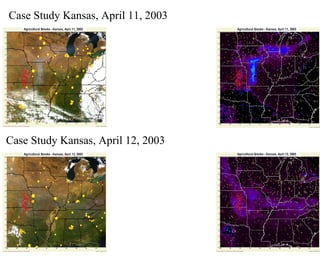
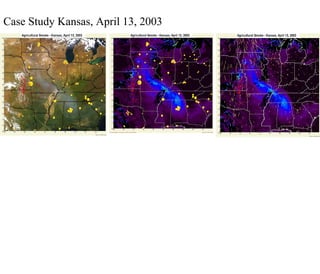
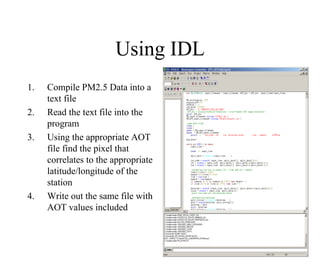
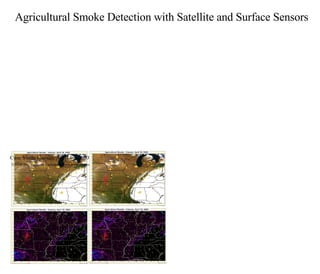
This document discusses using satellite and surface sensors to detect agricultural smoke. It describes using SeaWiFS satellite data to obtain surface reflectance and aerosol optical thickness (AOT) through an algorithm. A case study of agricultural fires in Kansas in April 2003 is presented, with images showing smoke patterns from Rayleigh corrected satellite data and AOT, along with surface PM2.5 measurements and wind vectors. The study correlates PM2.5 data with AOT values from satellite images at matching latitudes and longitudes.