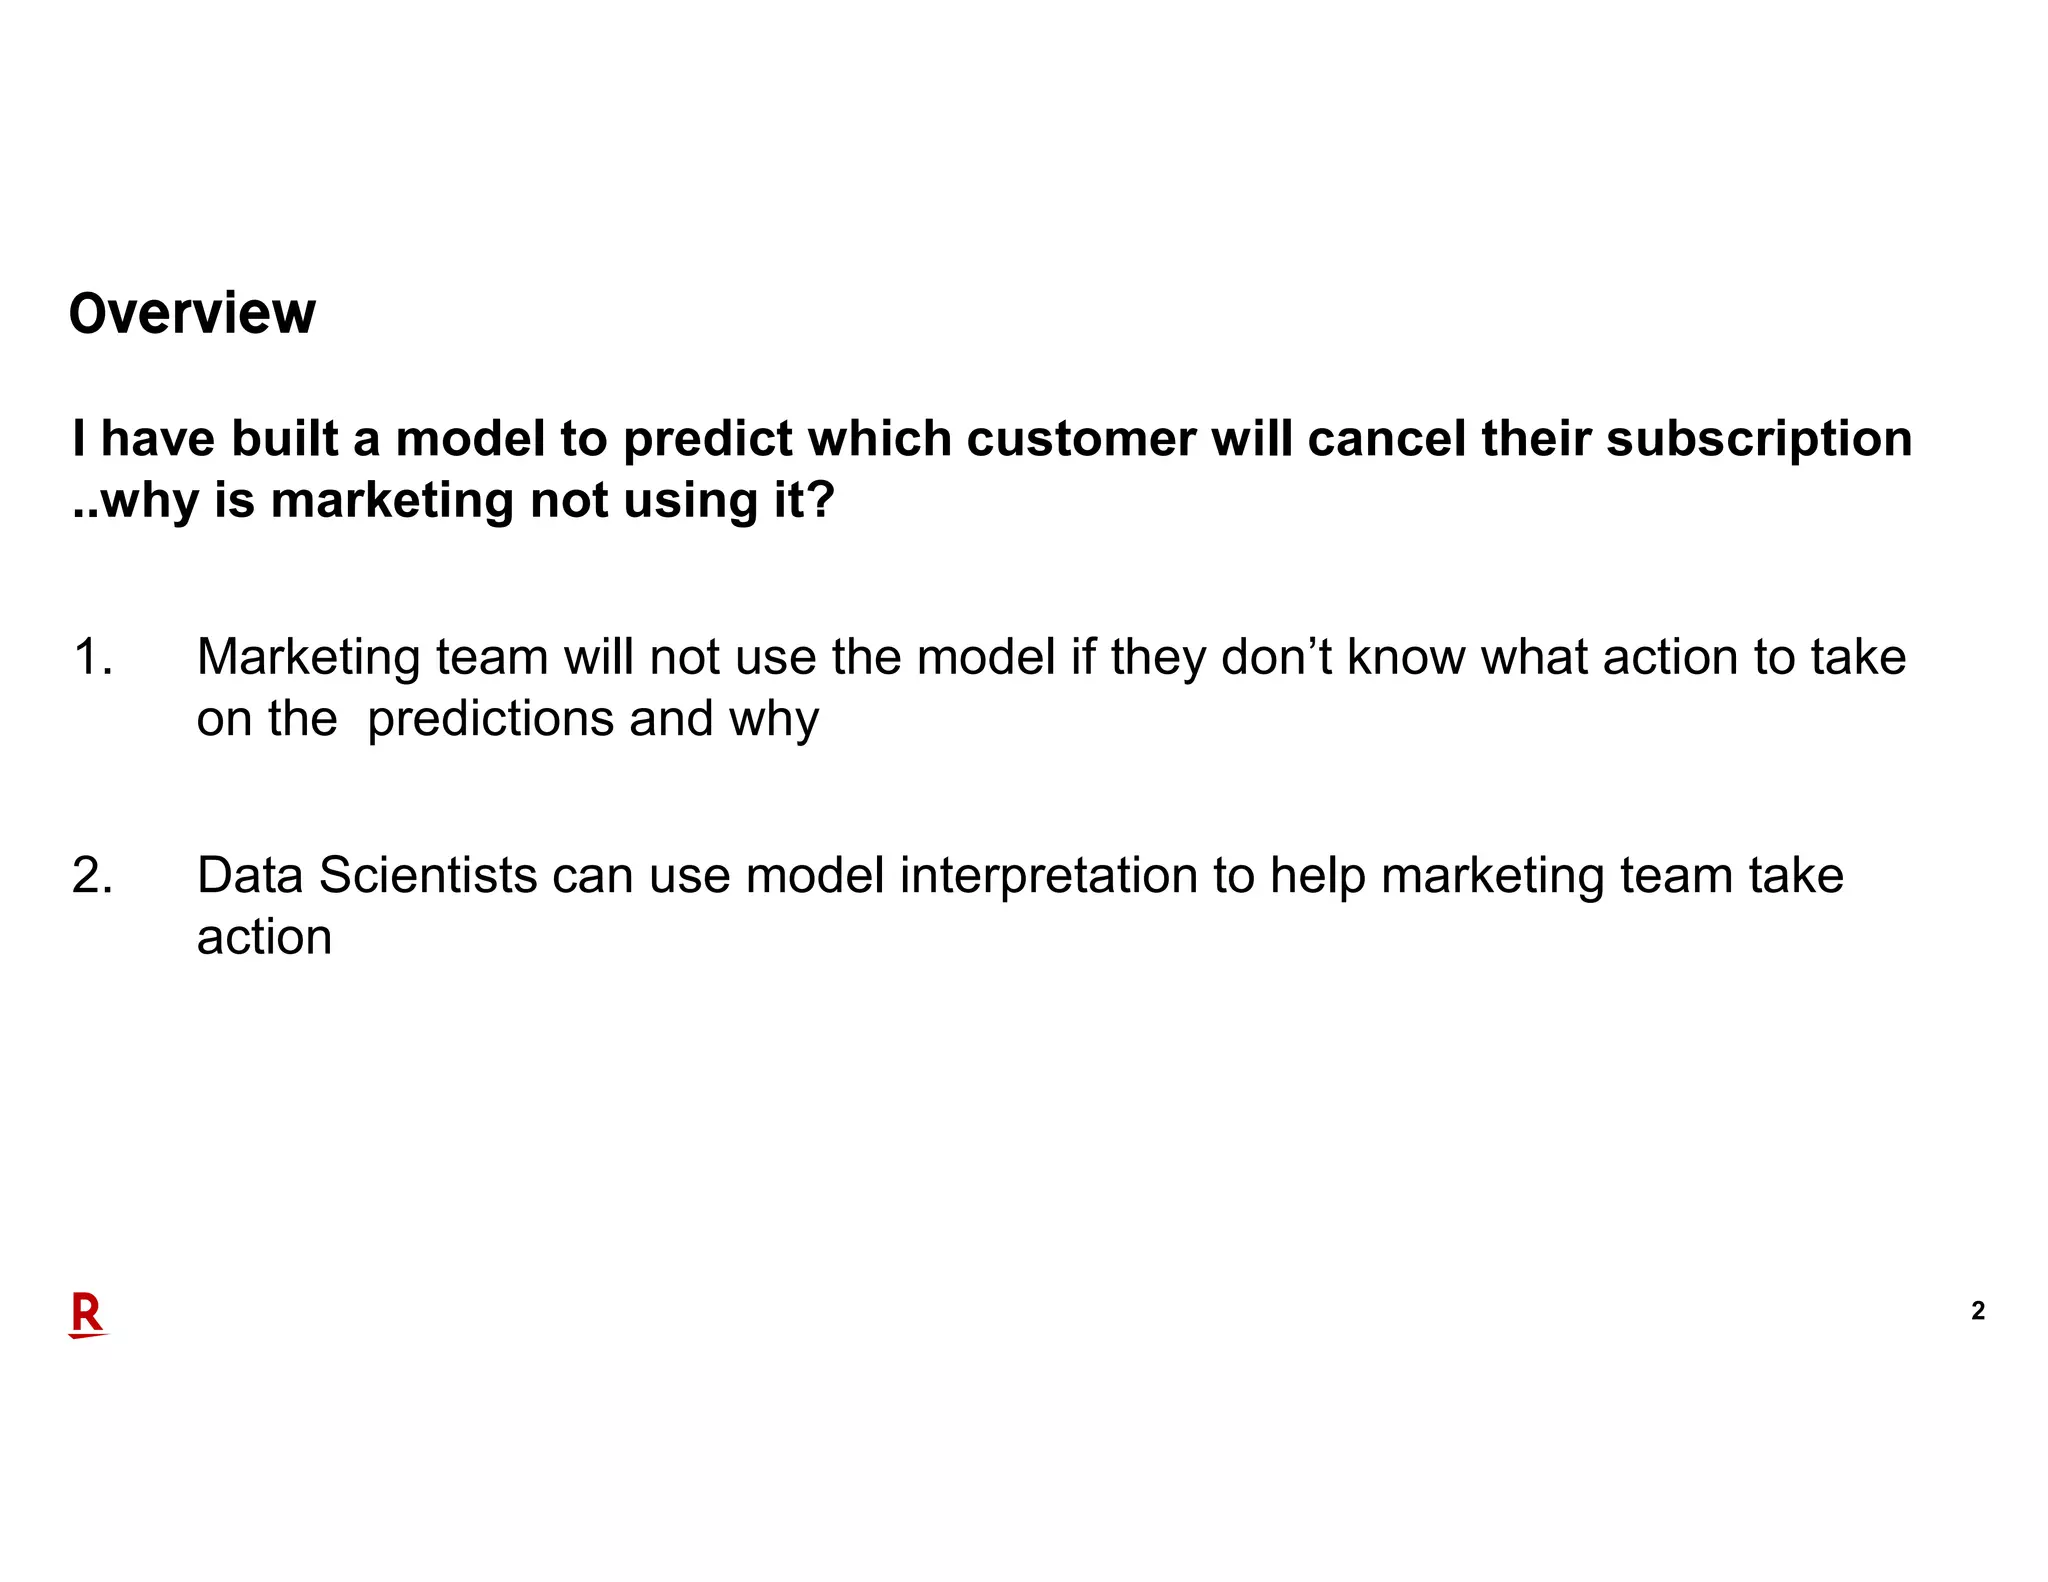
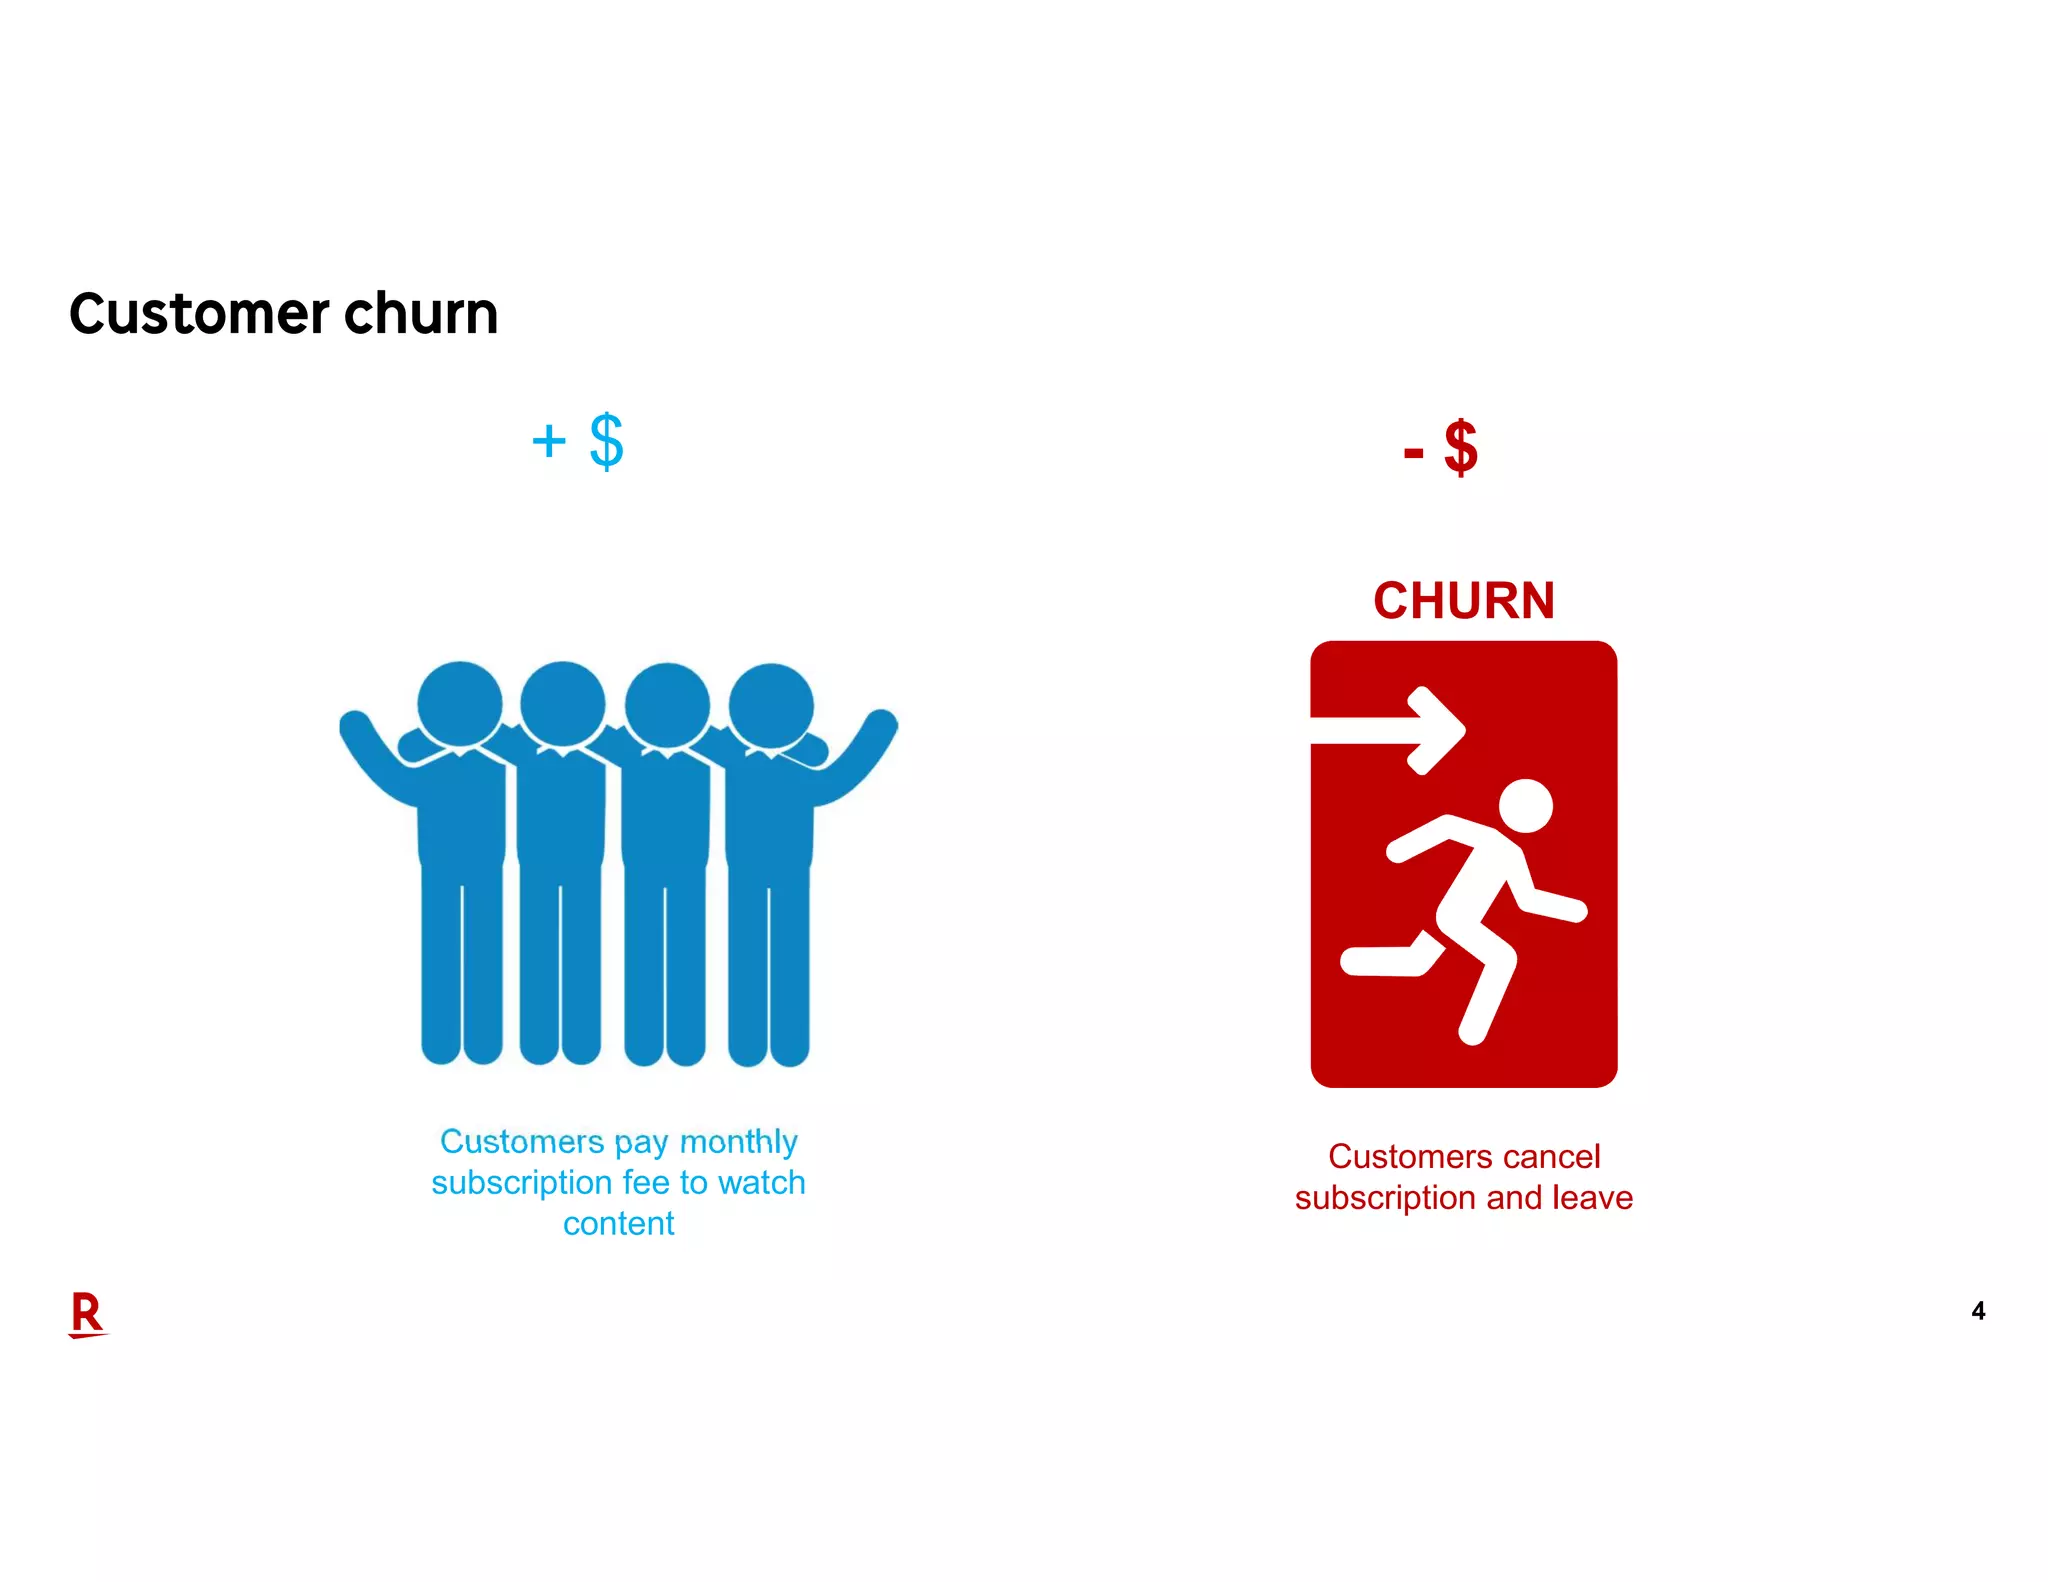
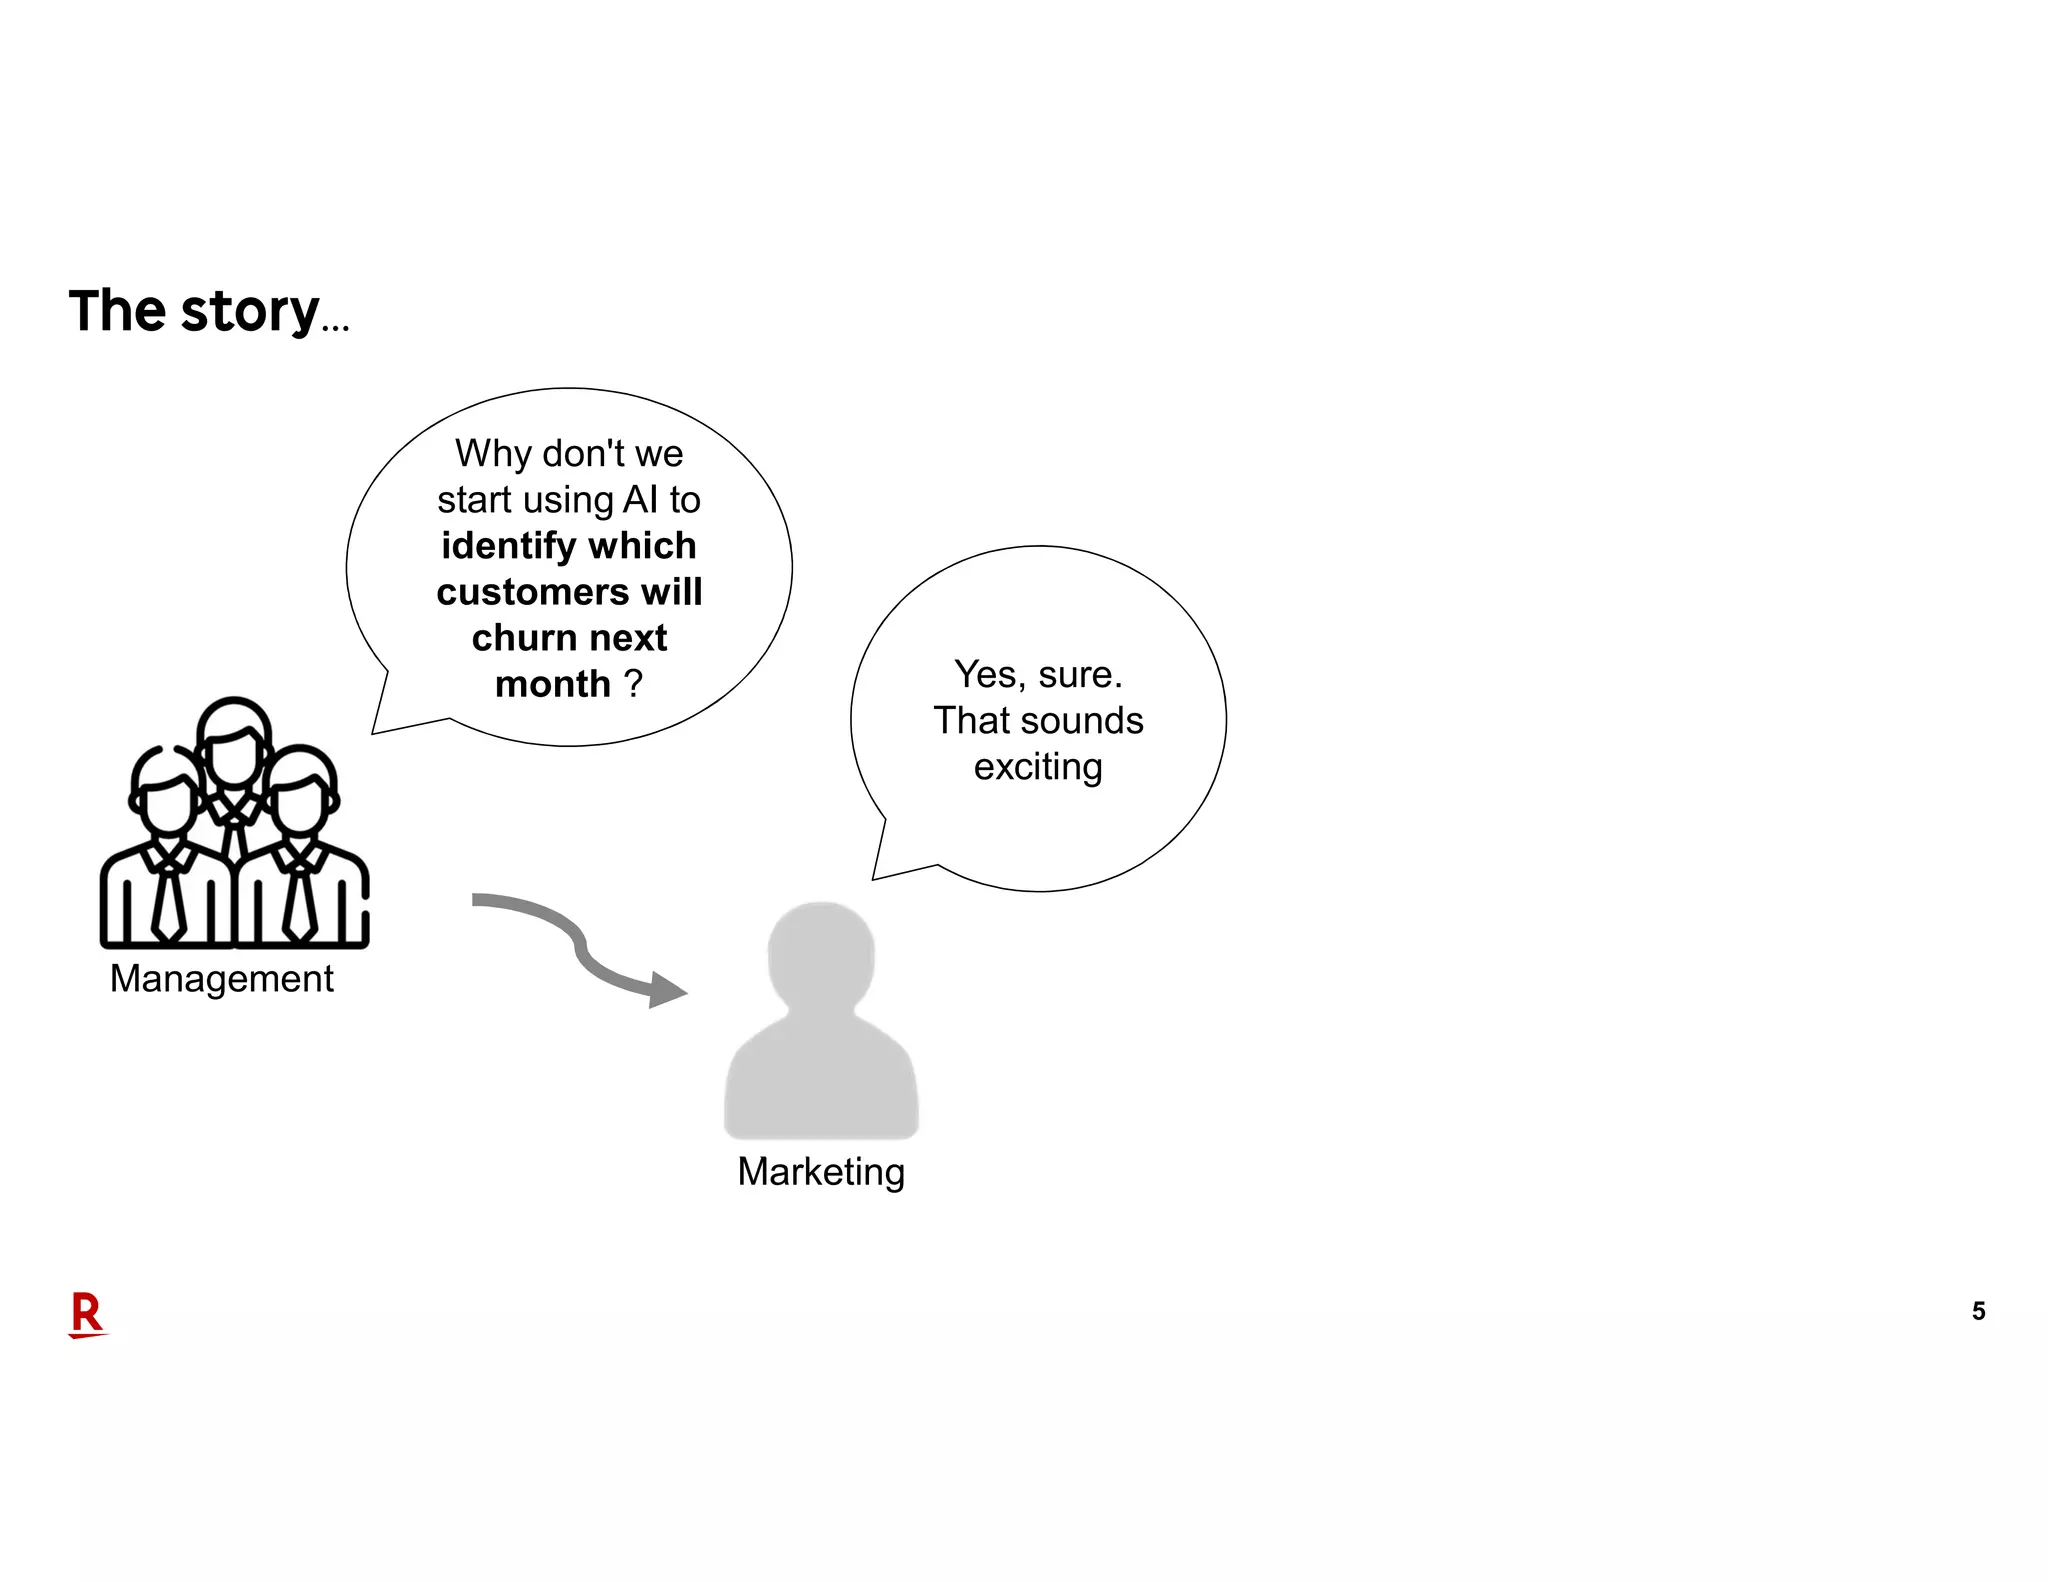
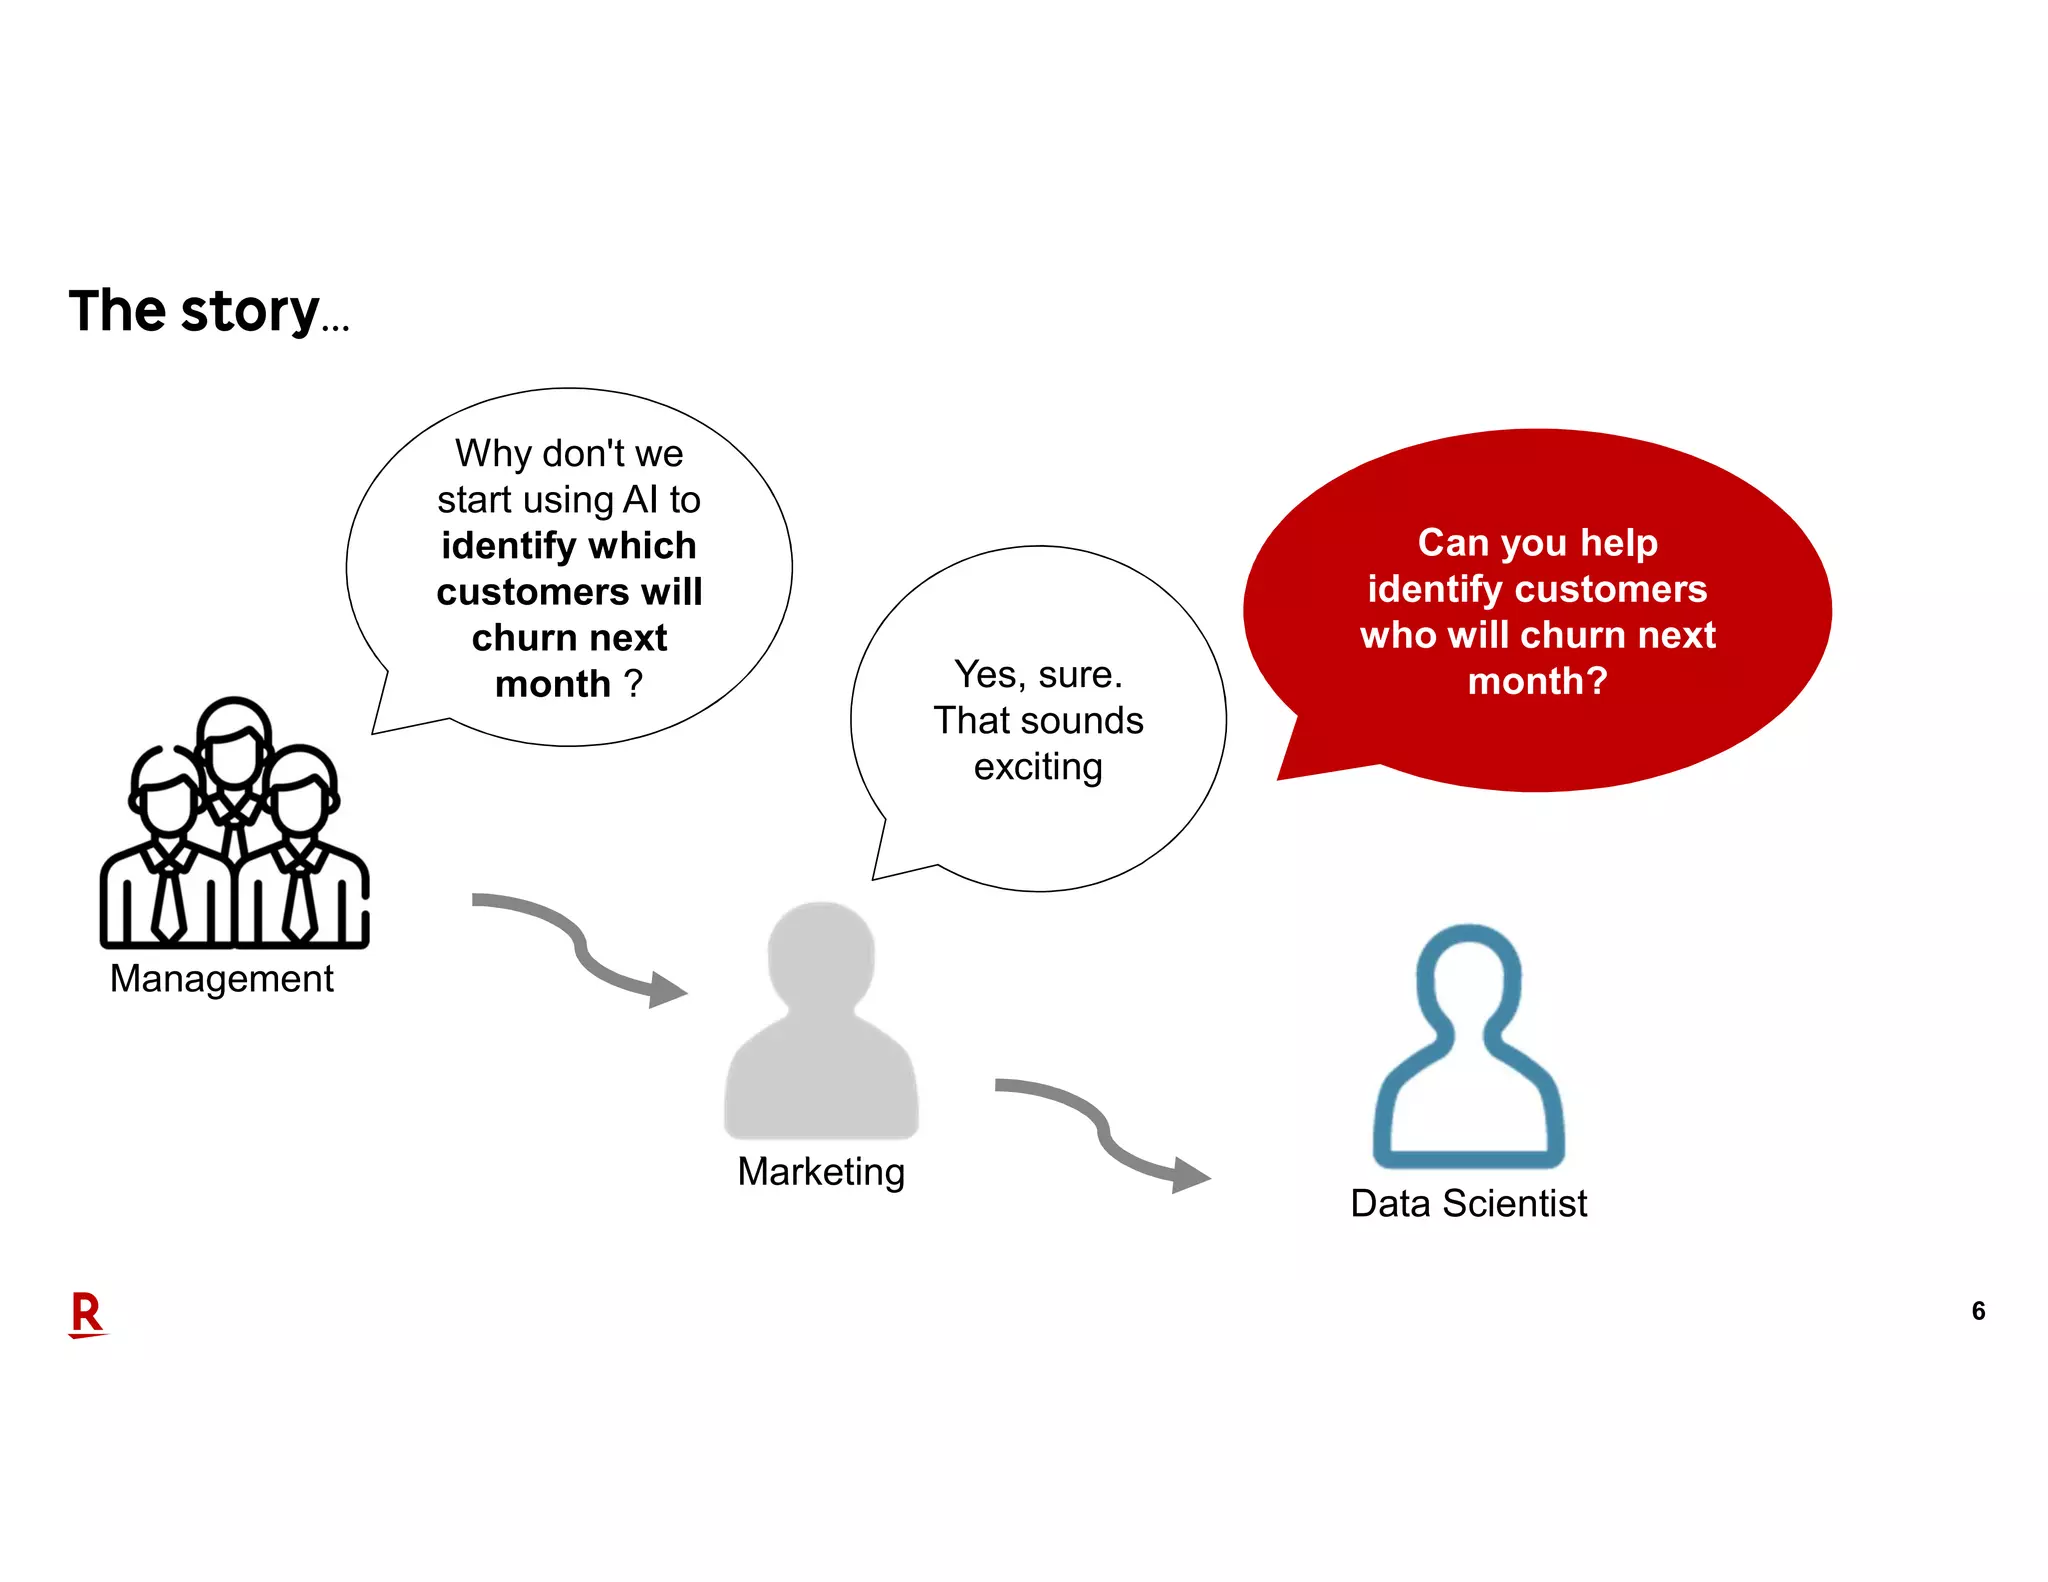
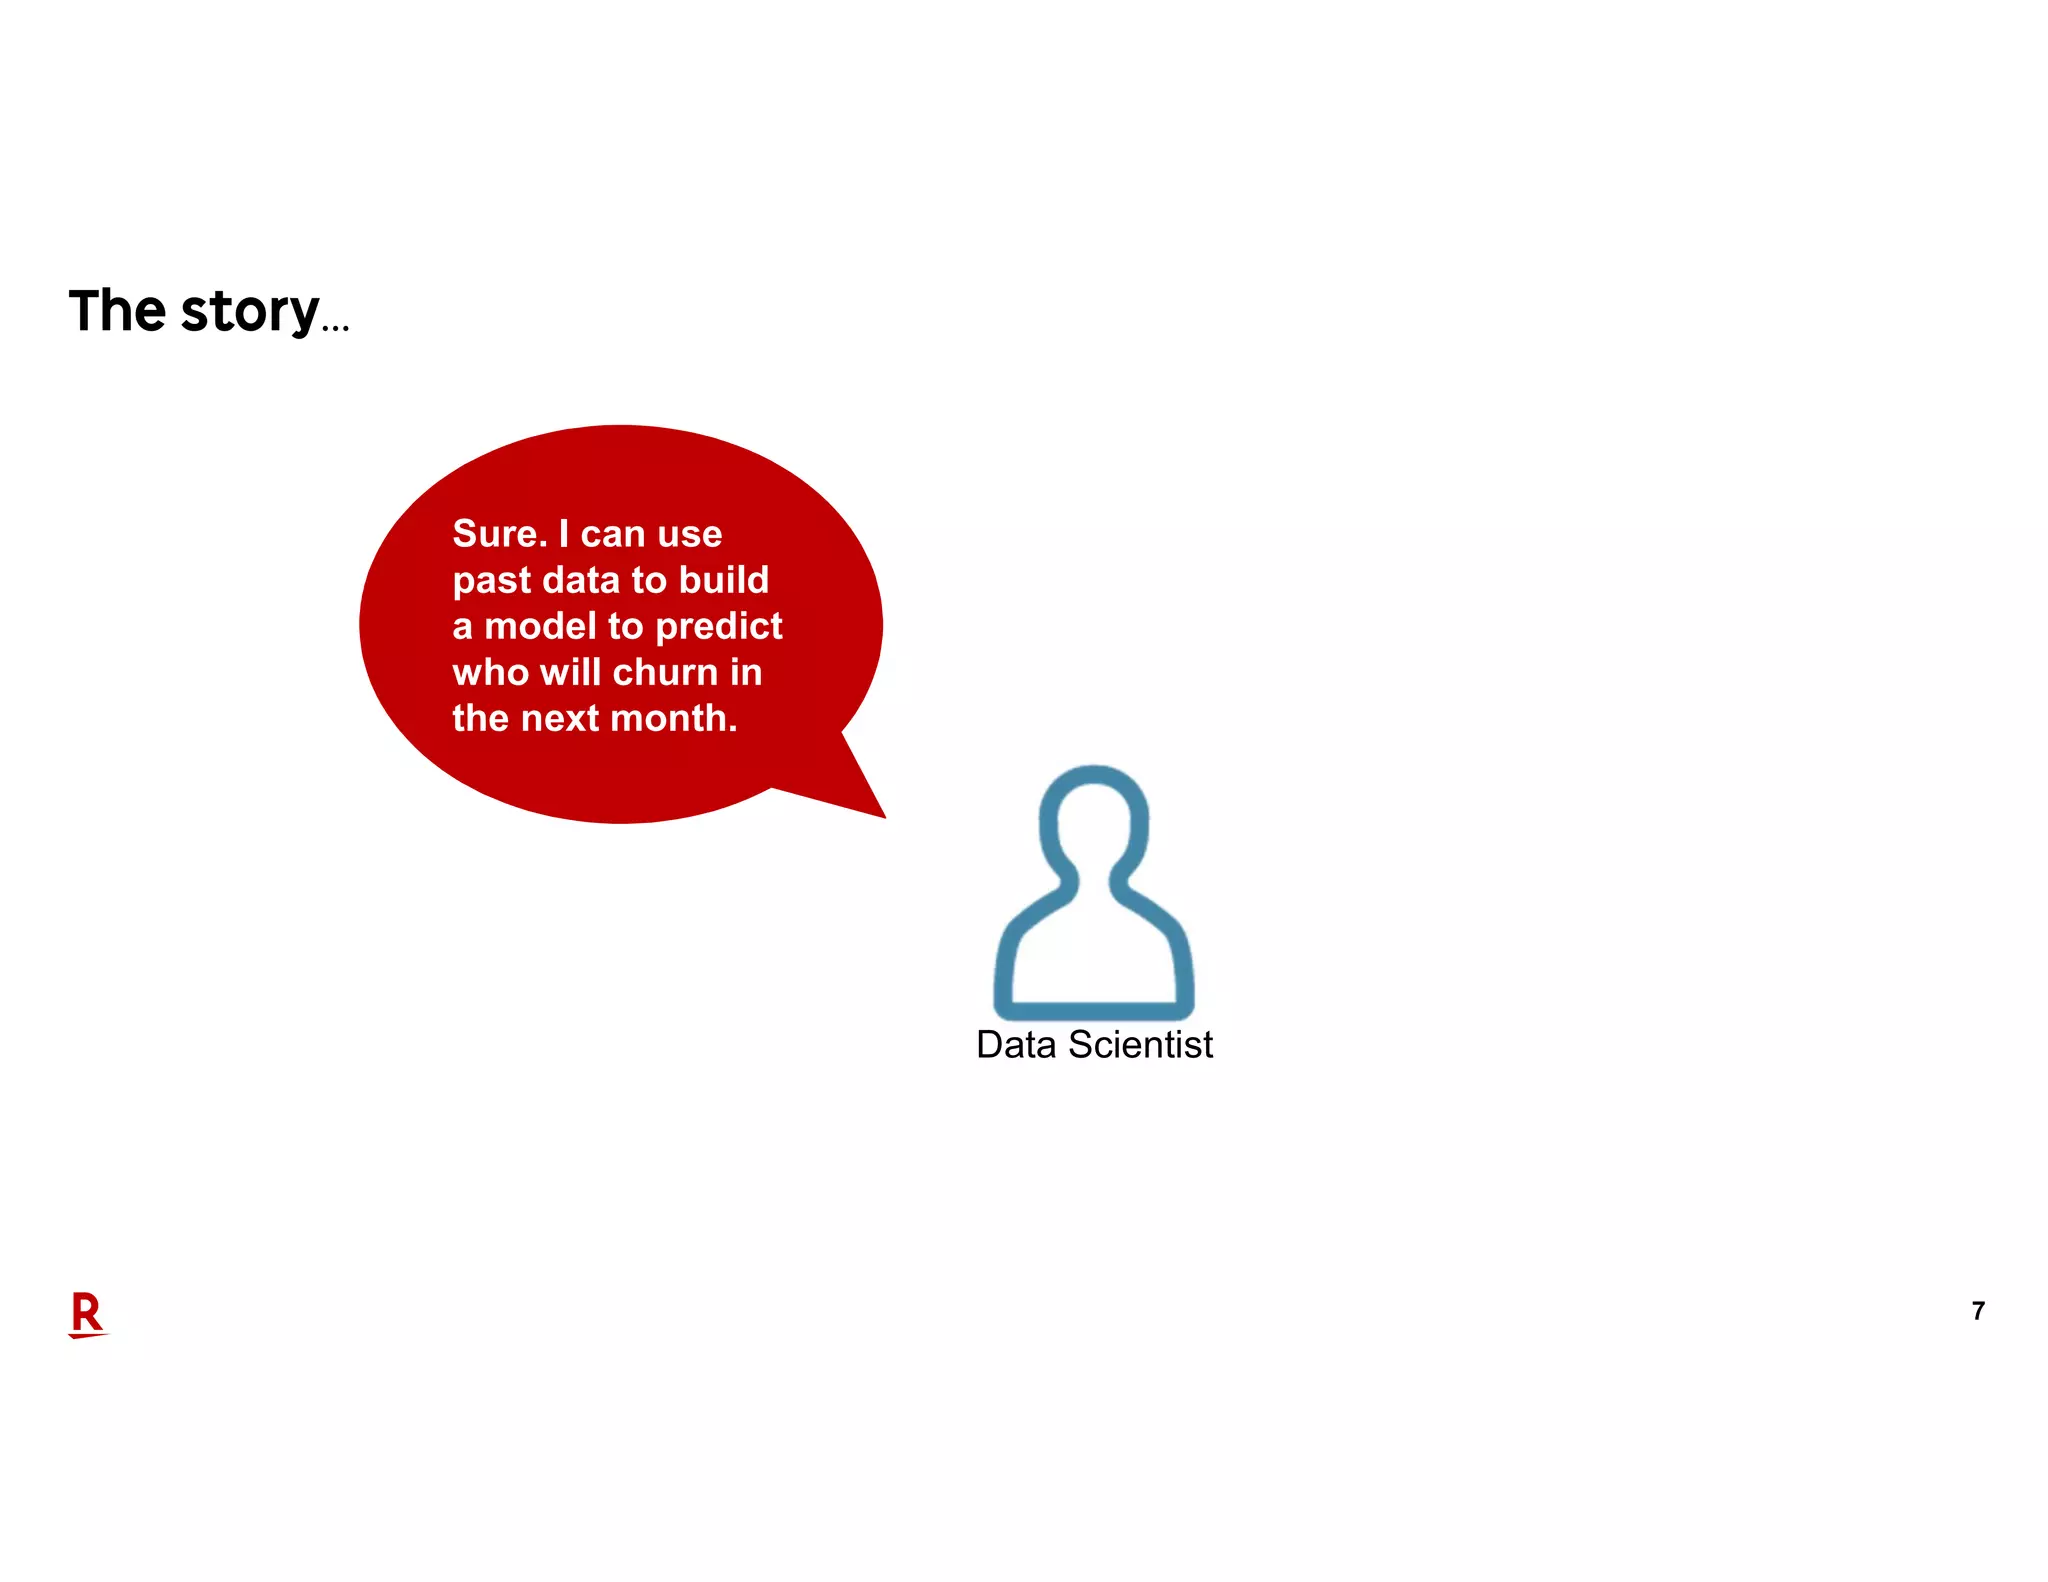
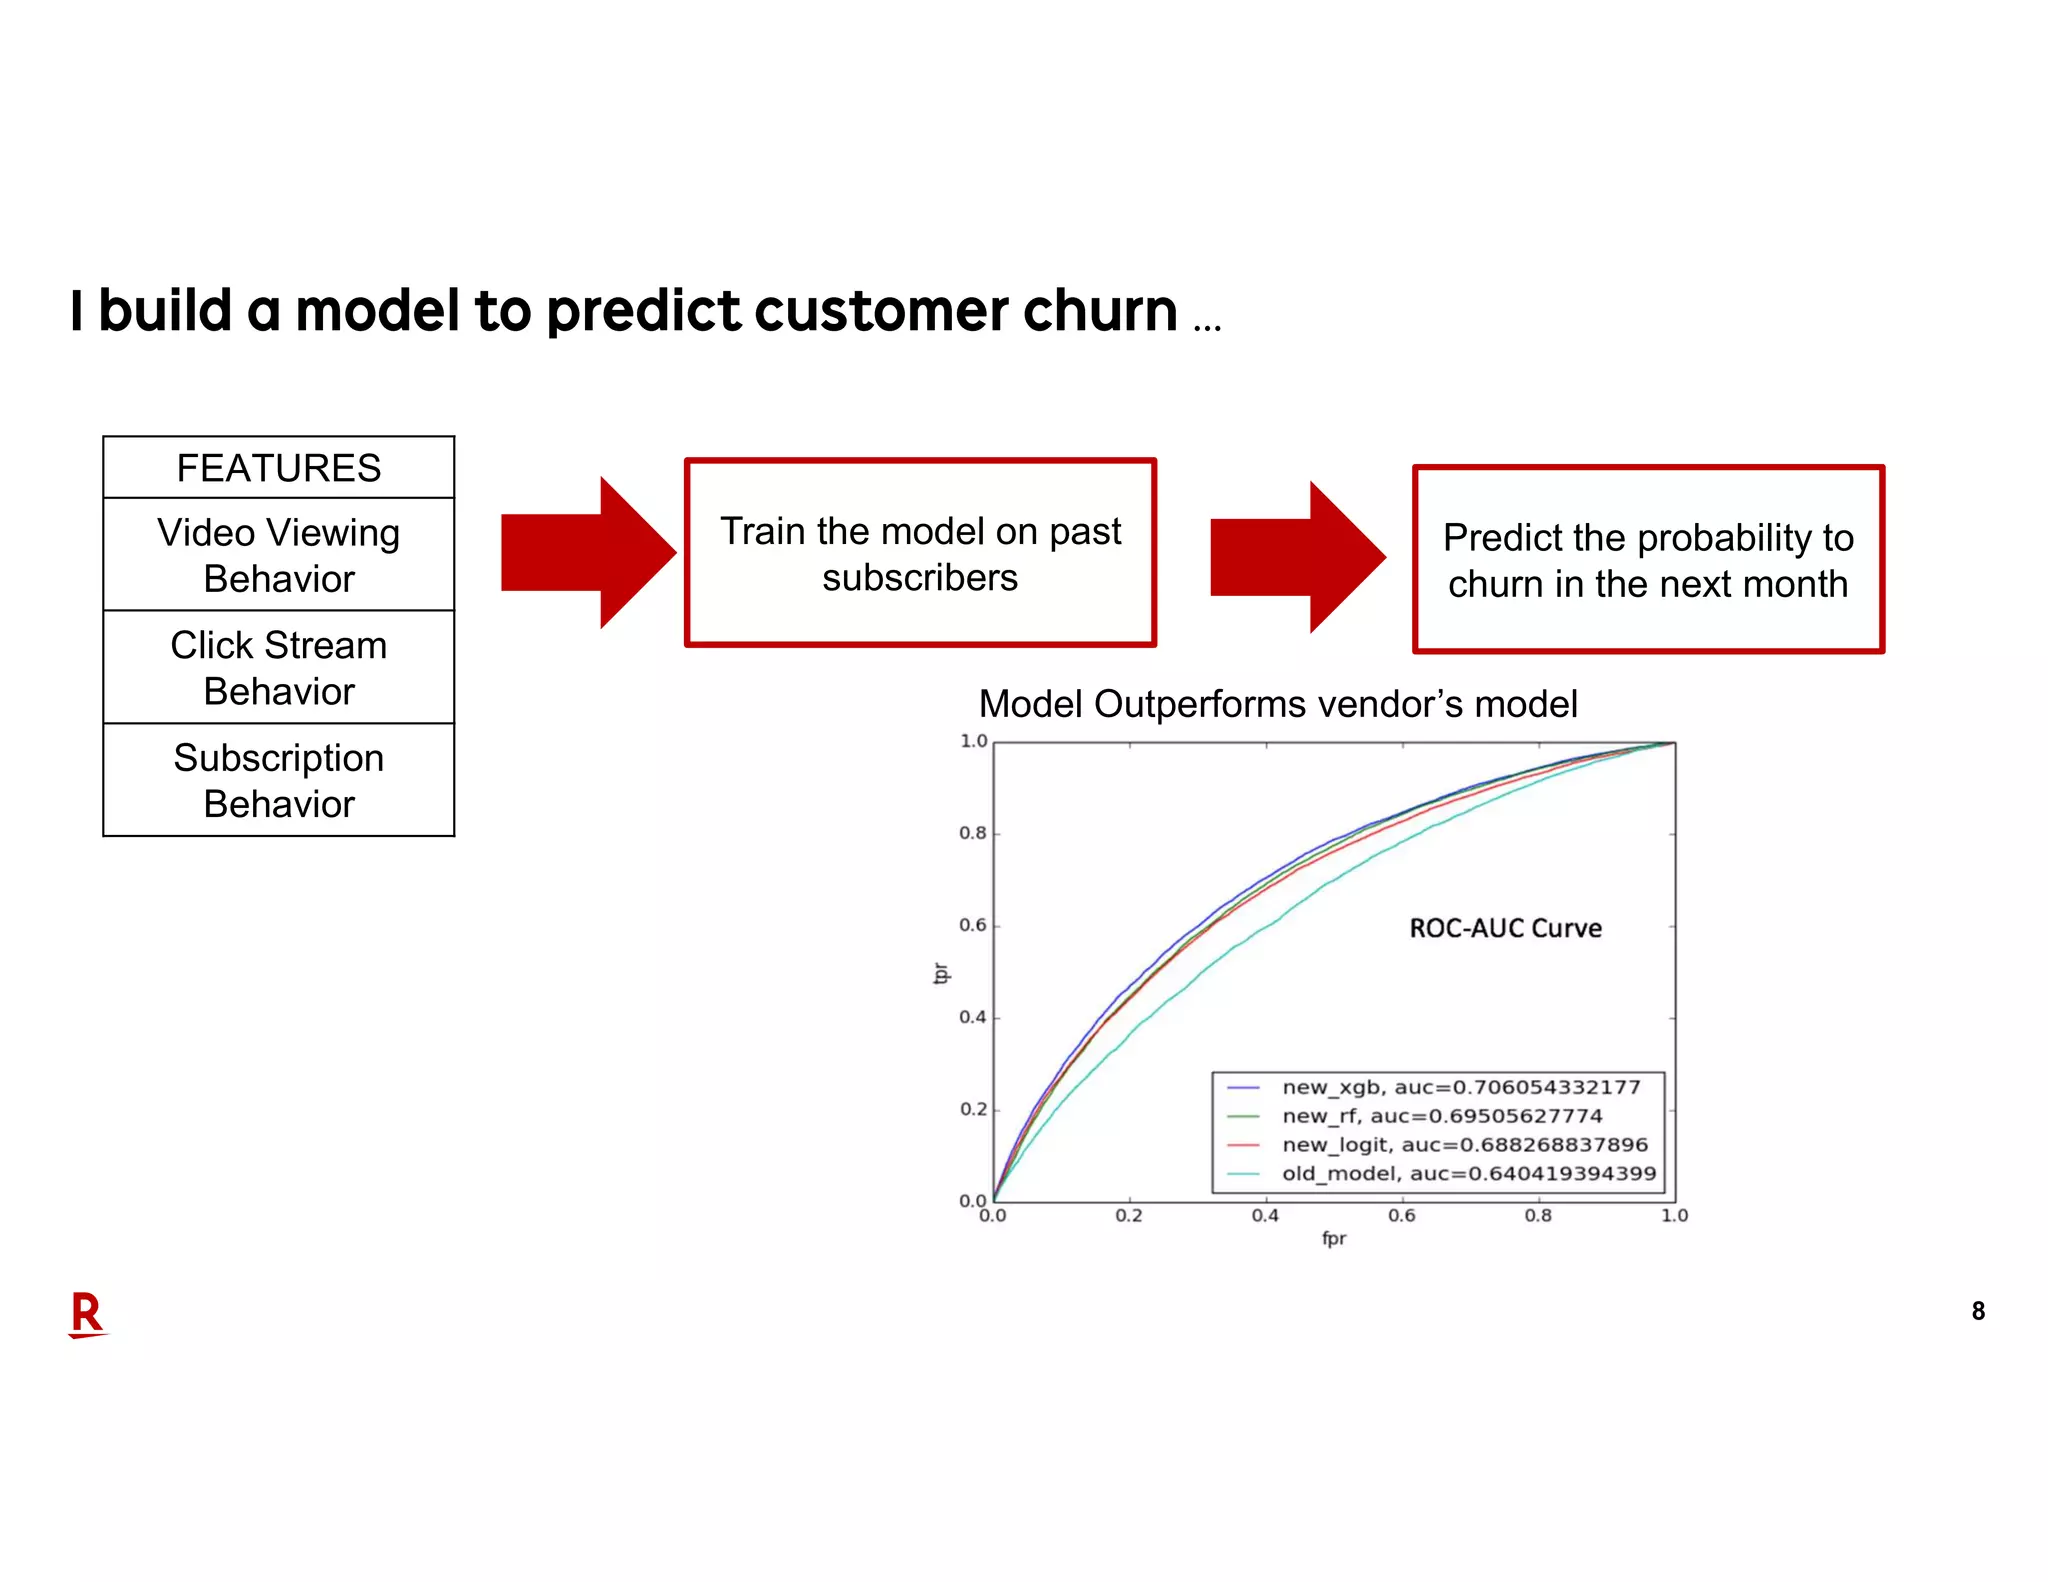
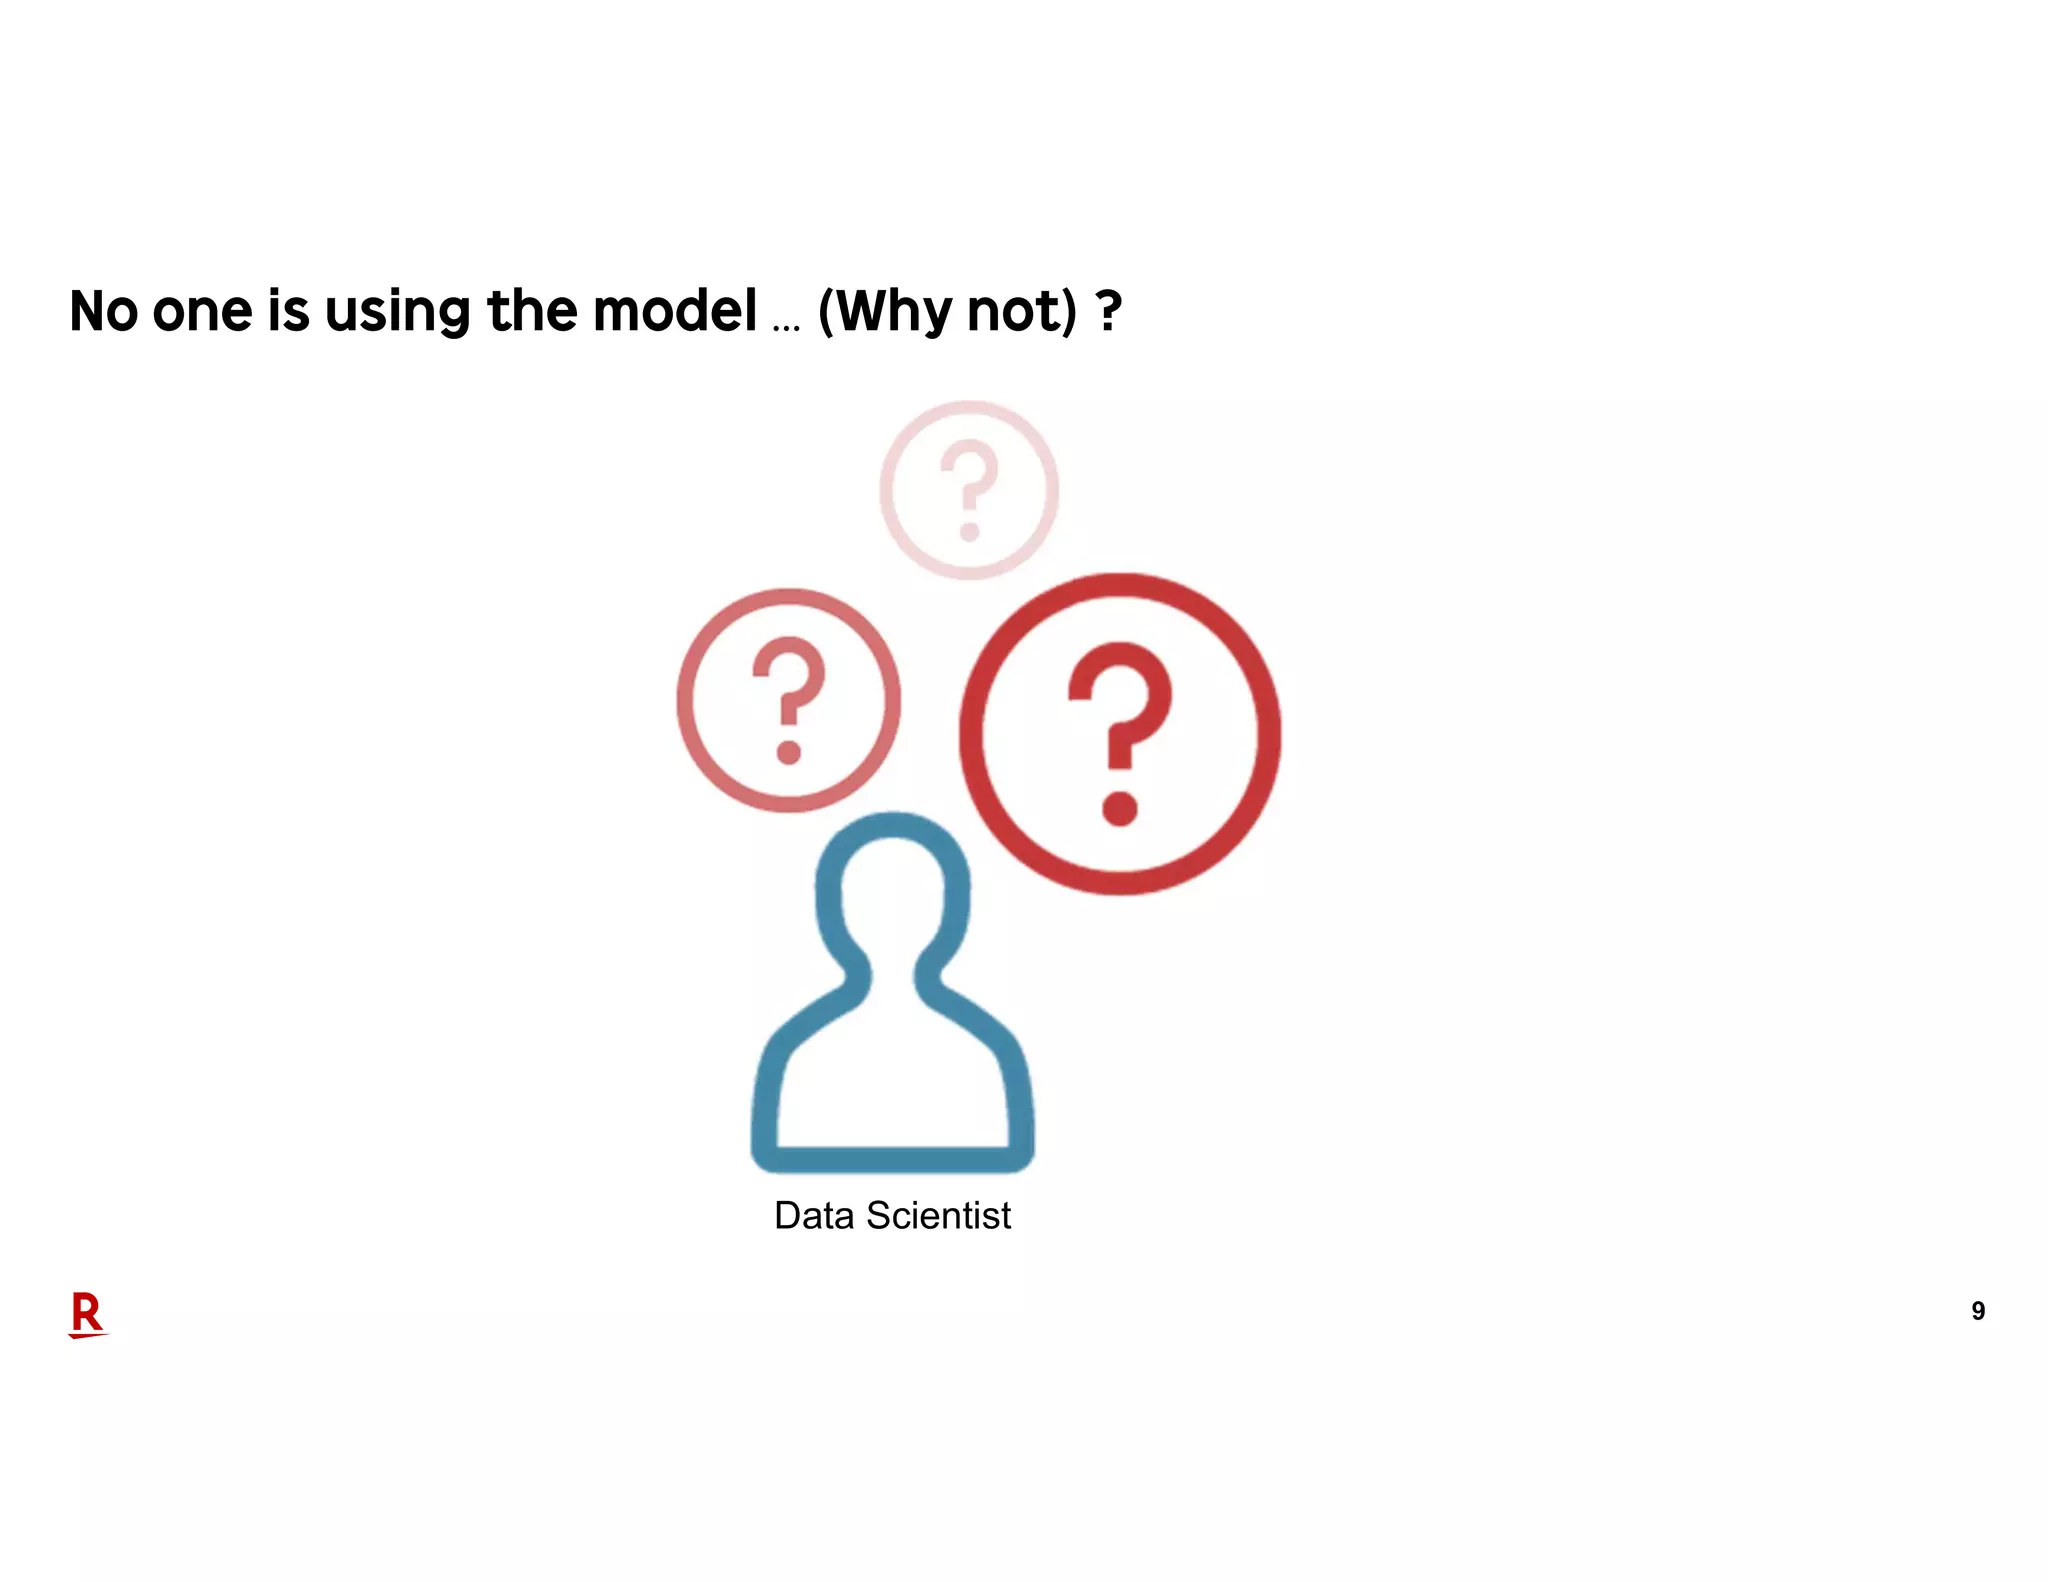
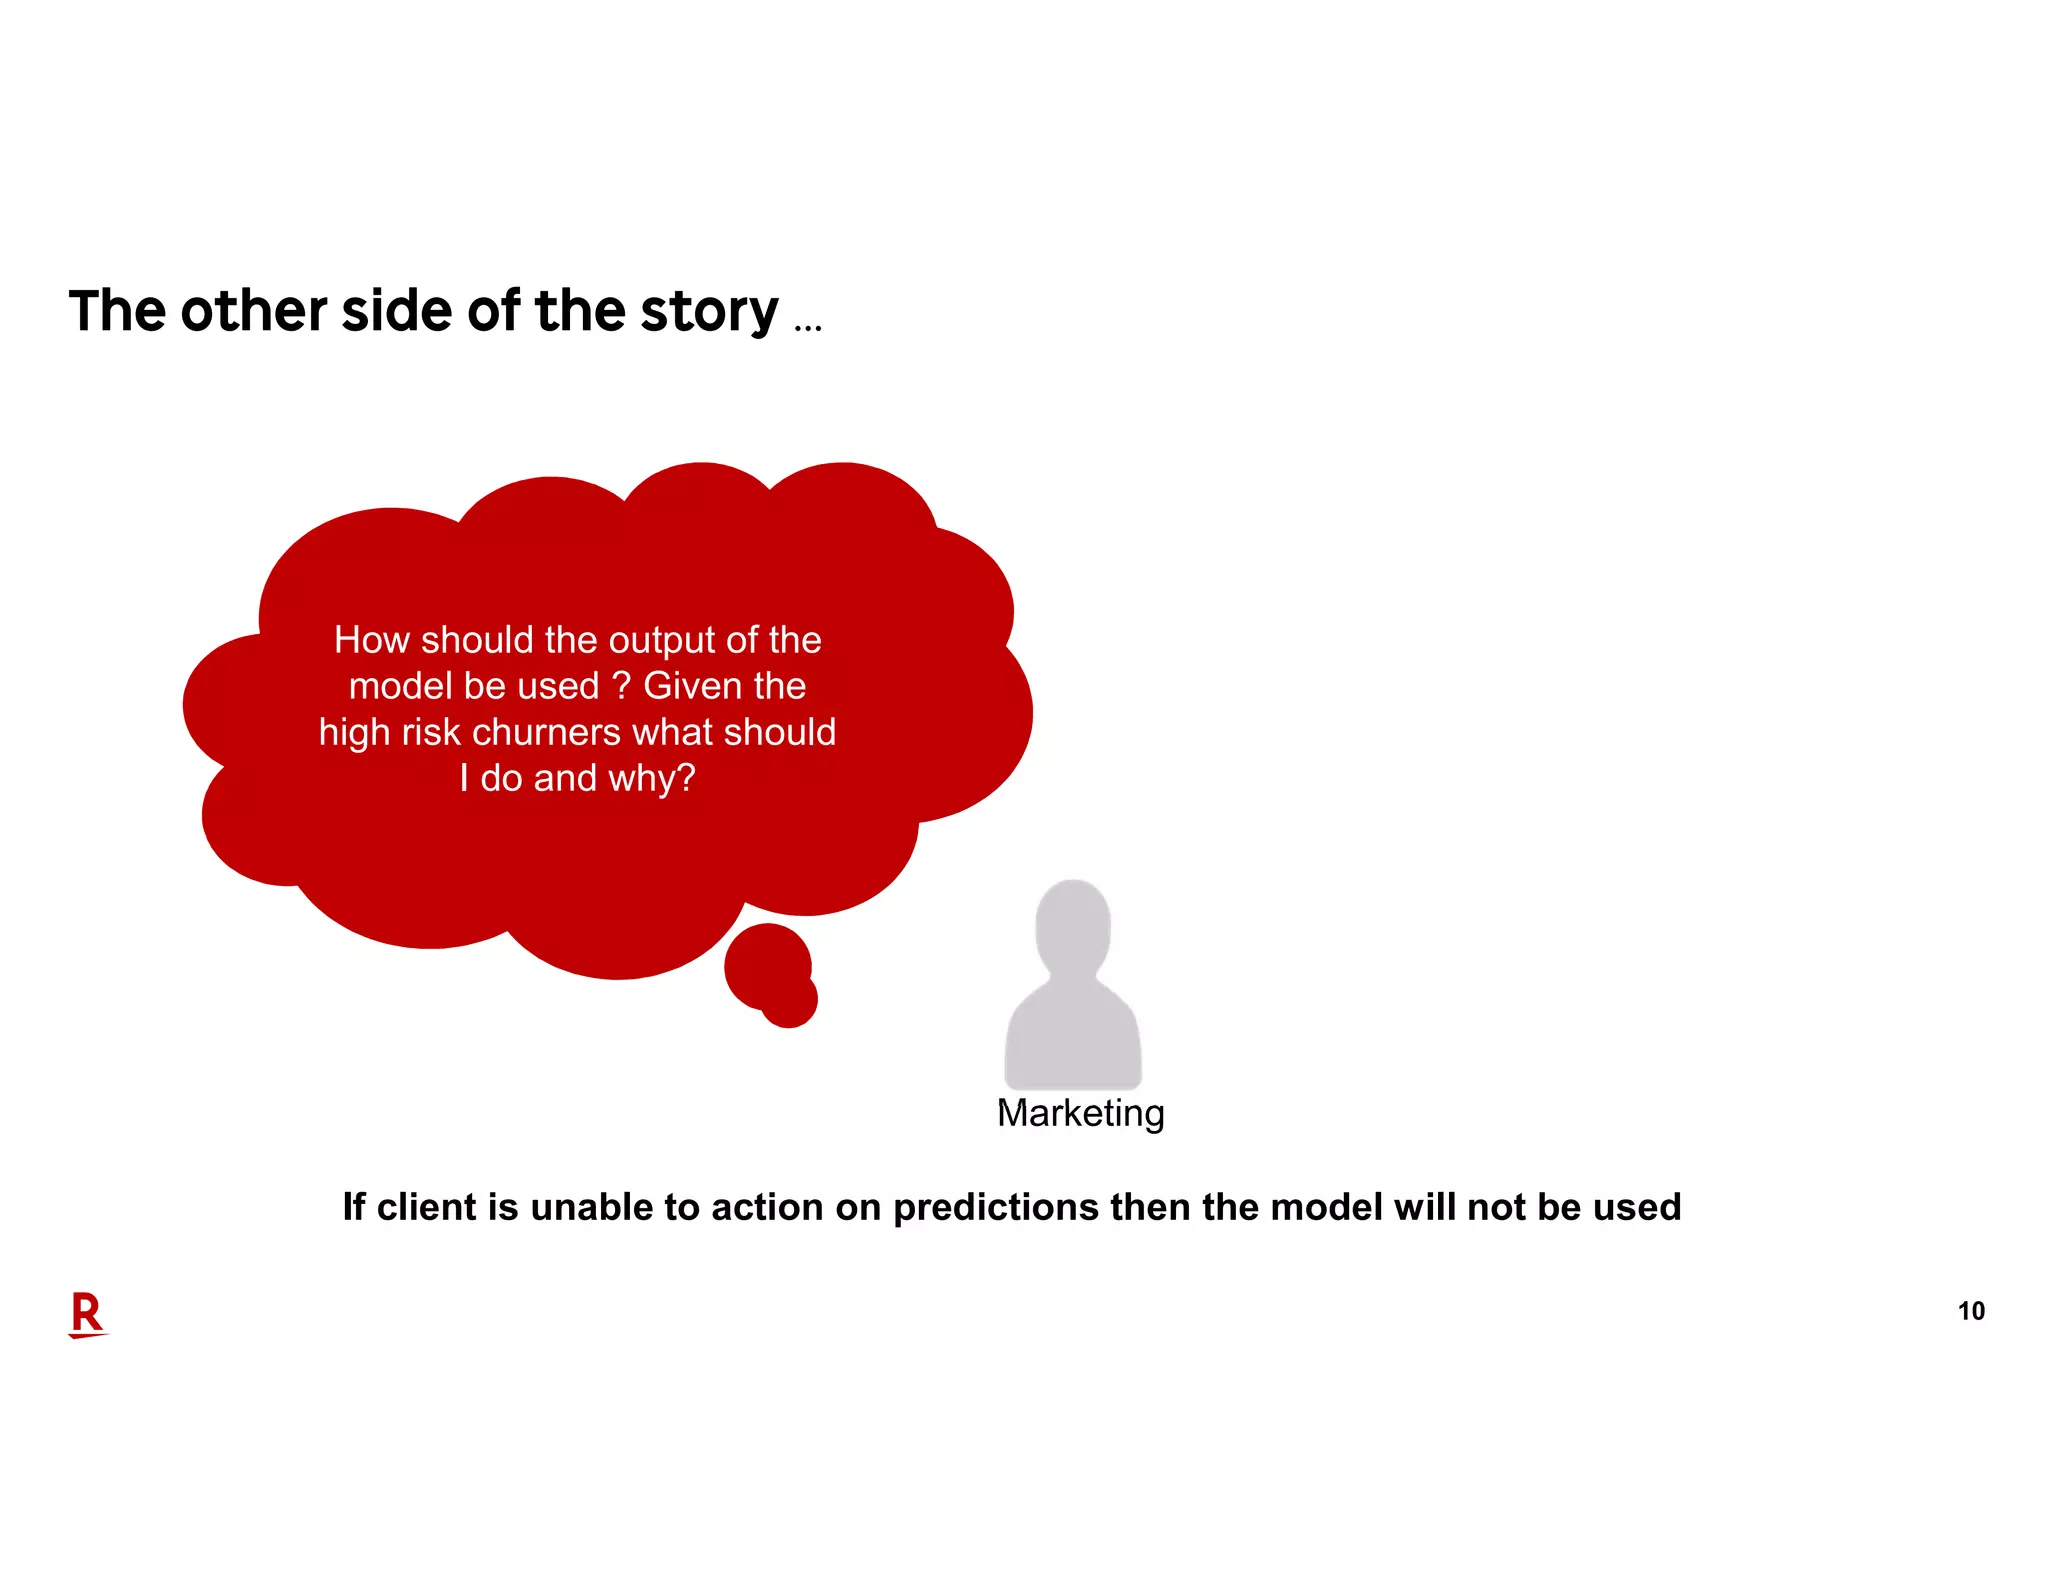
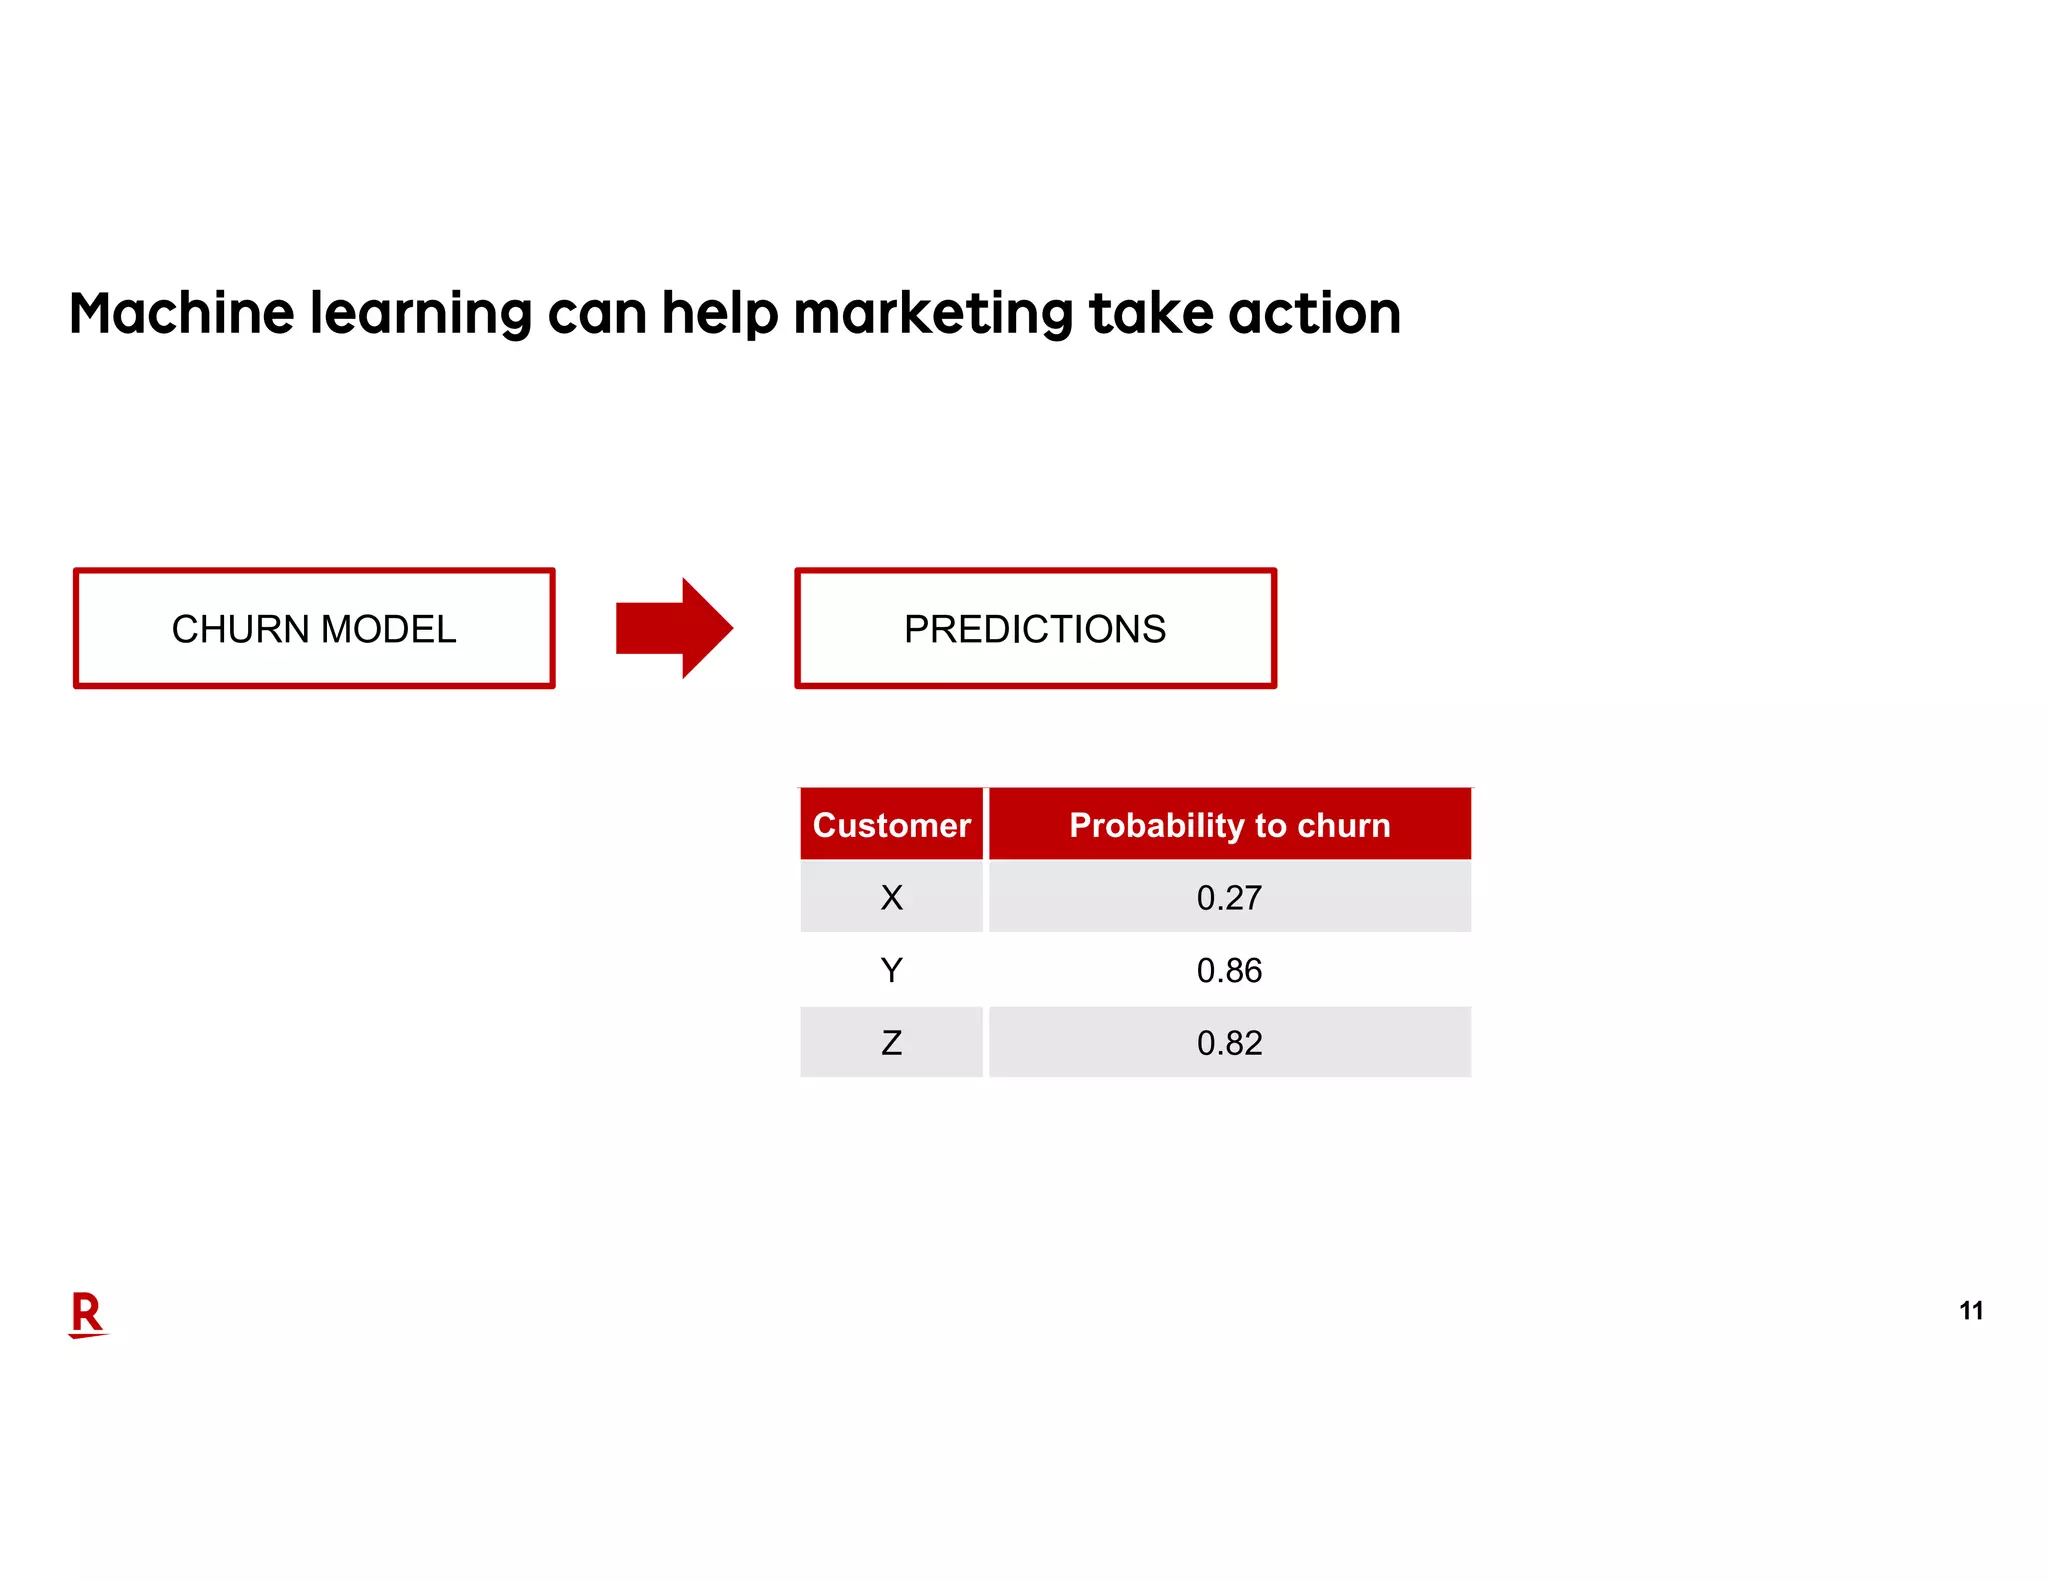
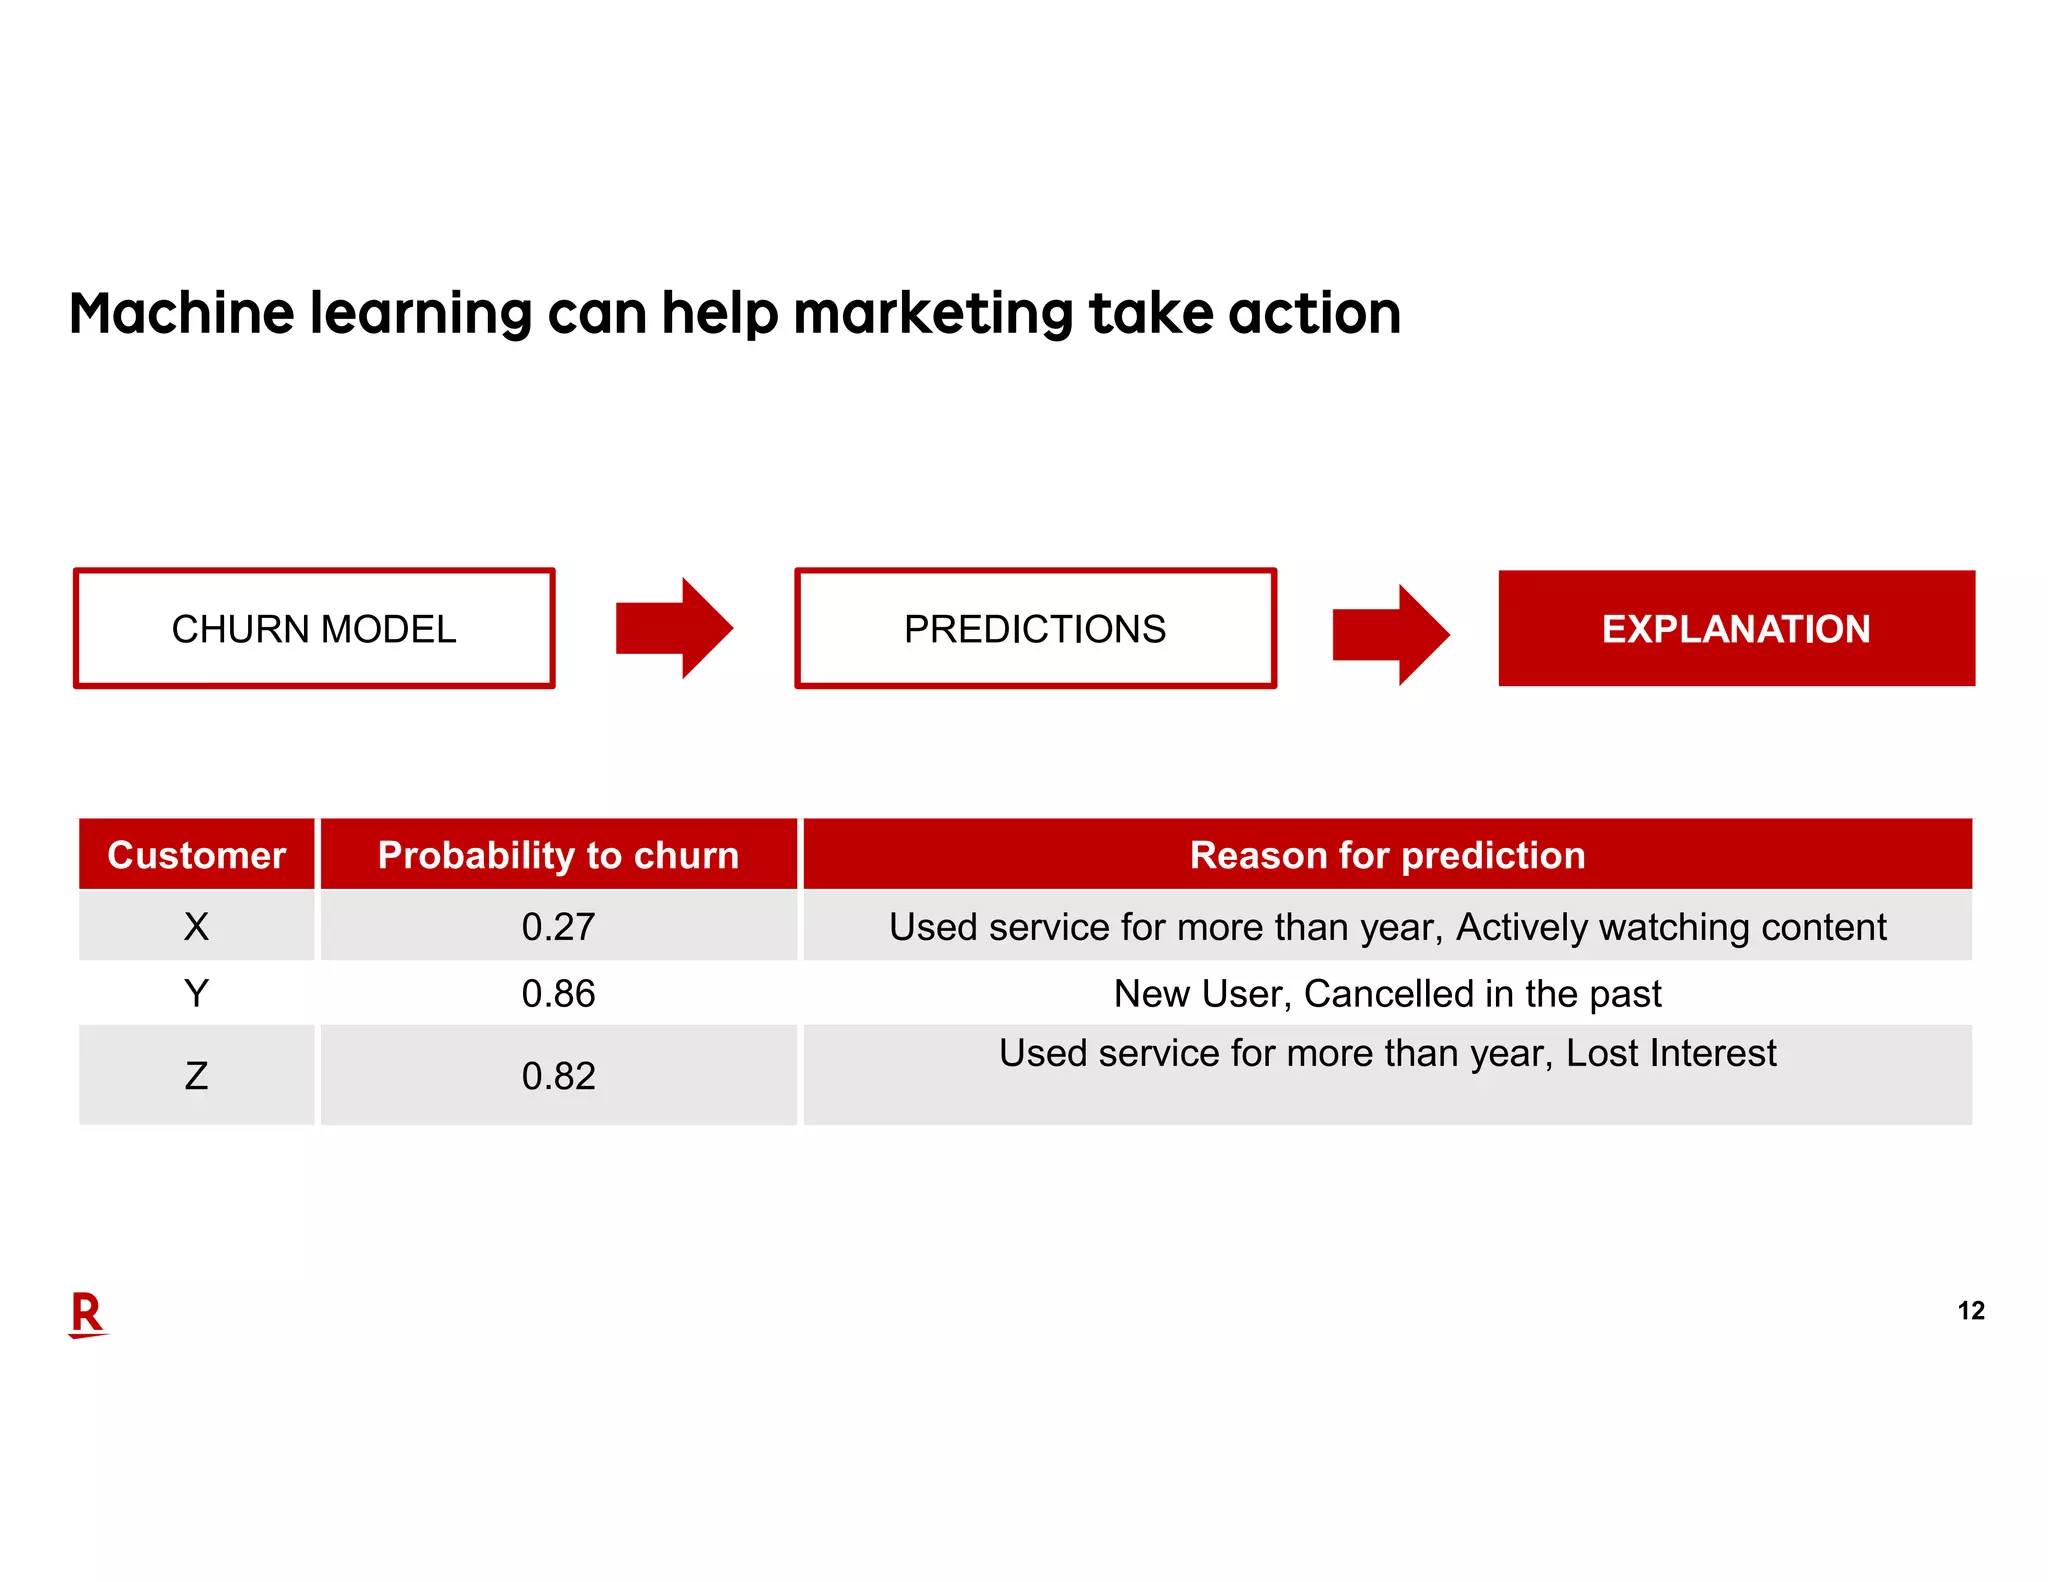
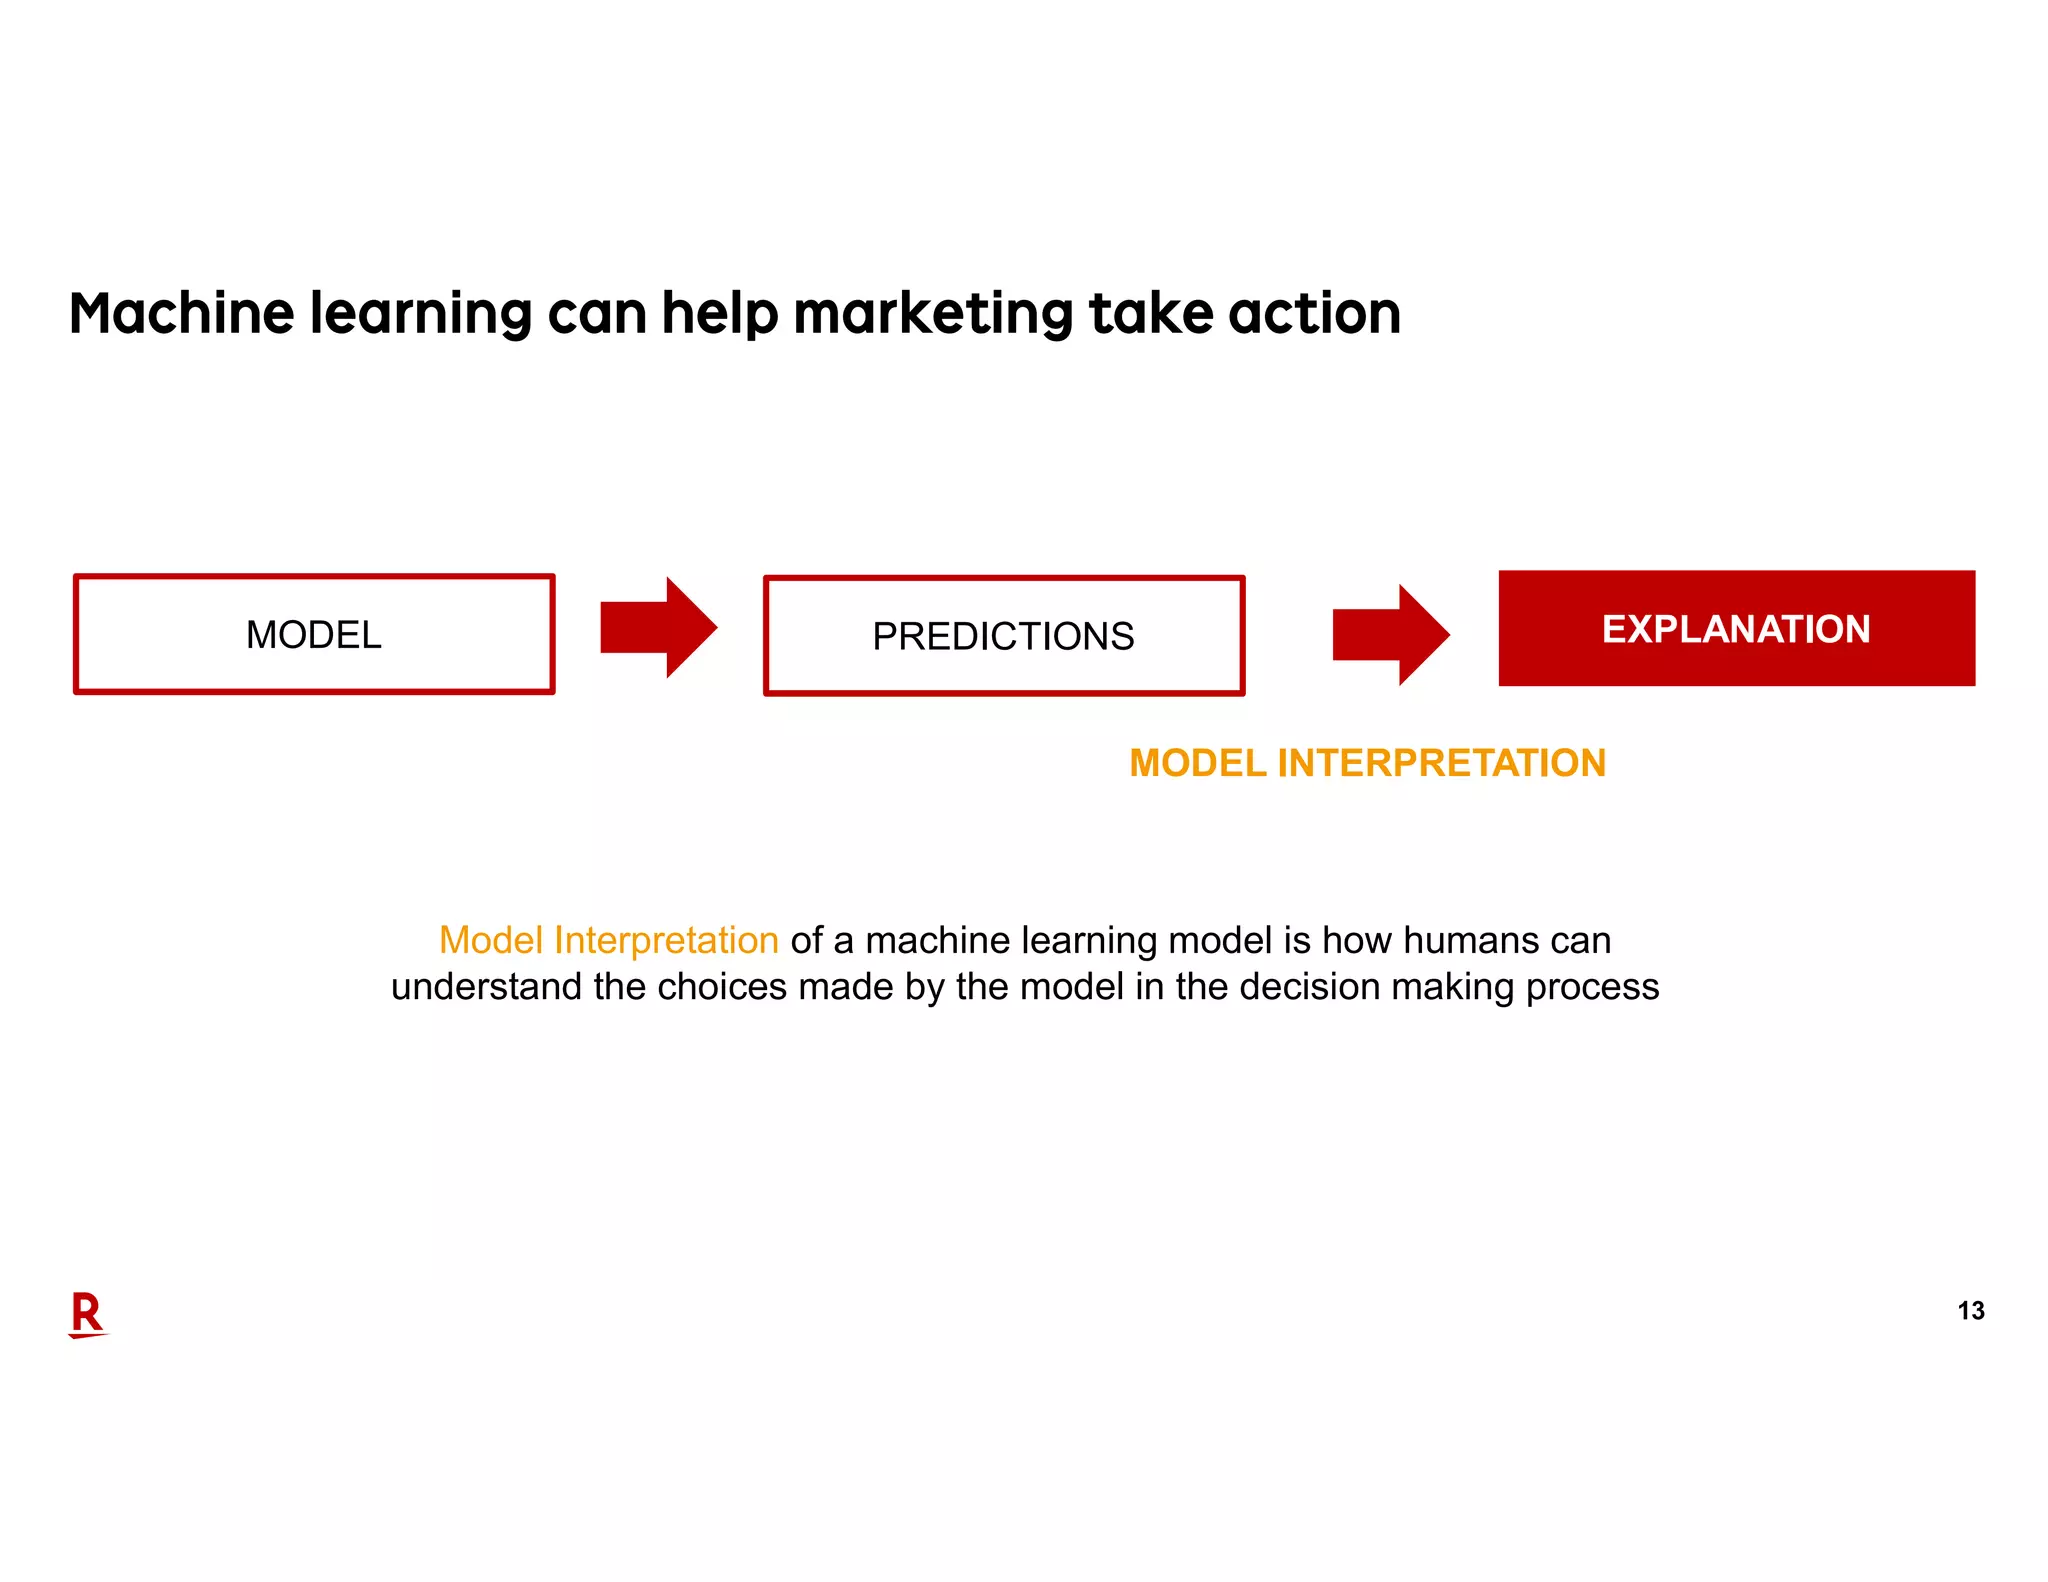
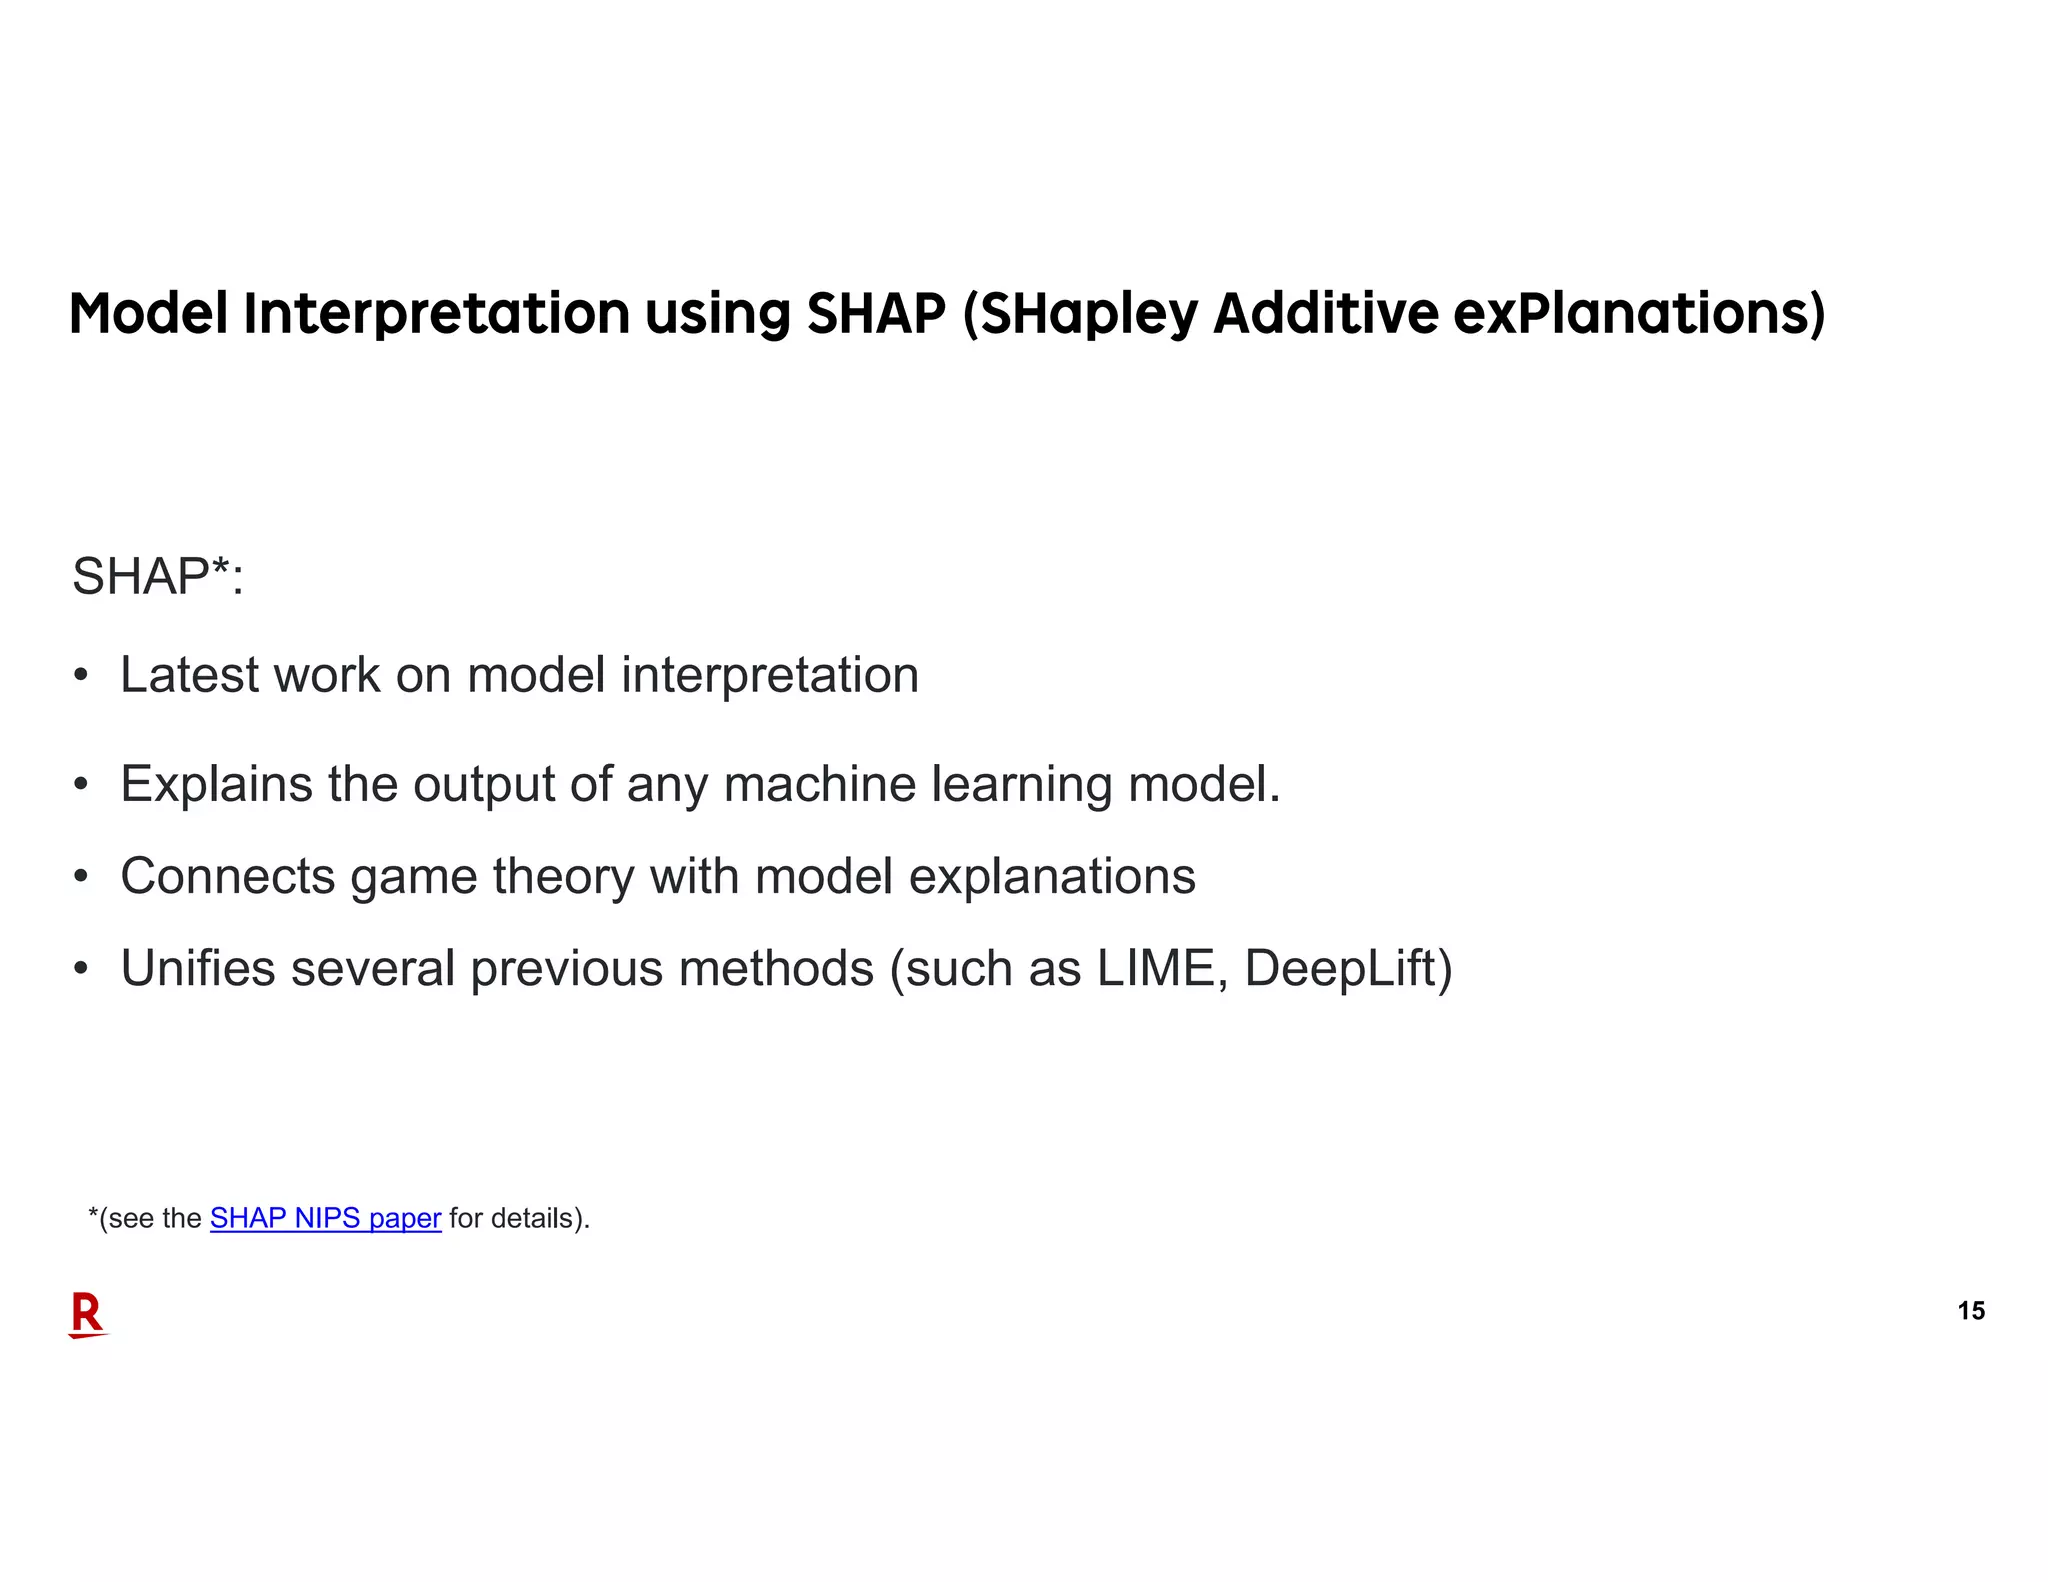
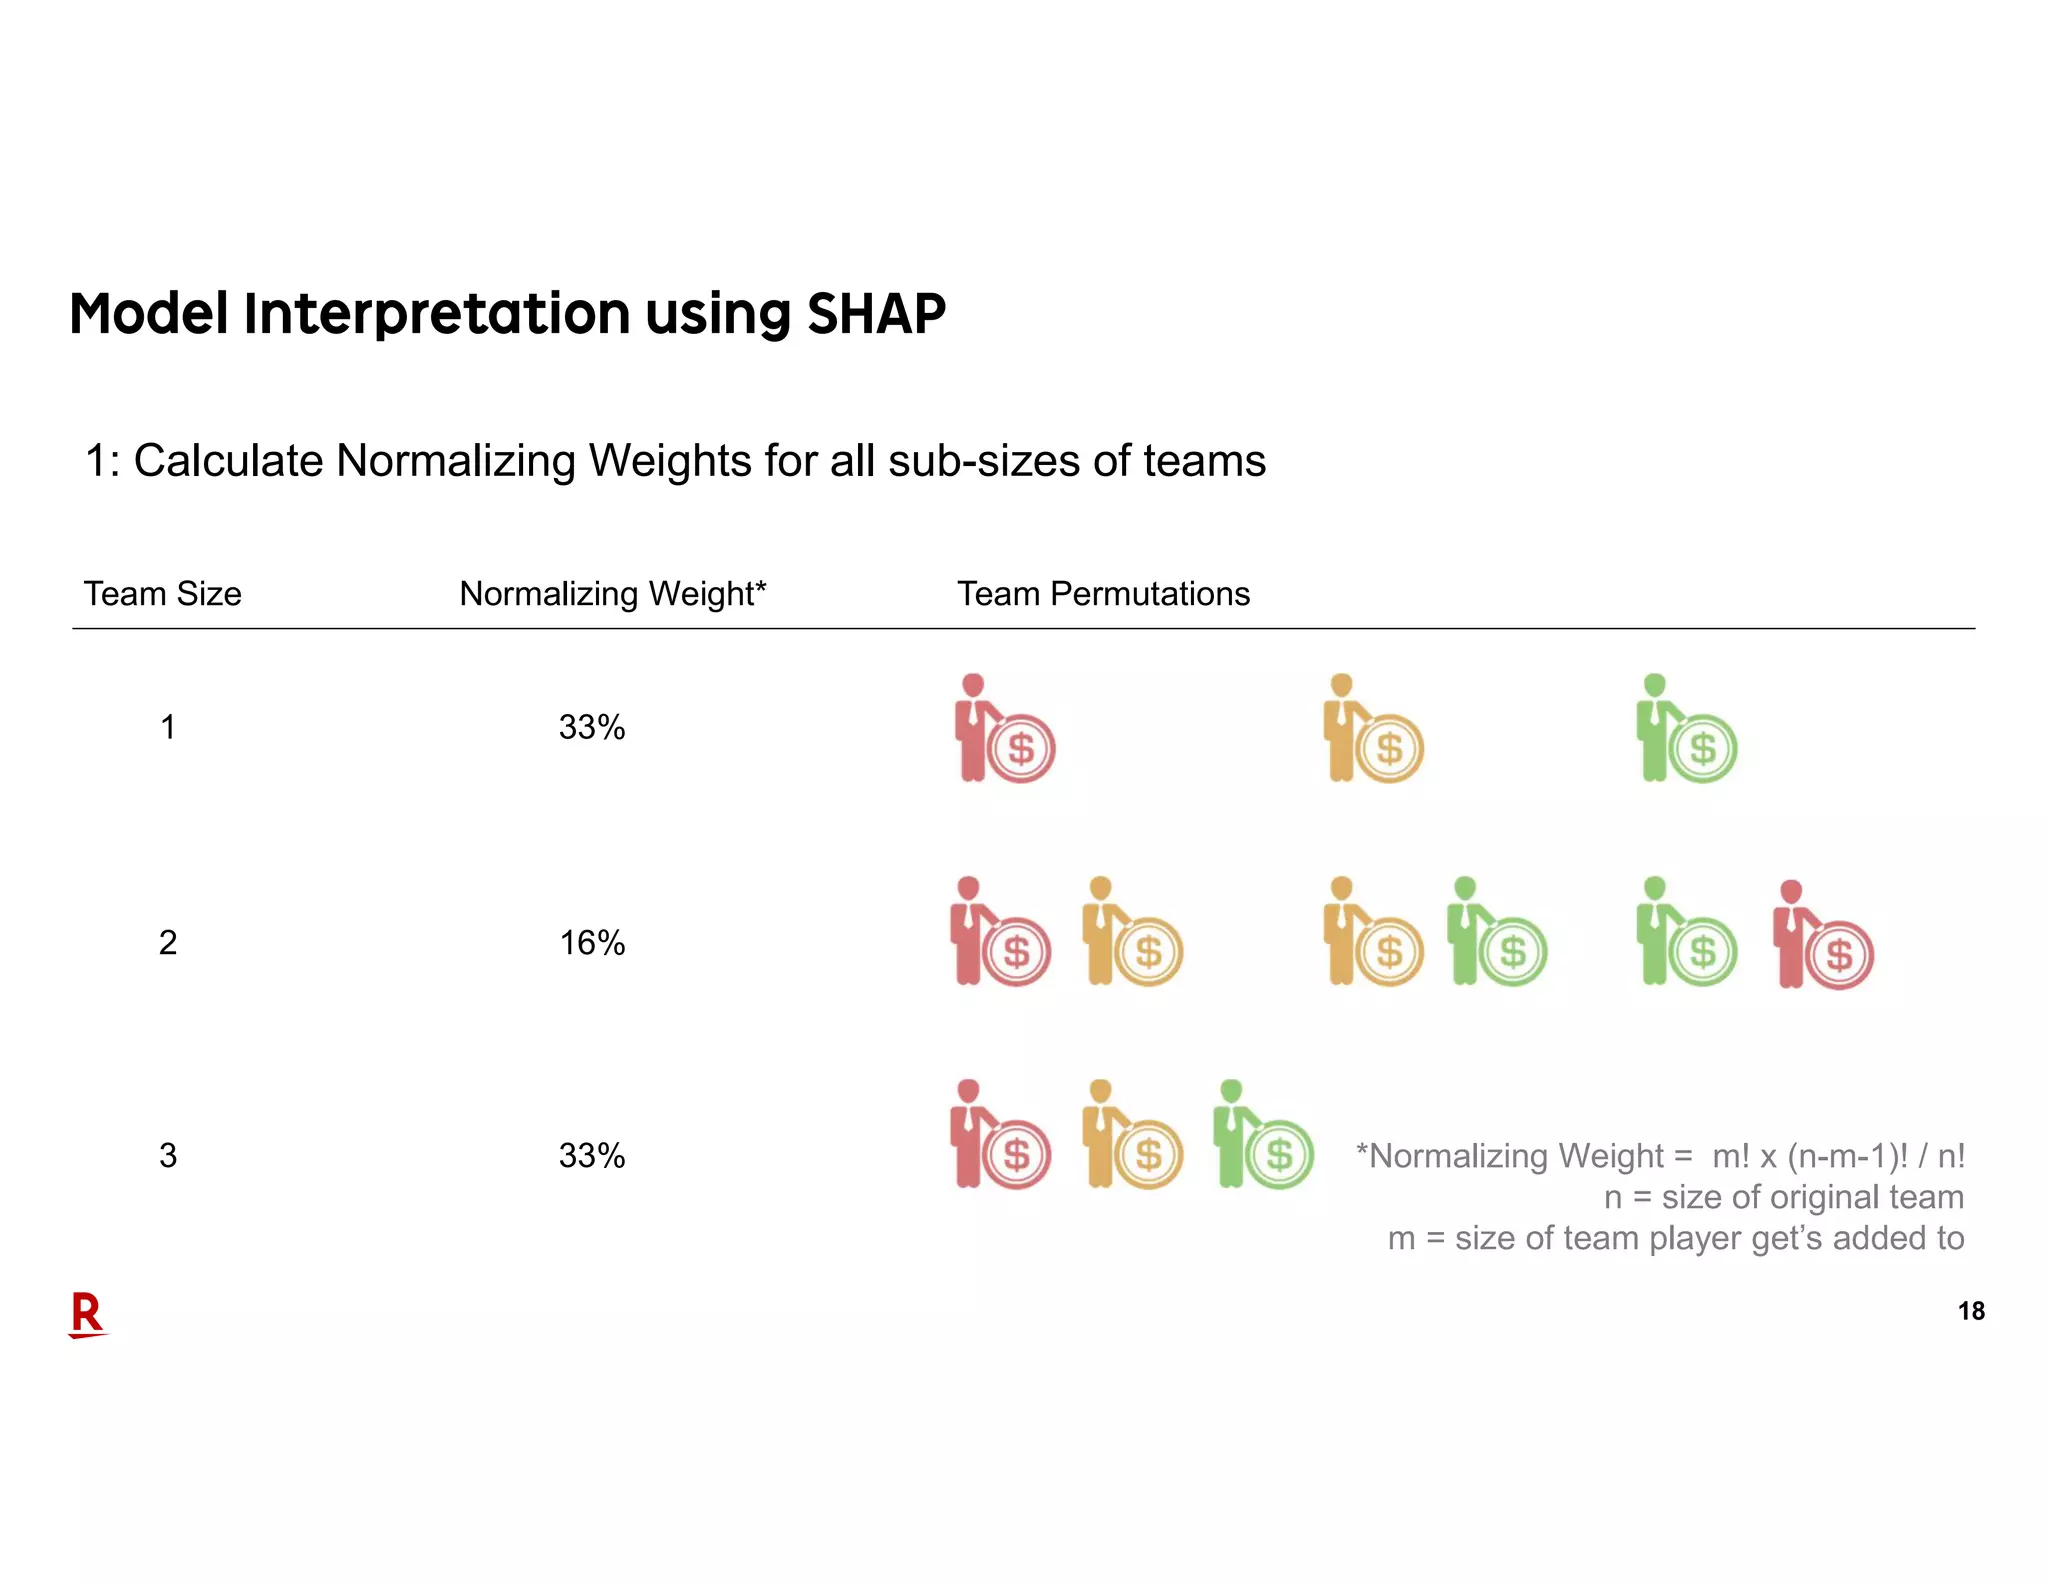
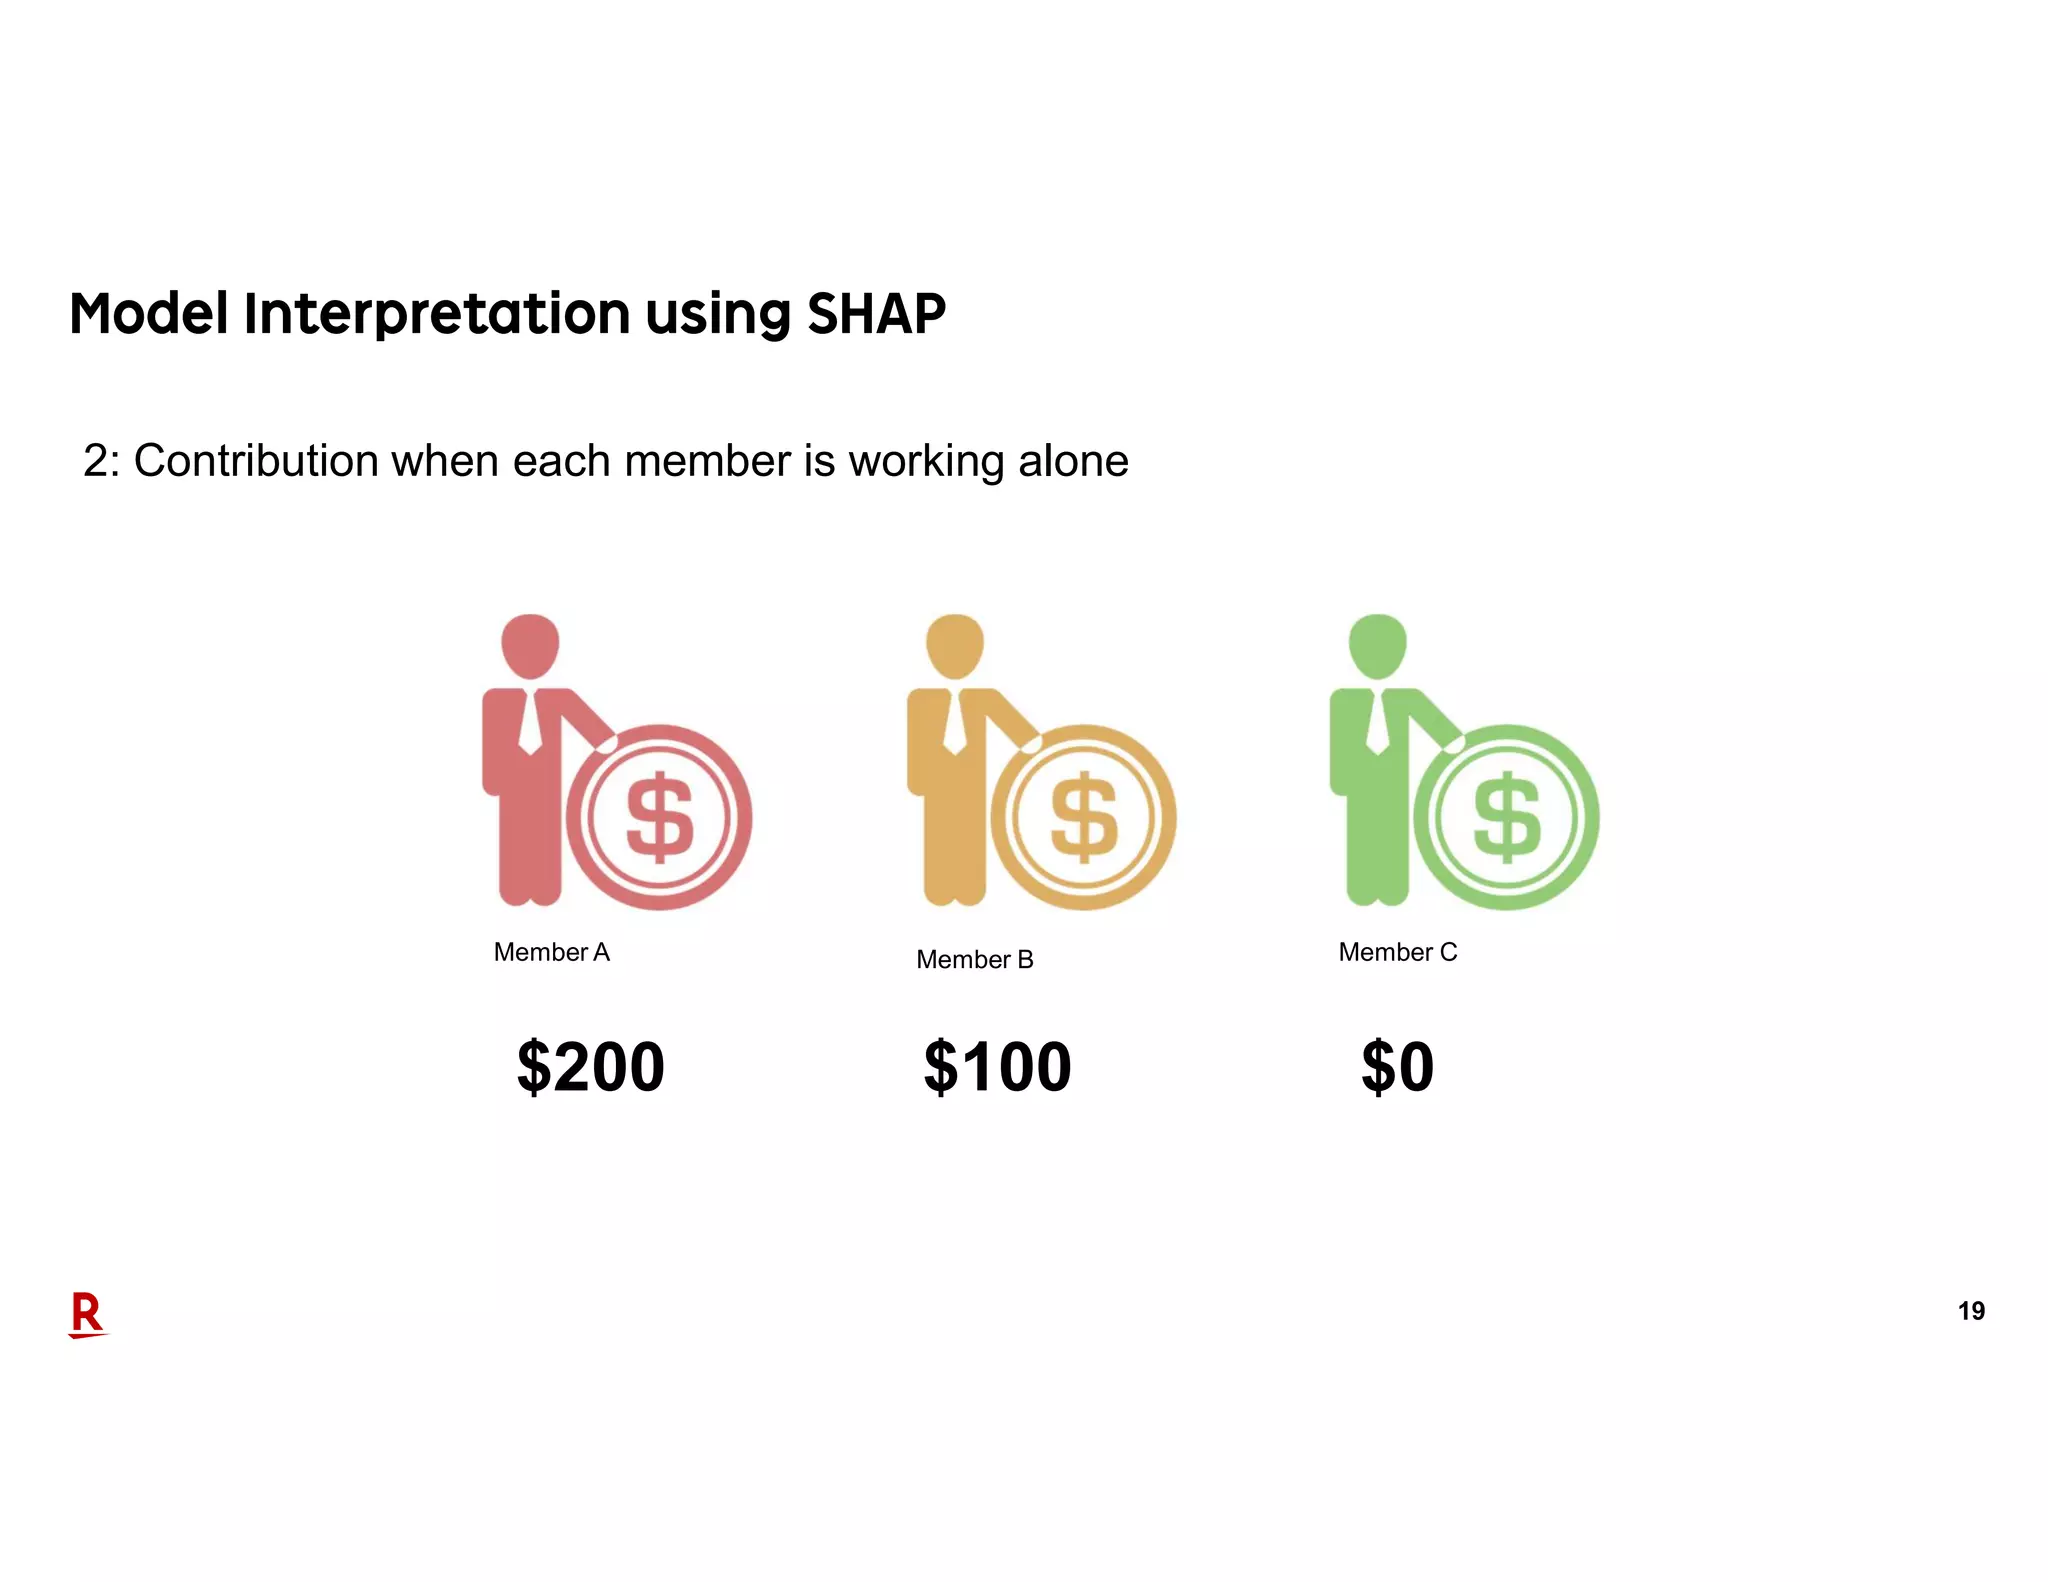
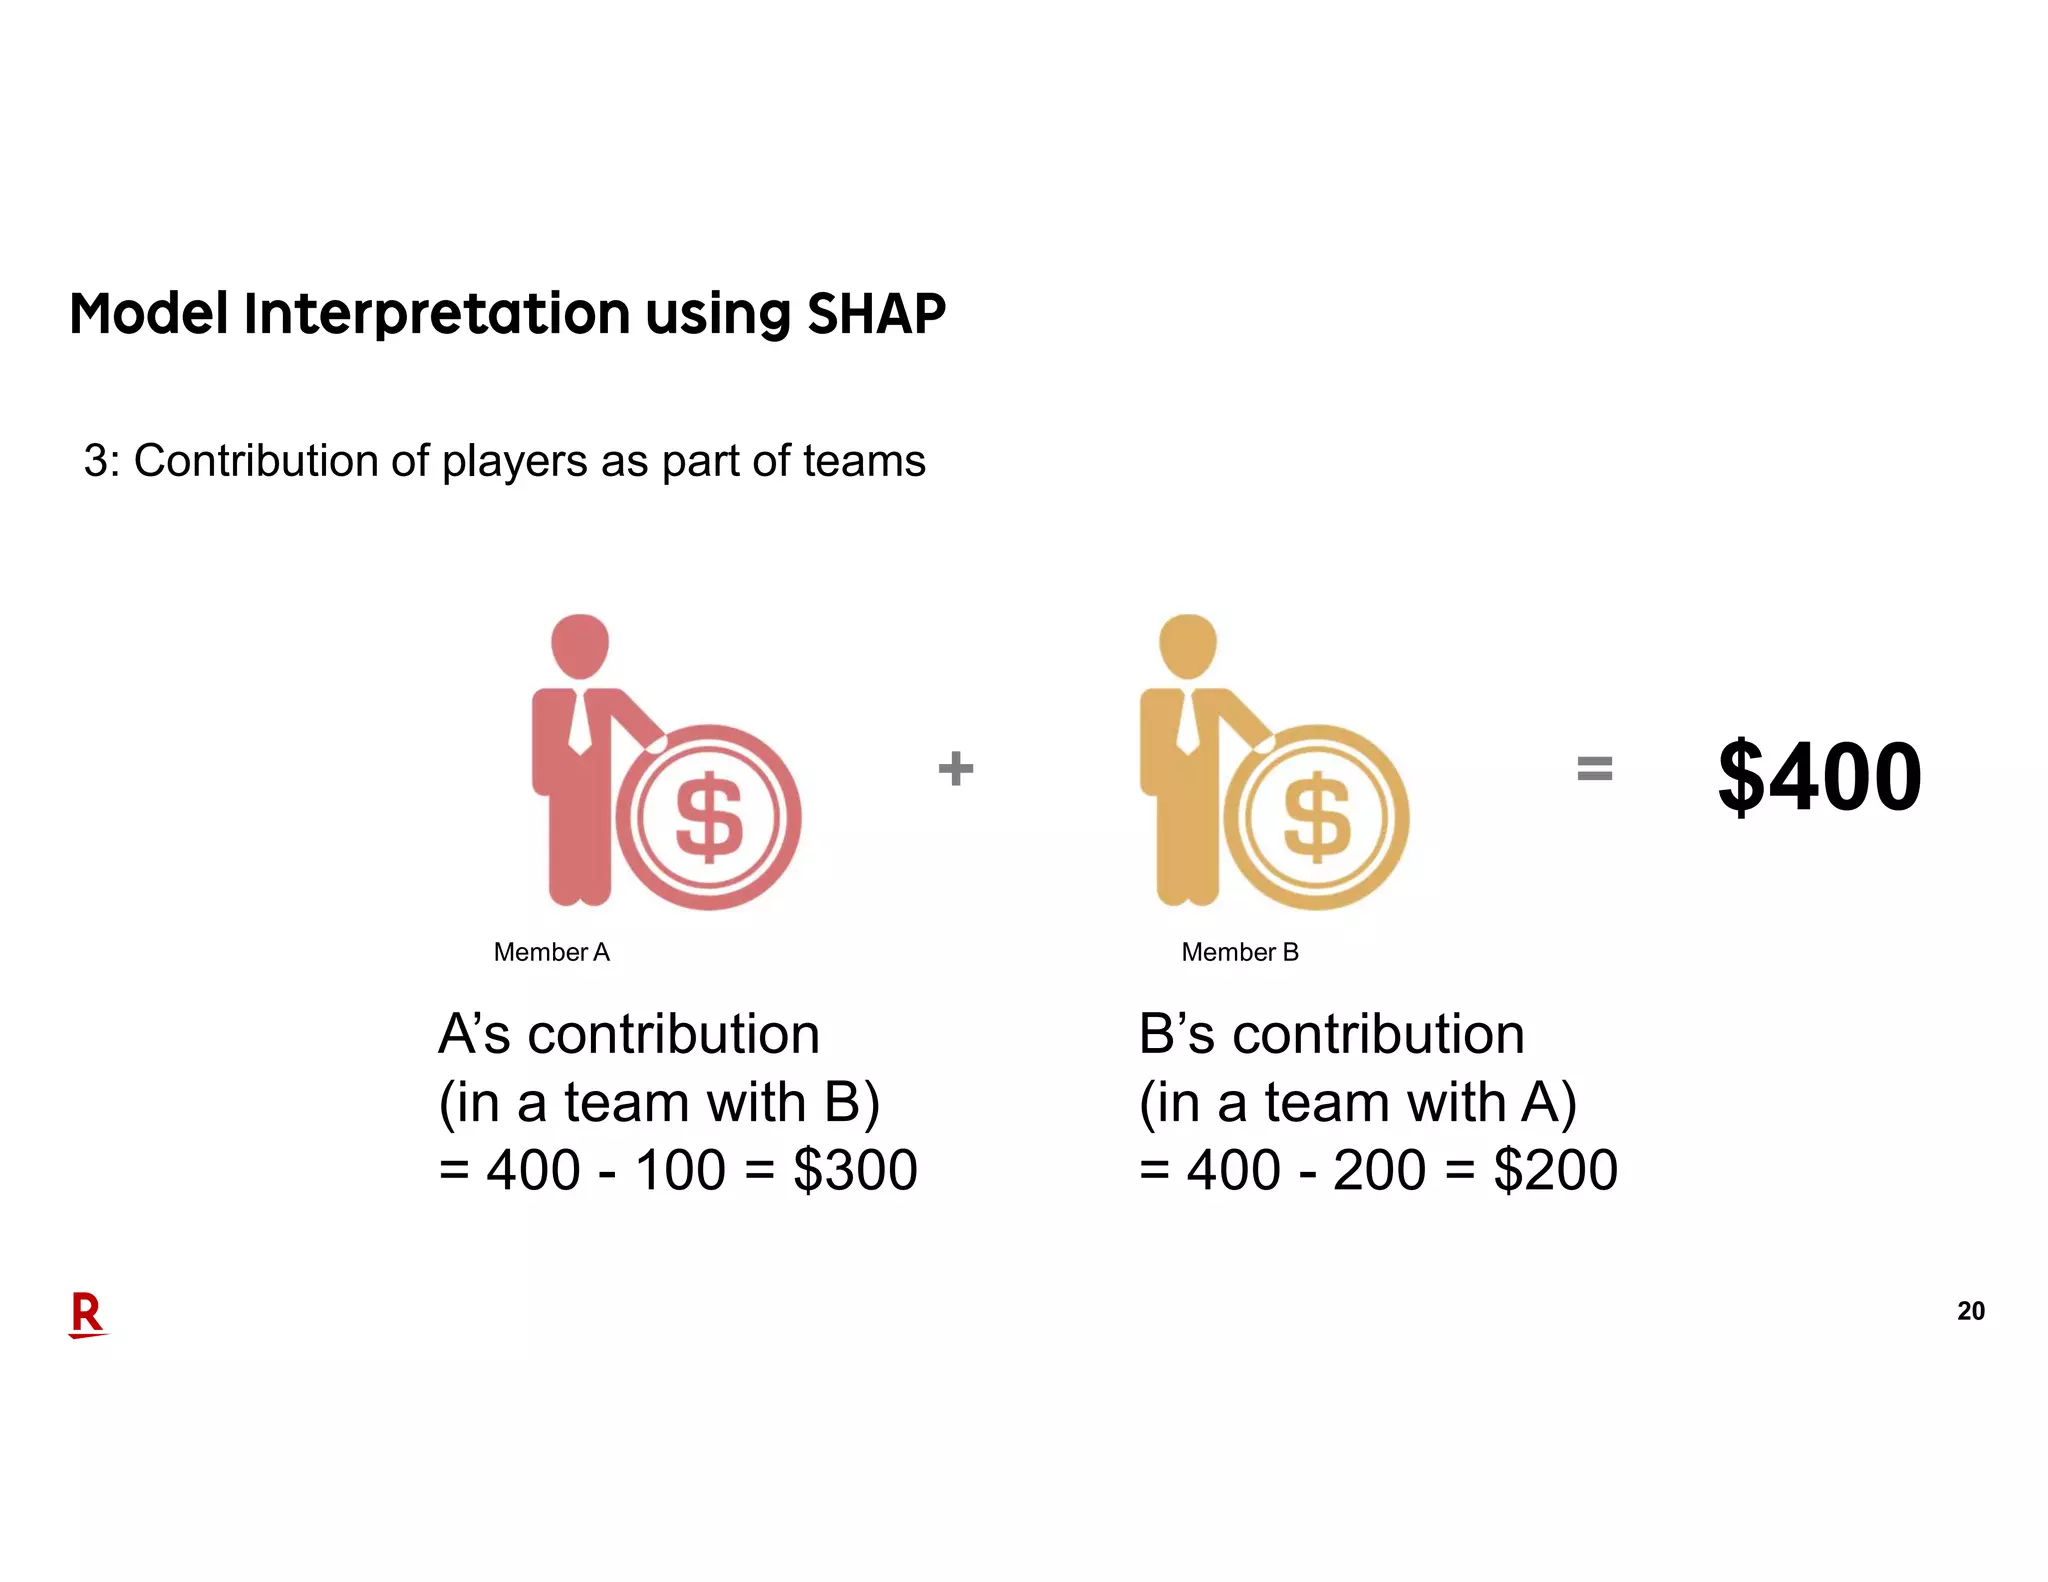
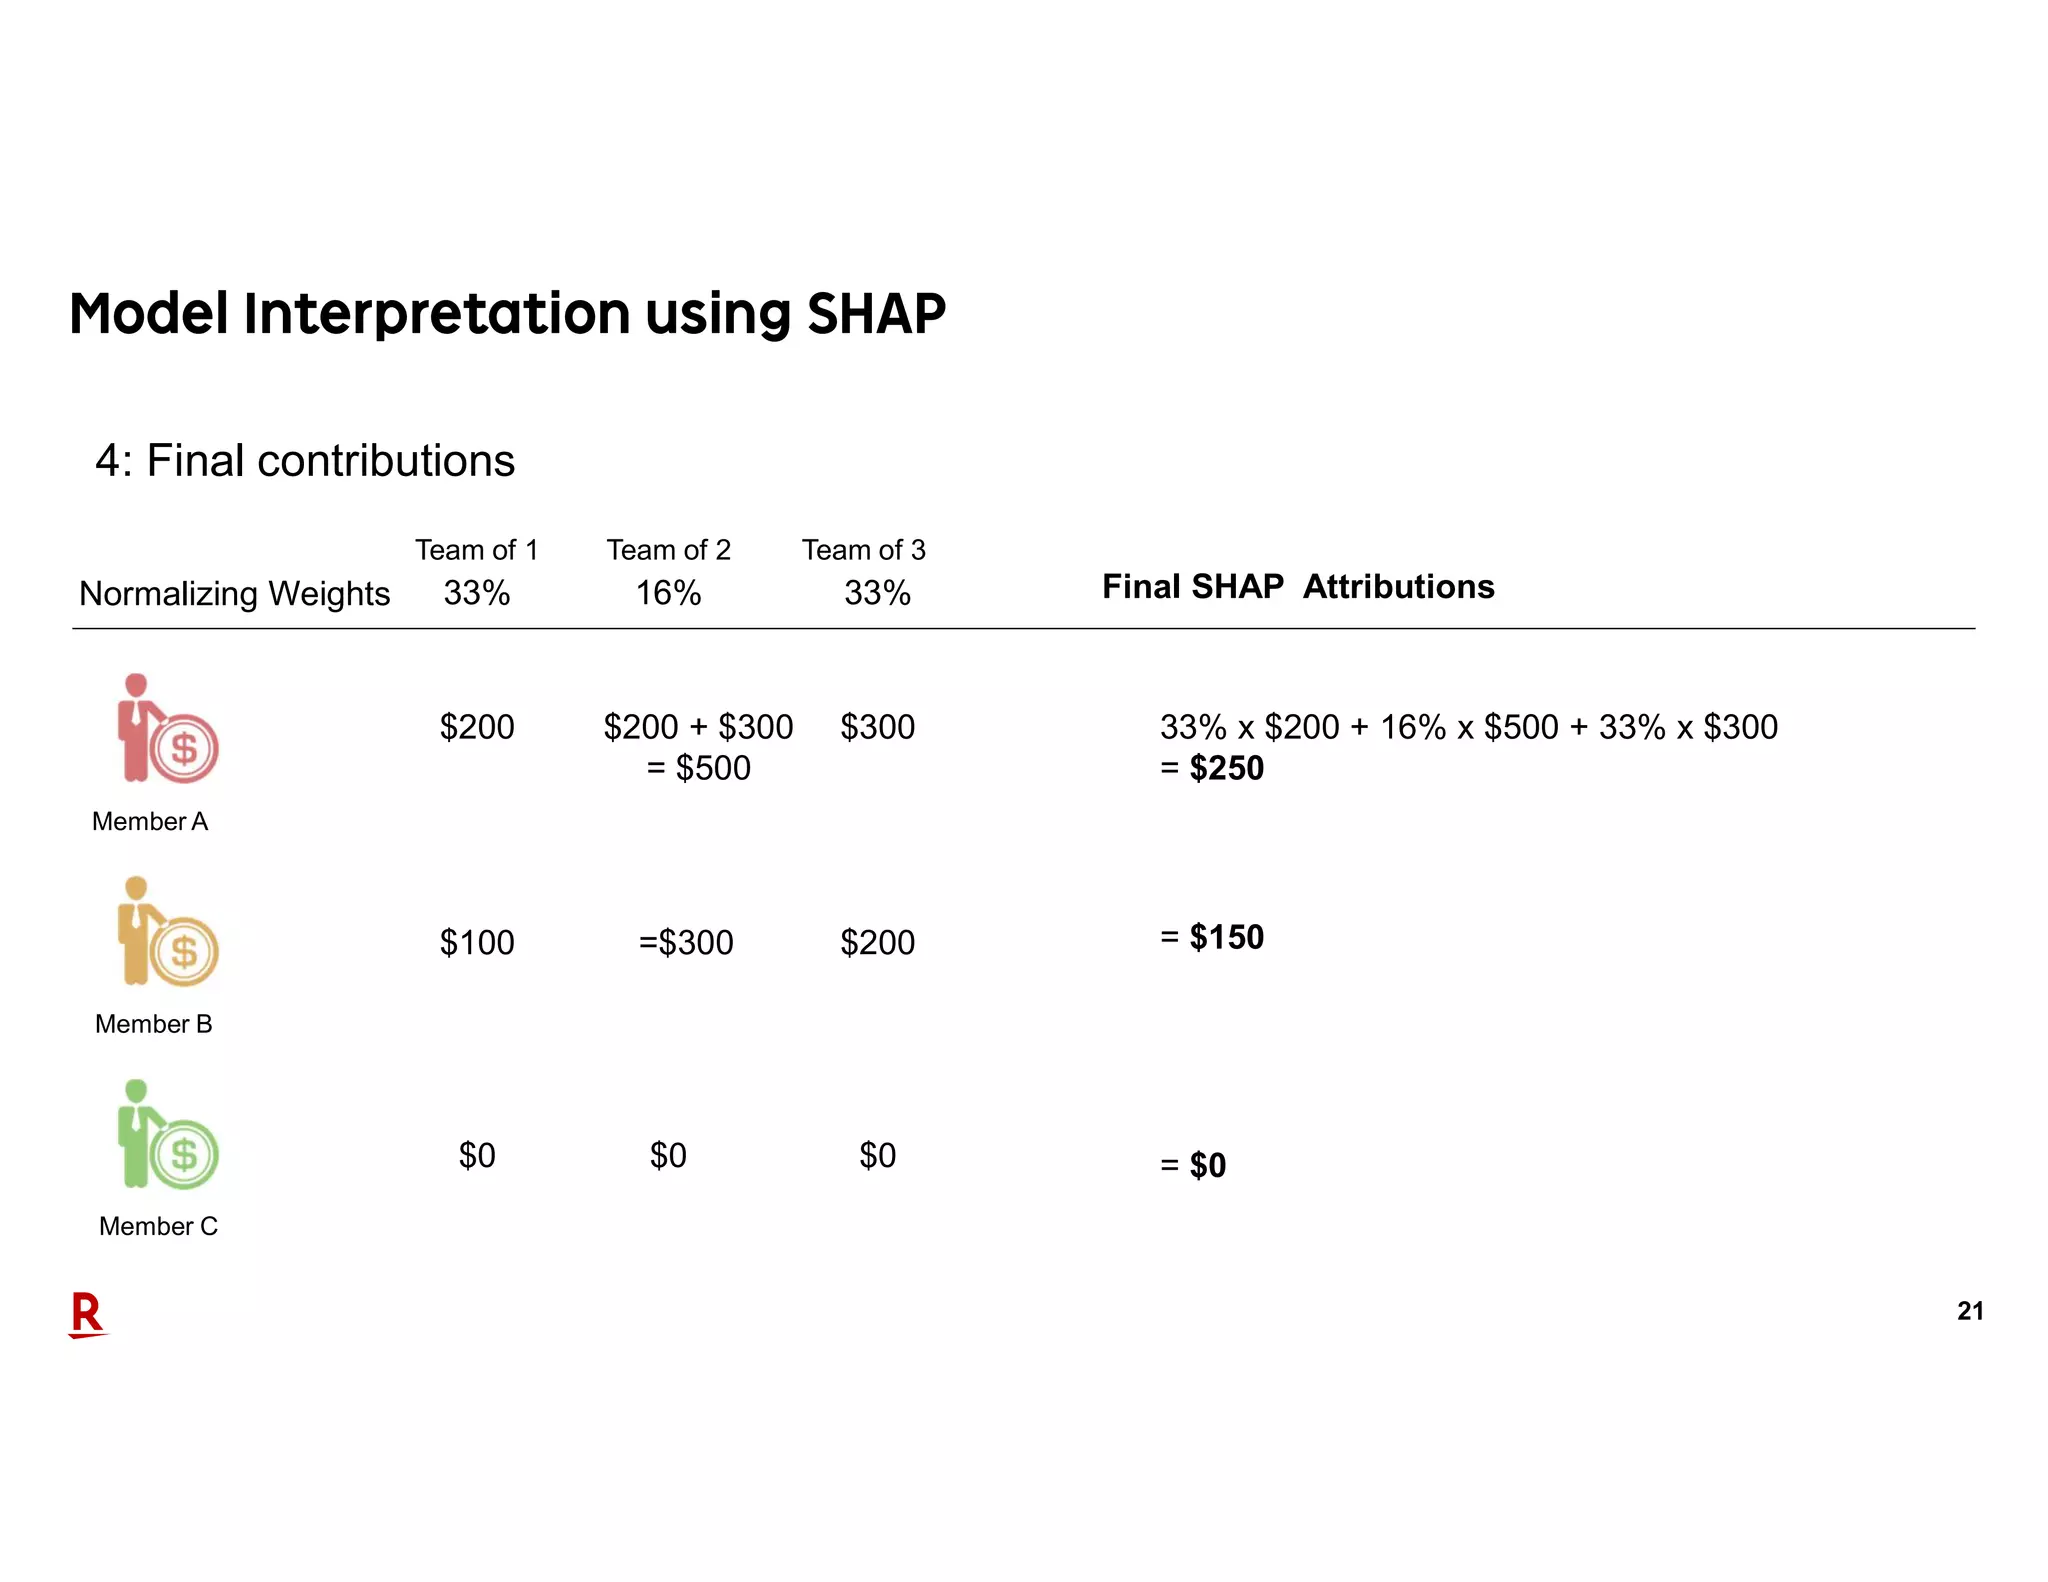
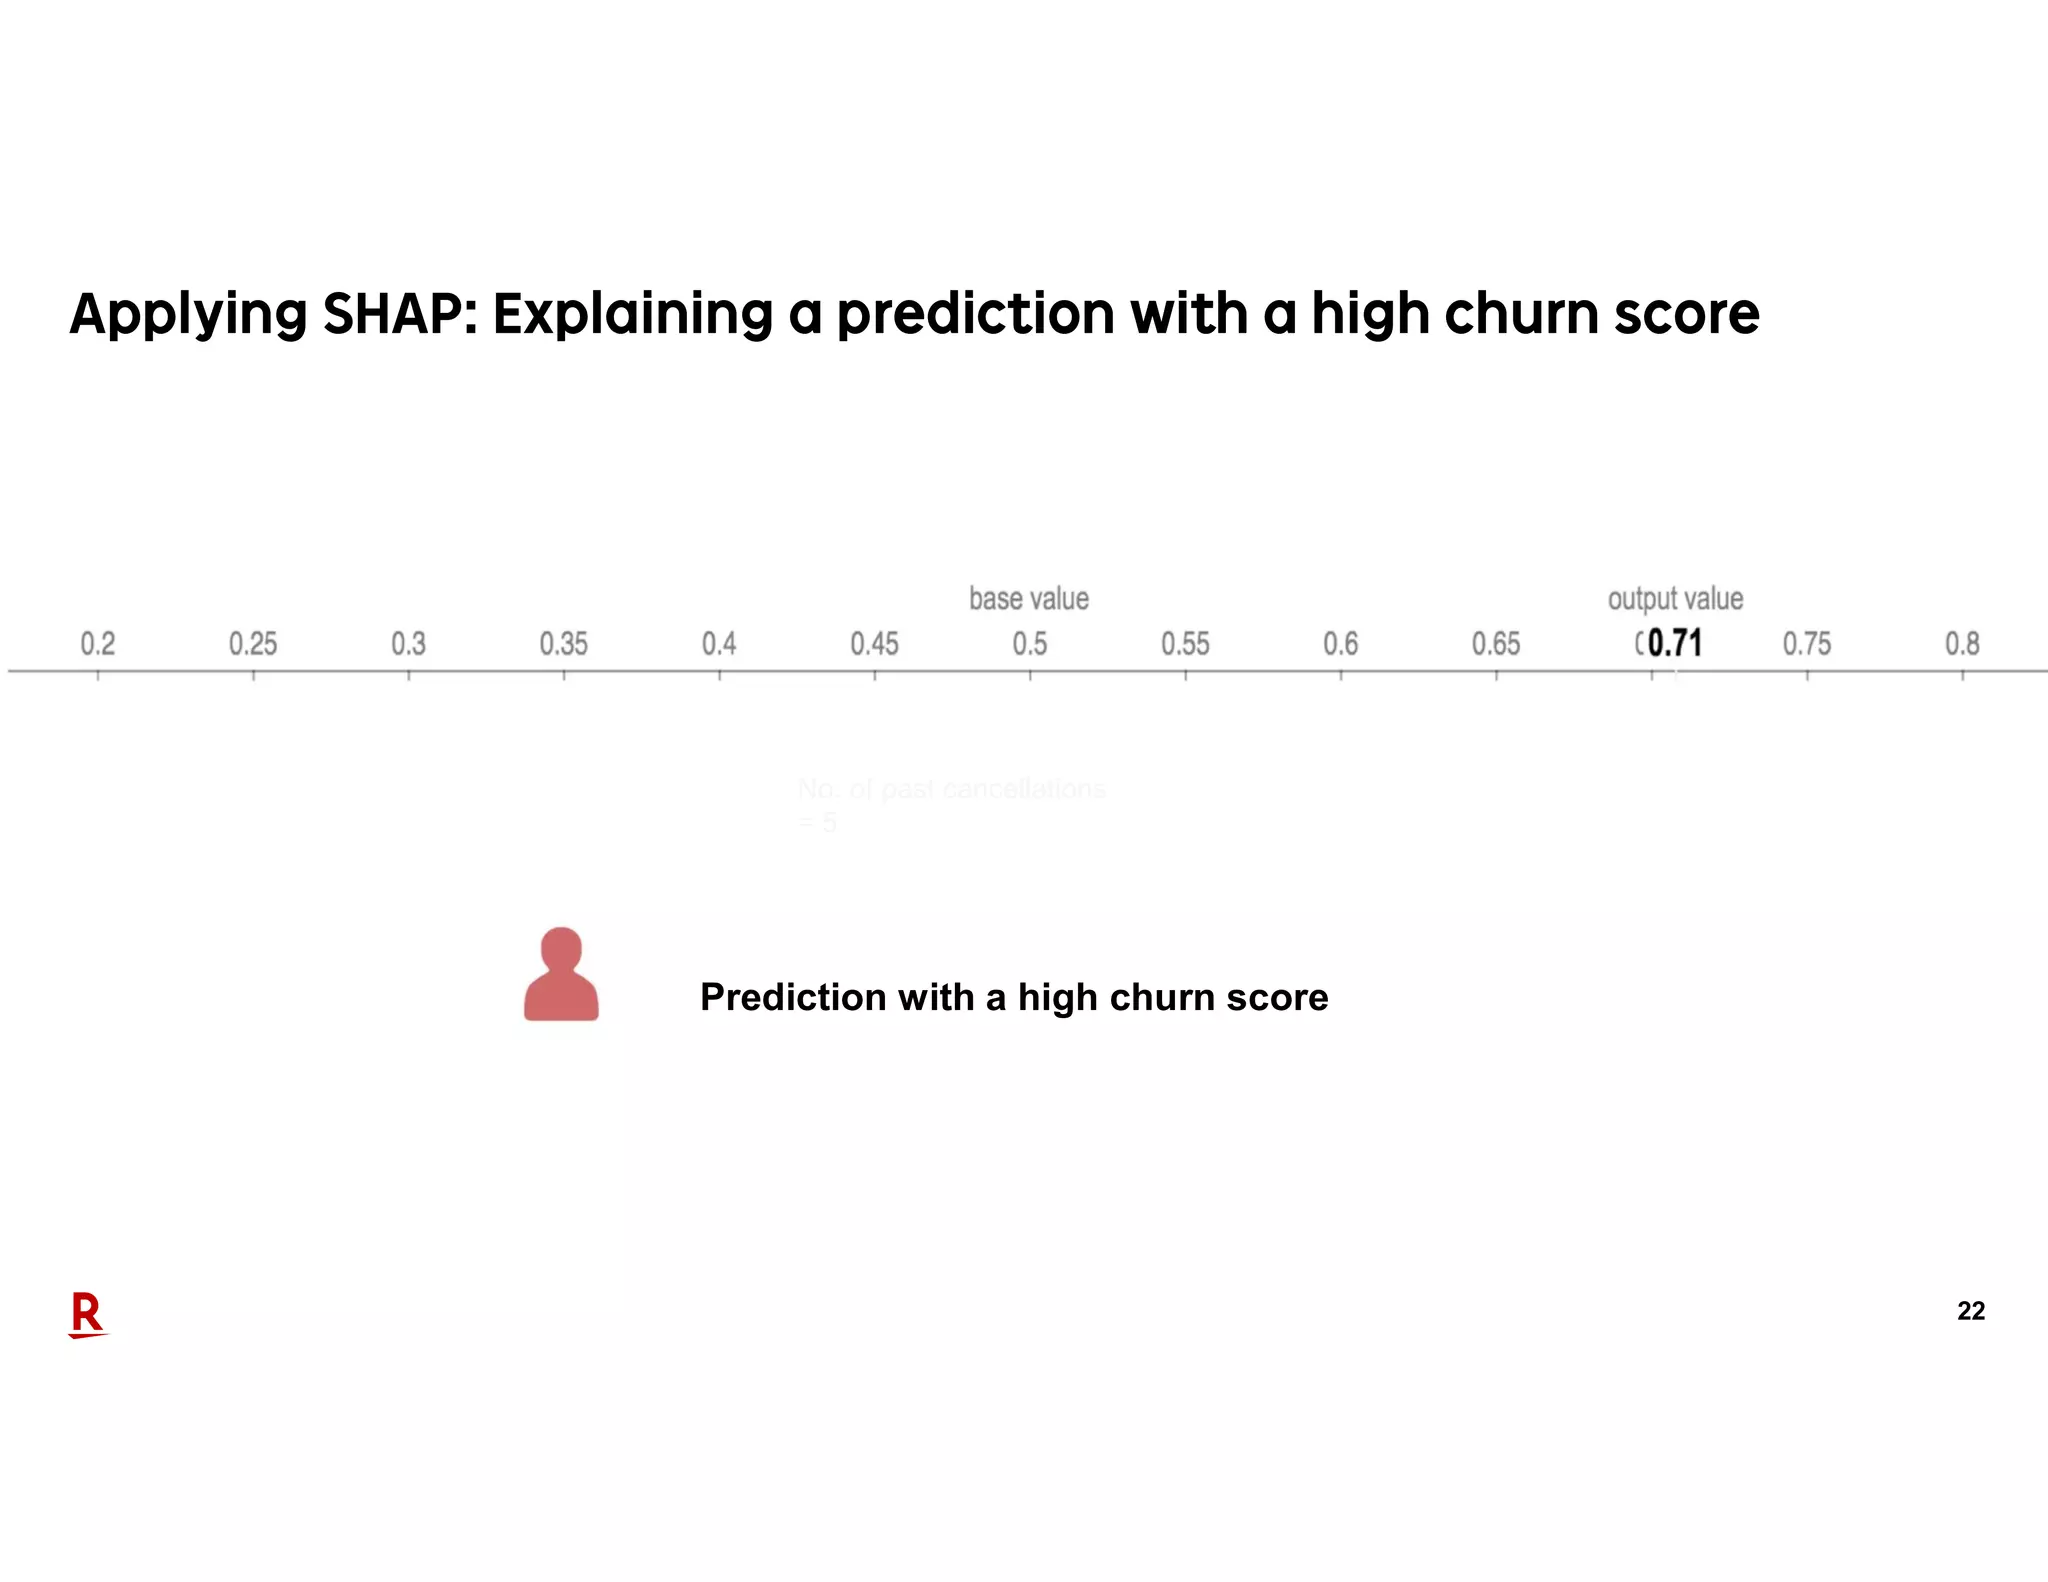
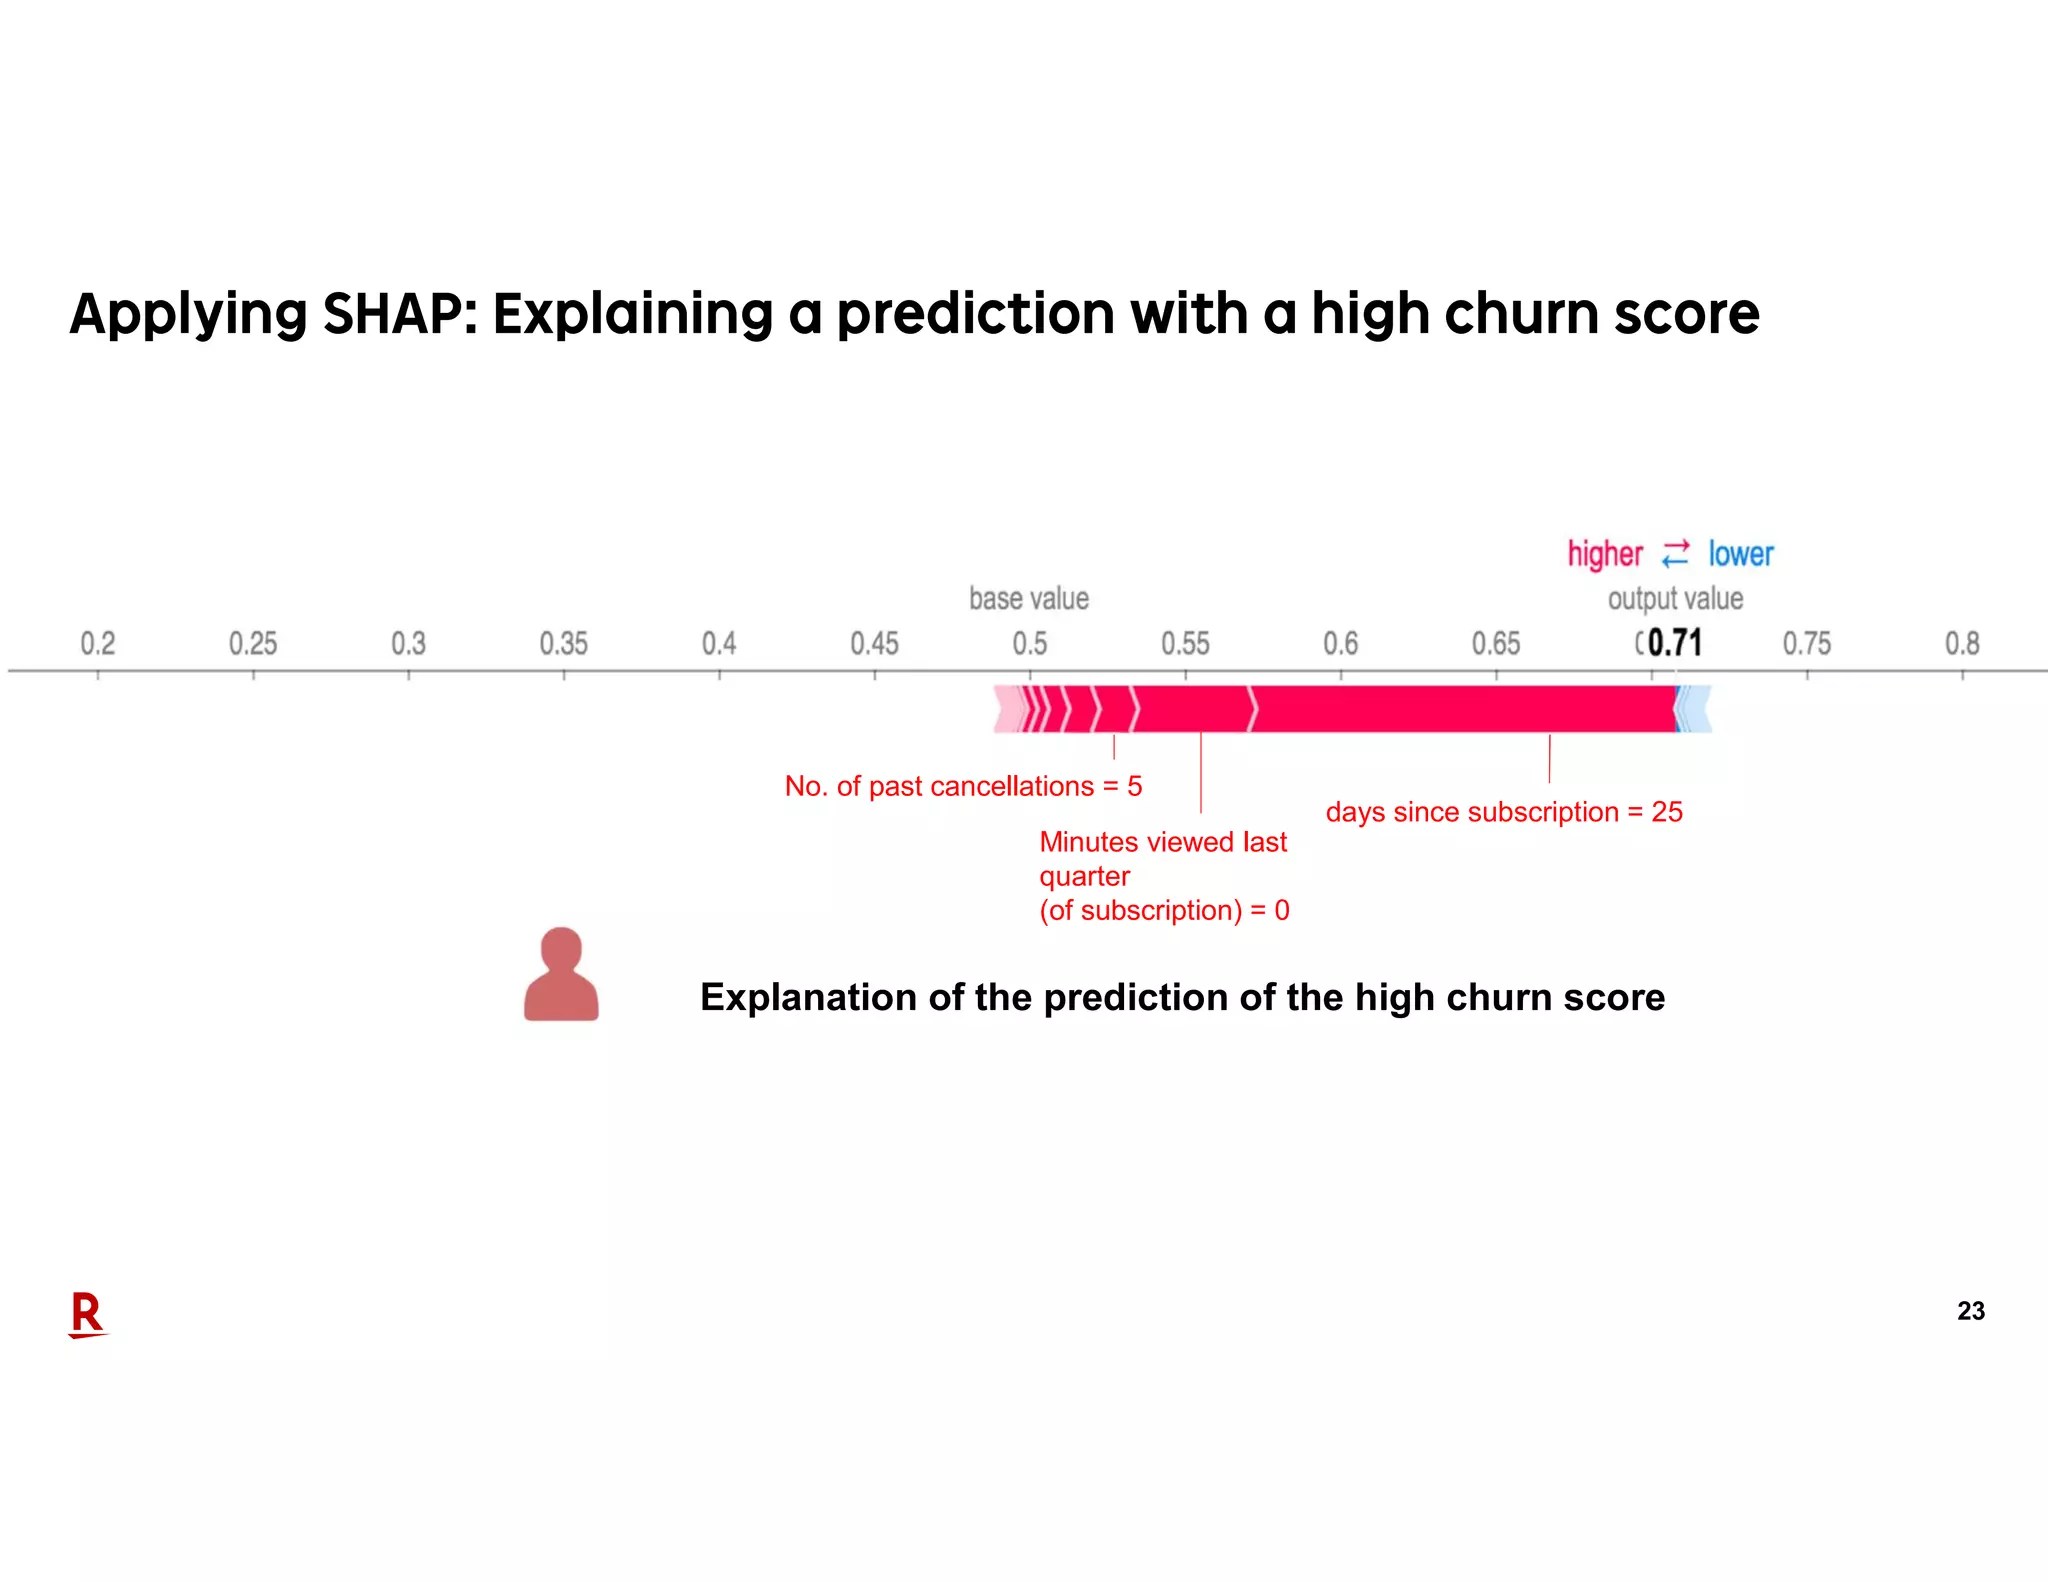
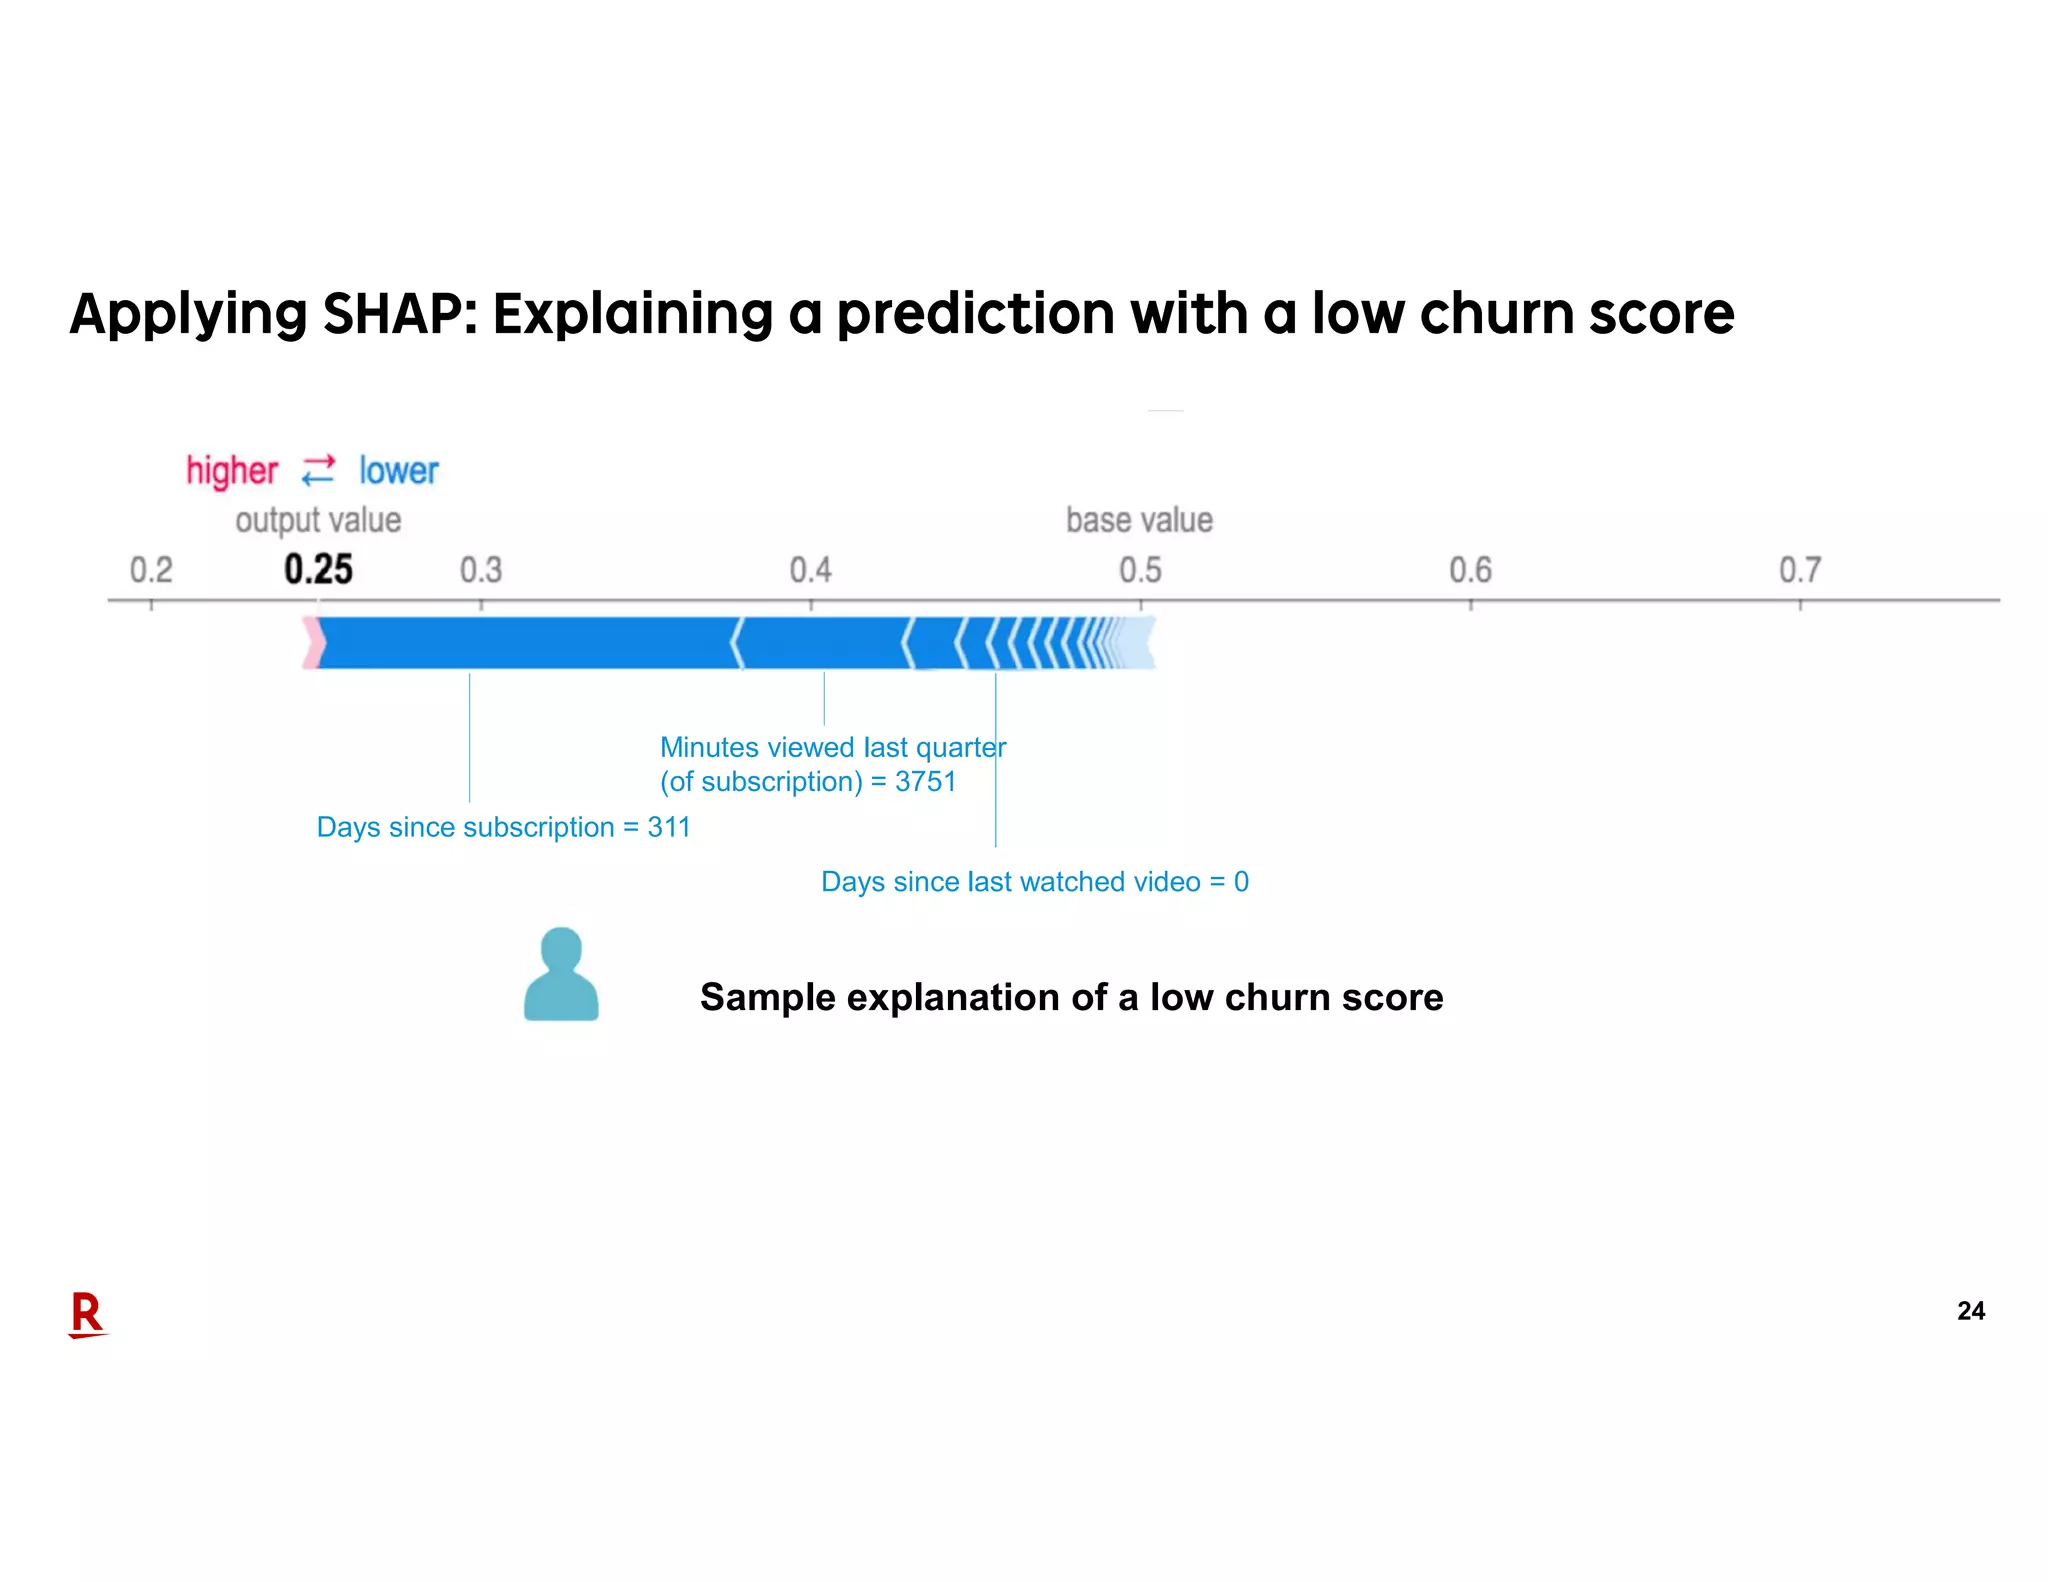
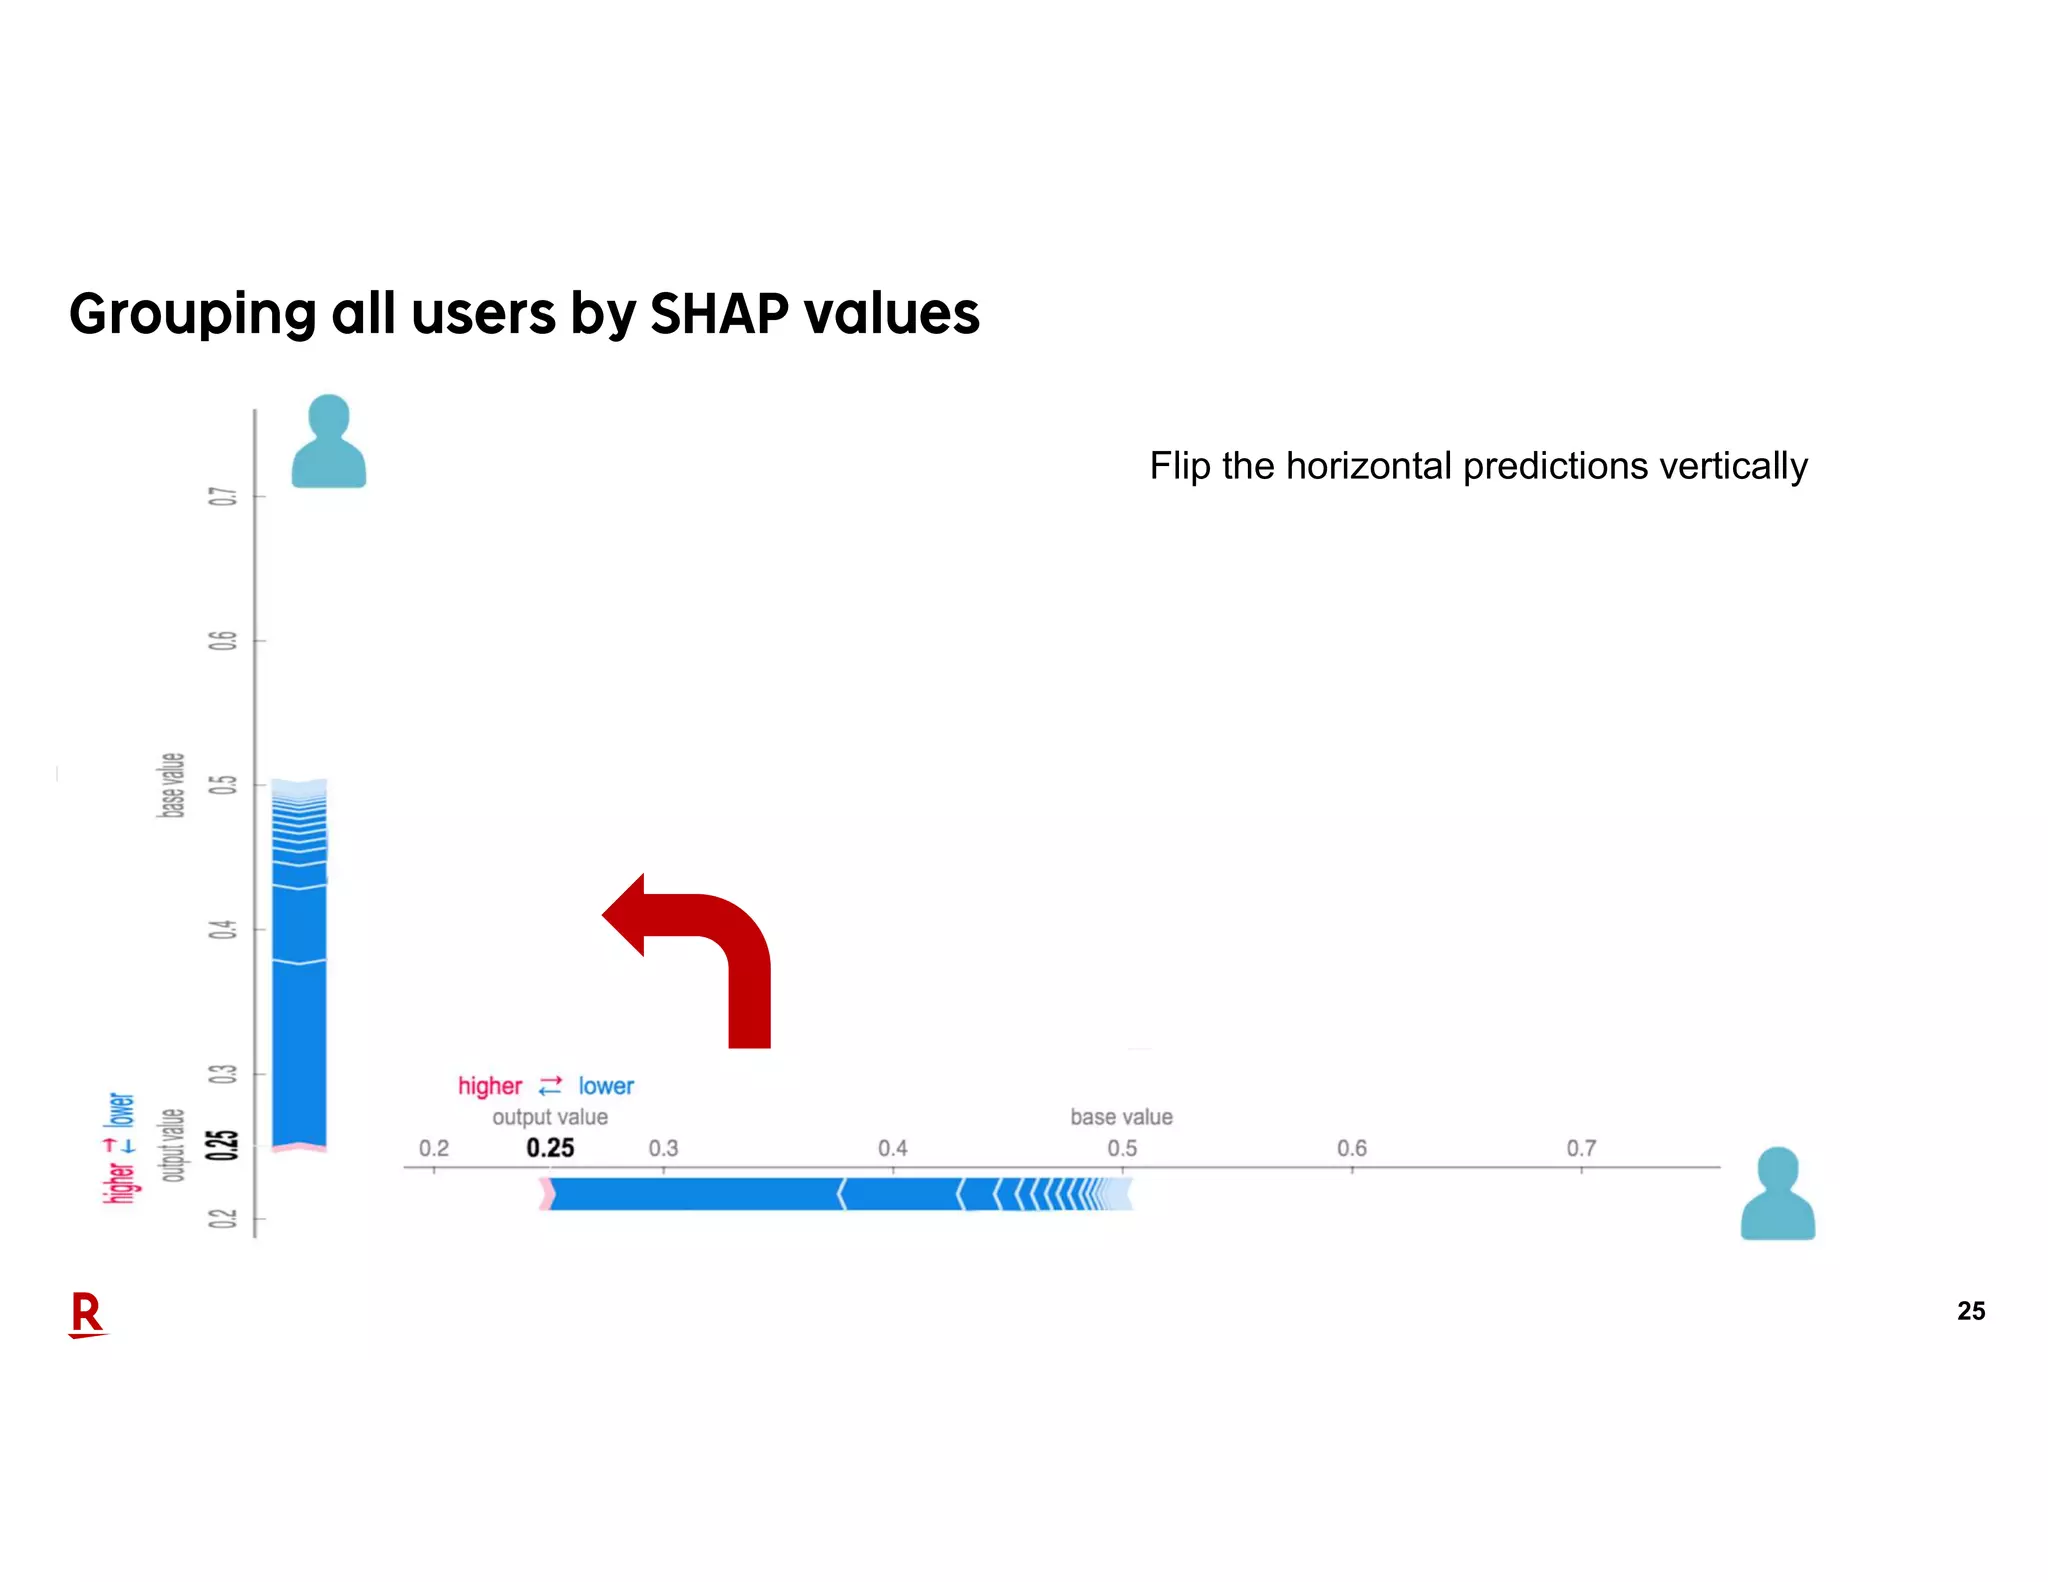
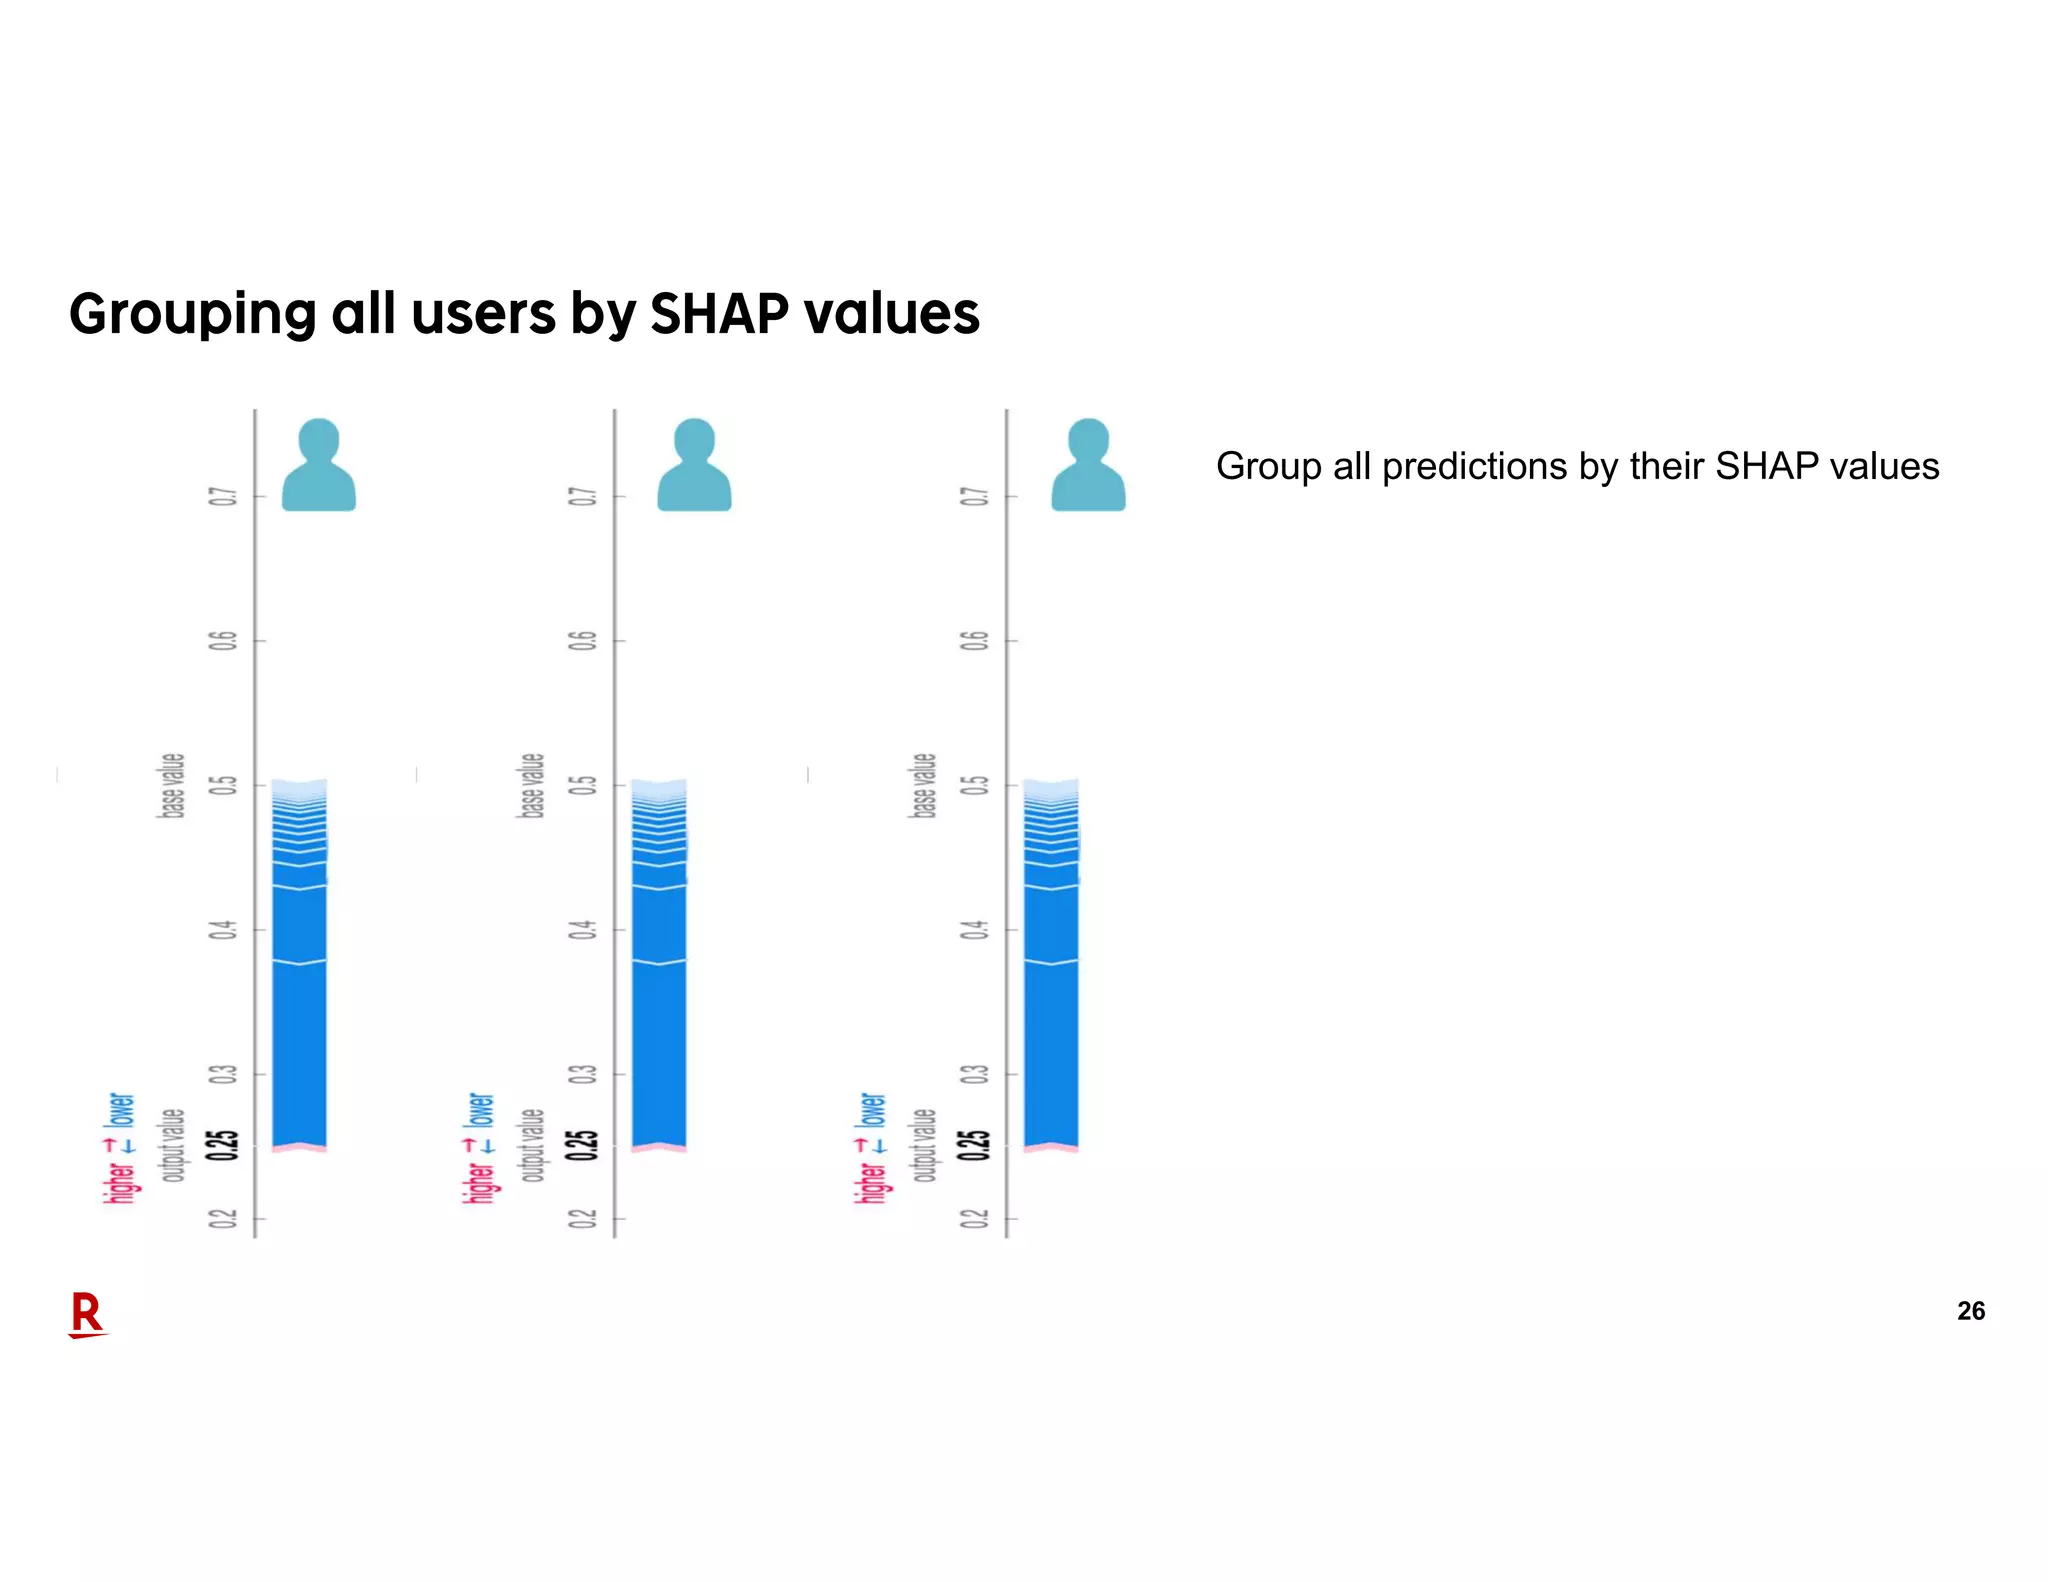
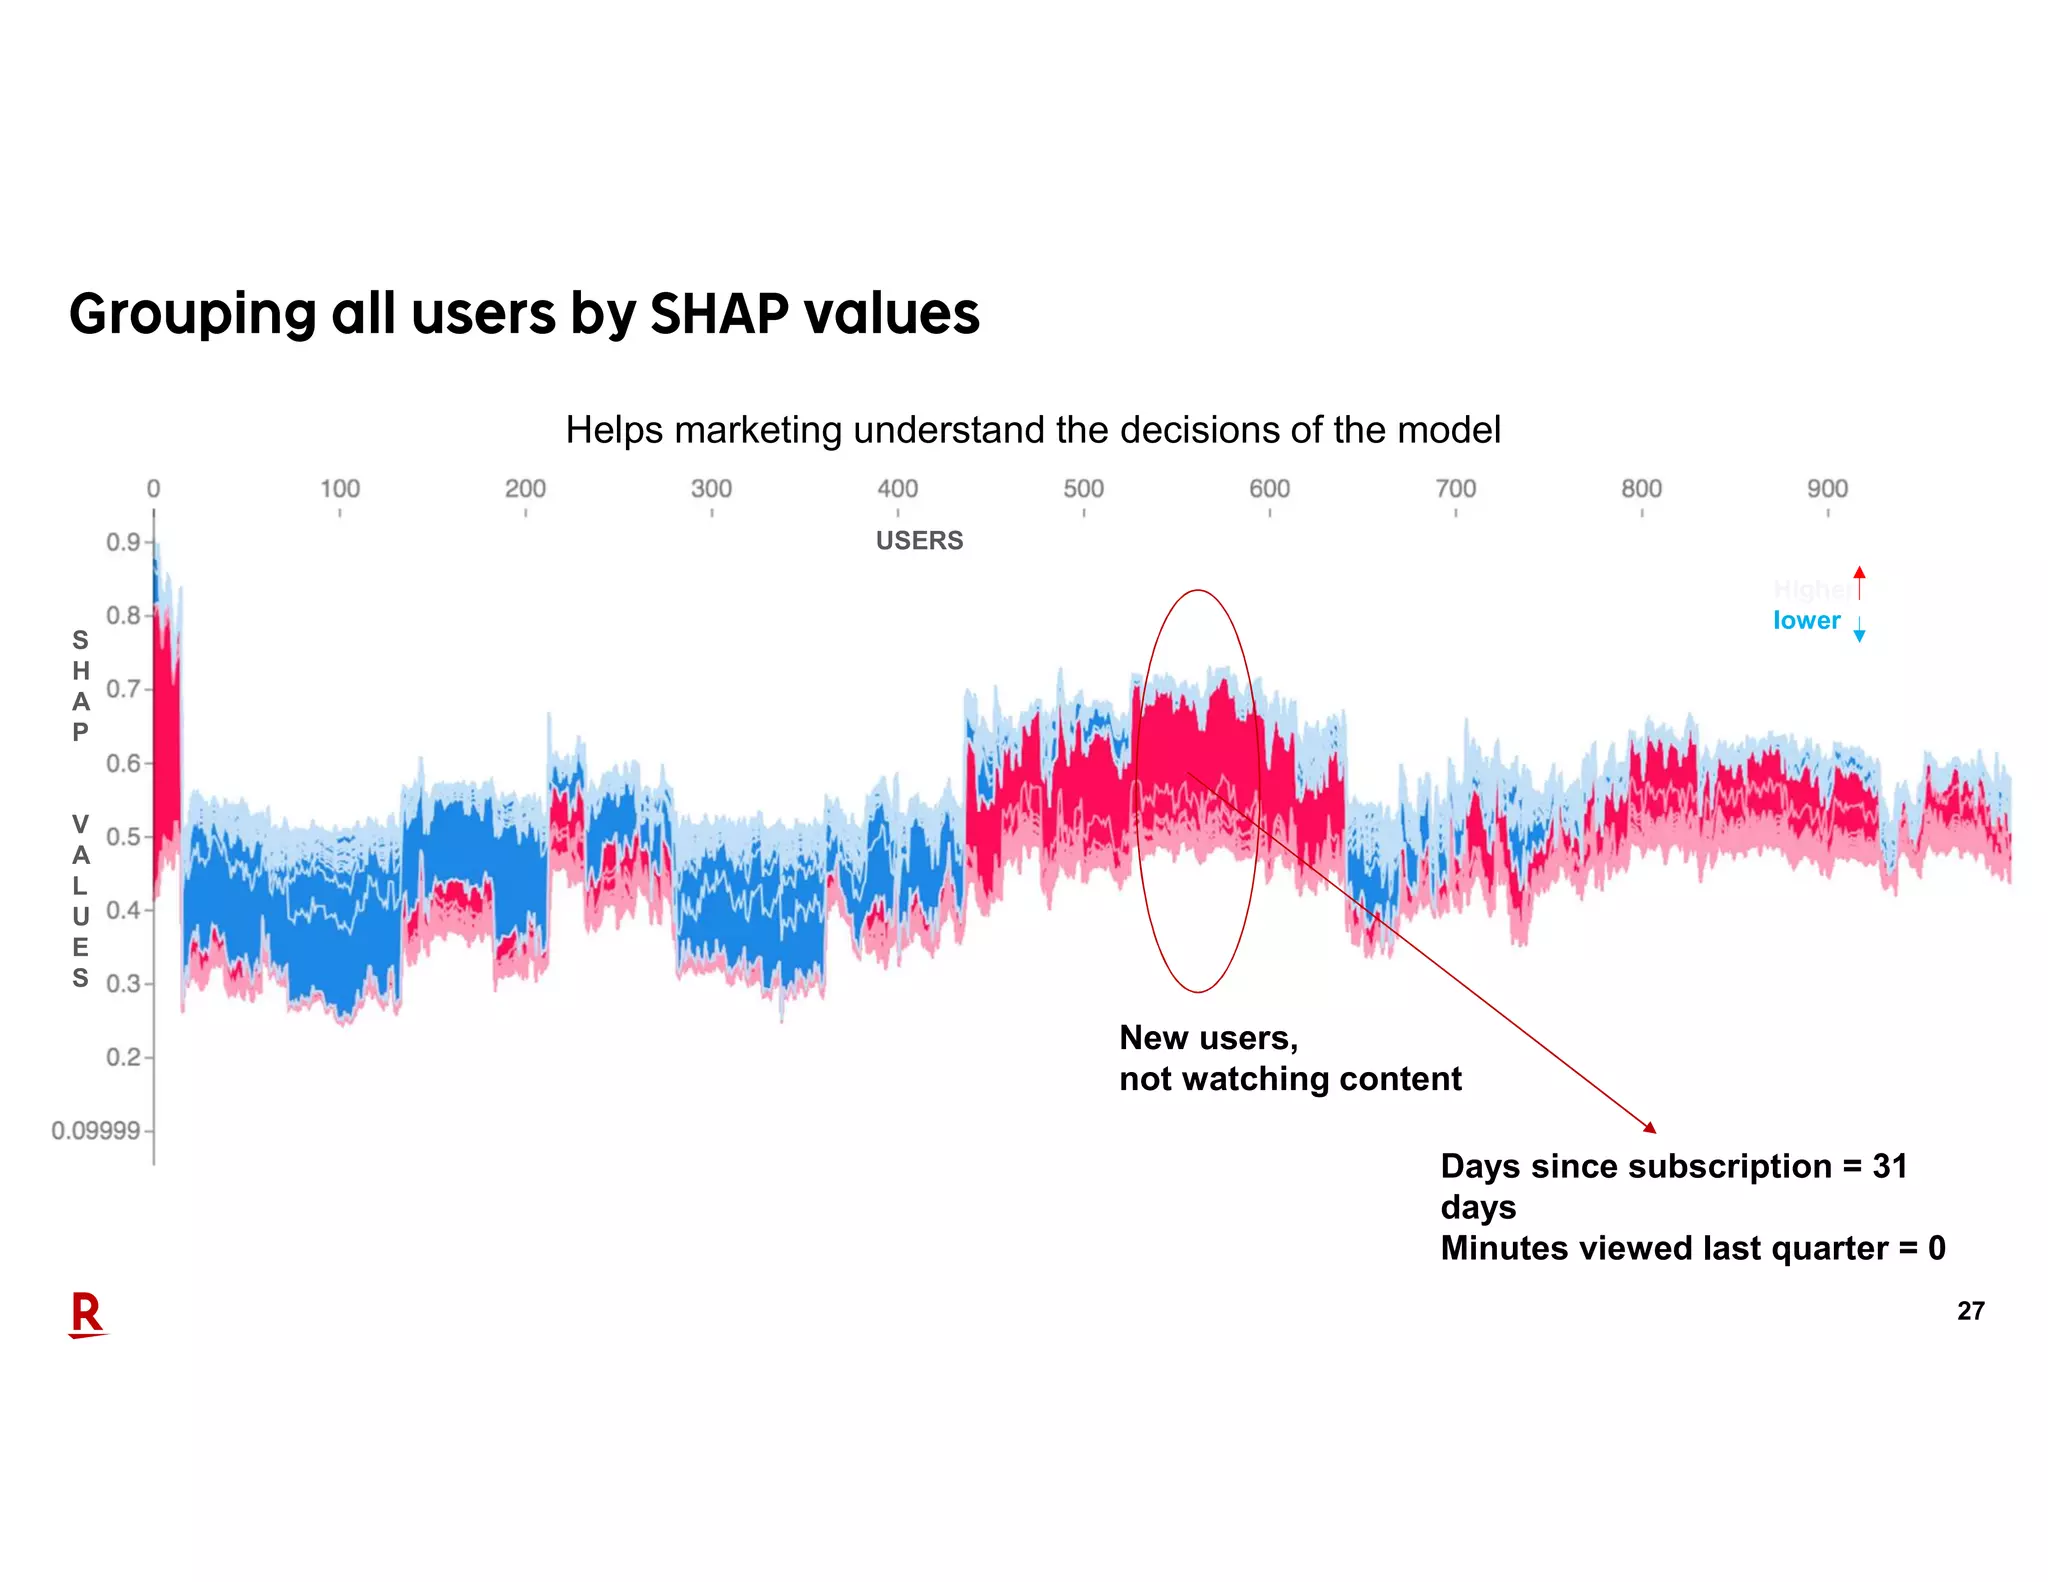
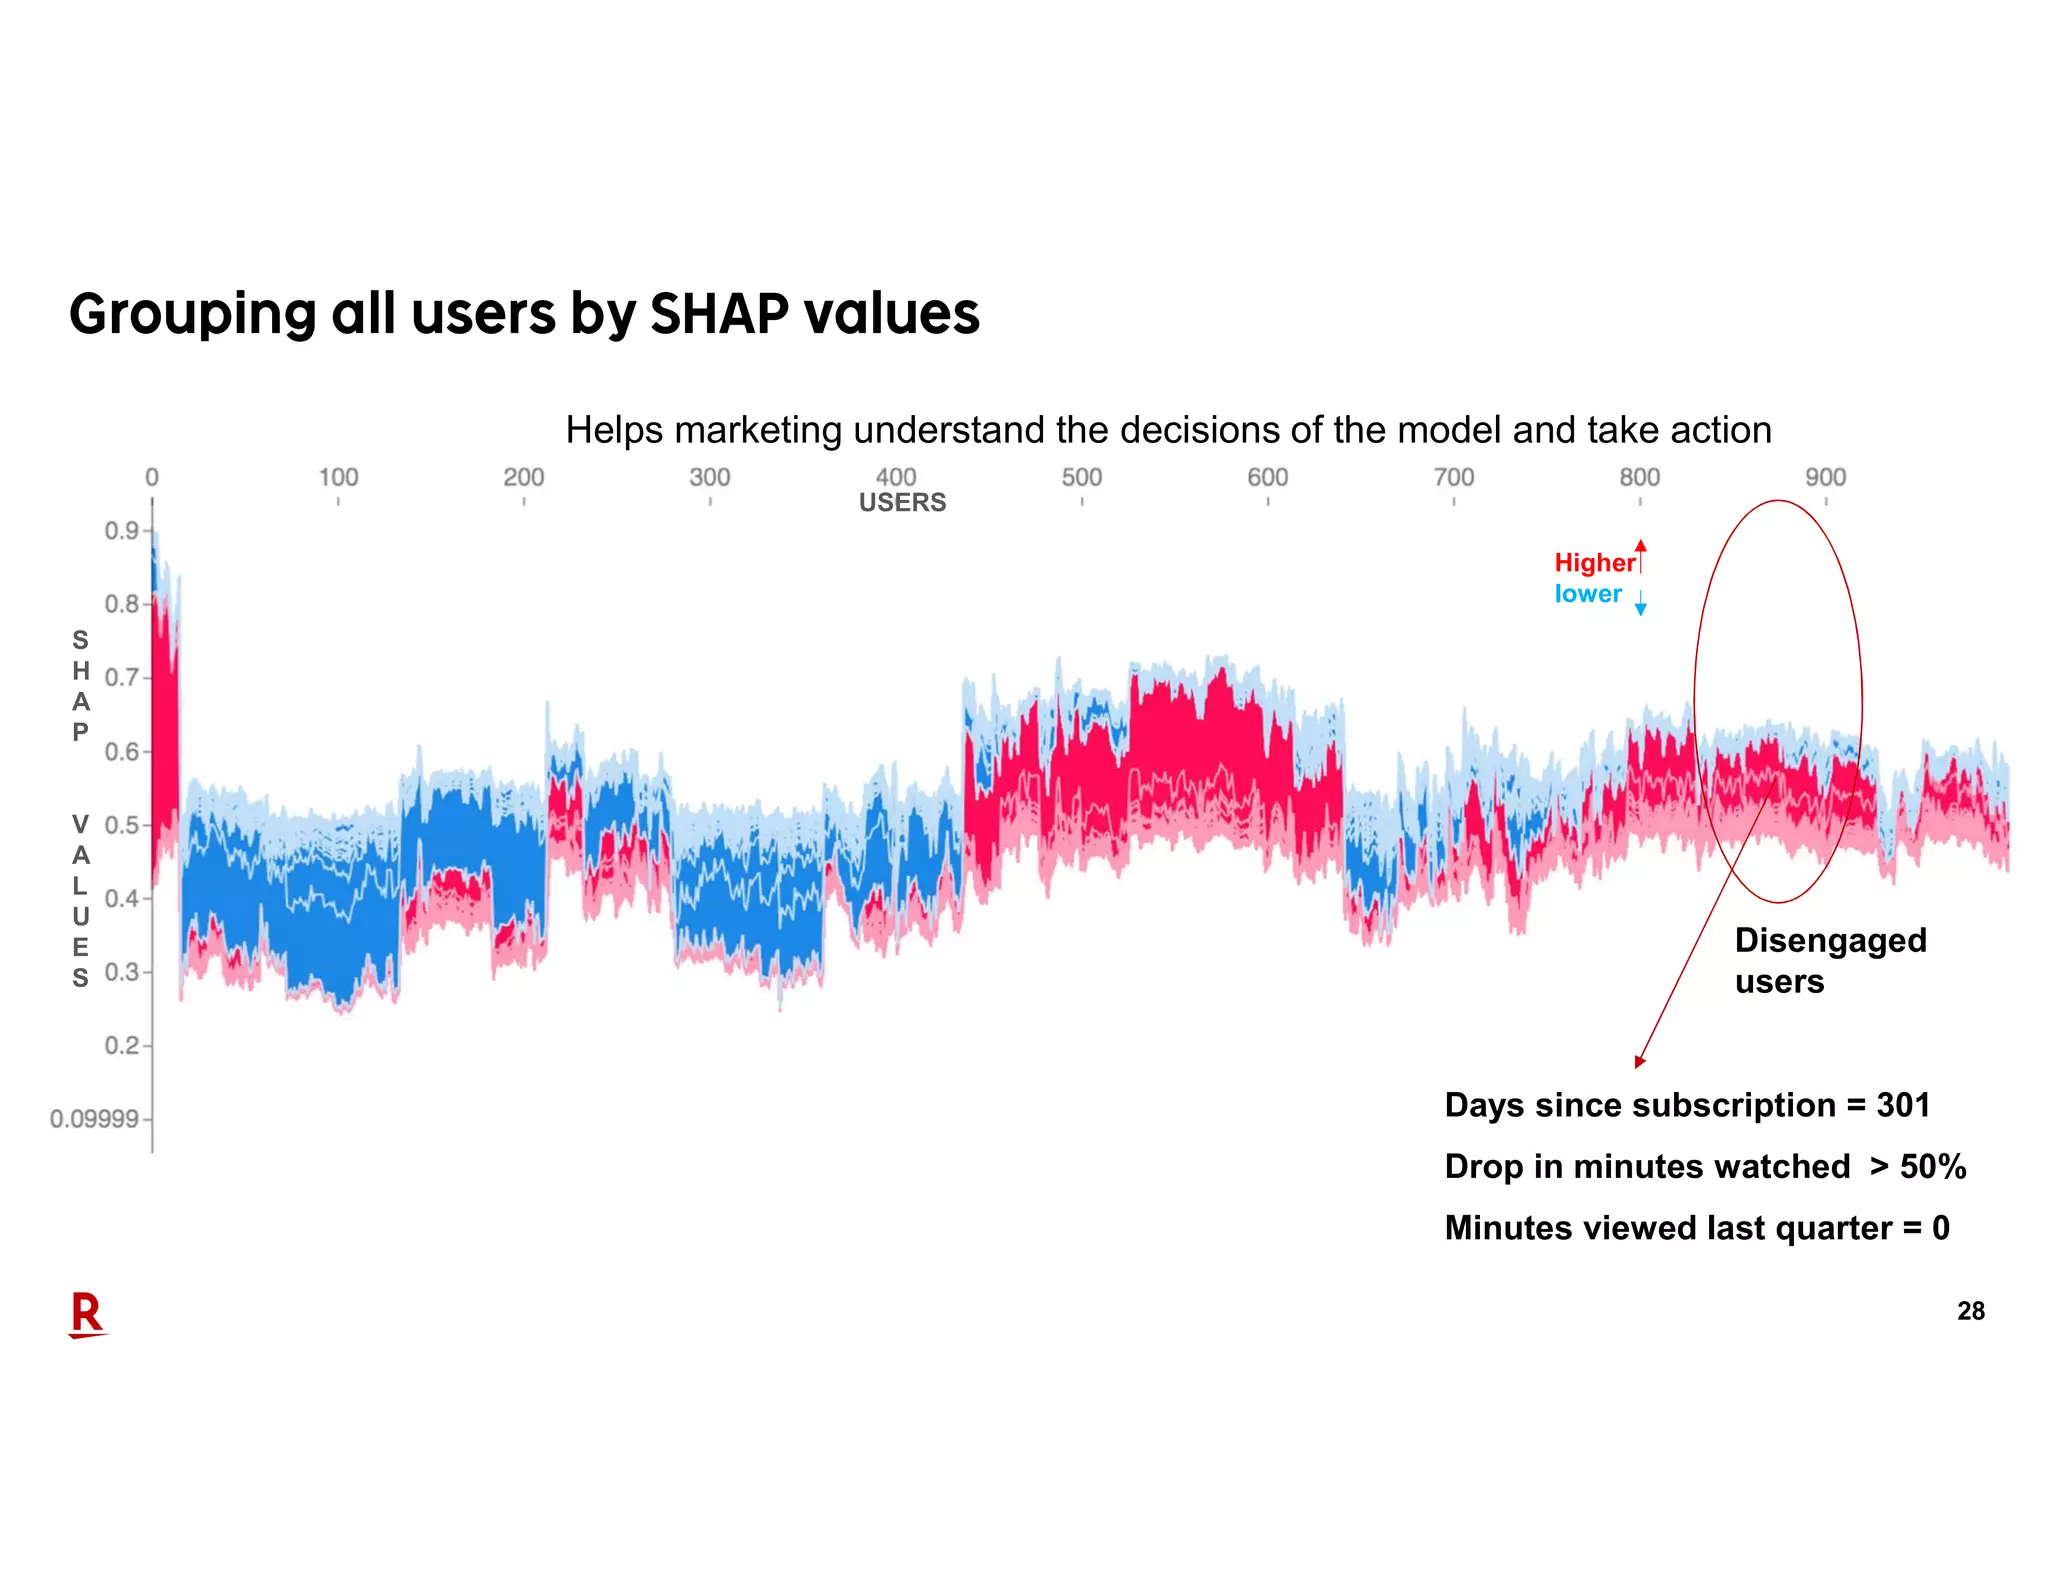
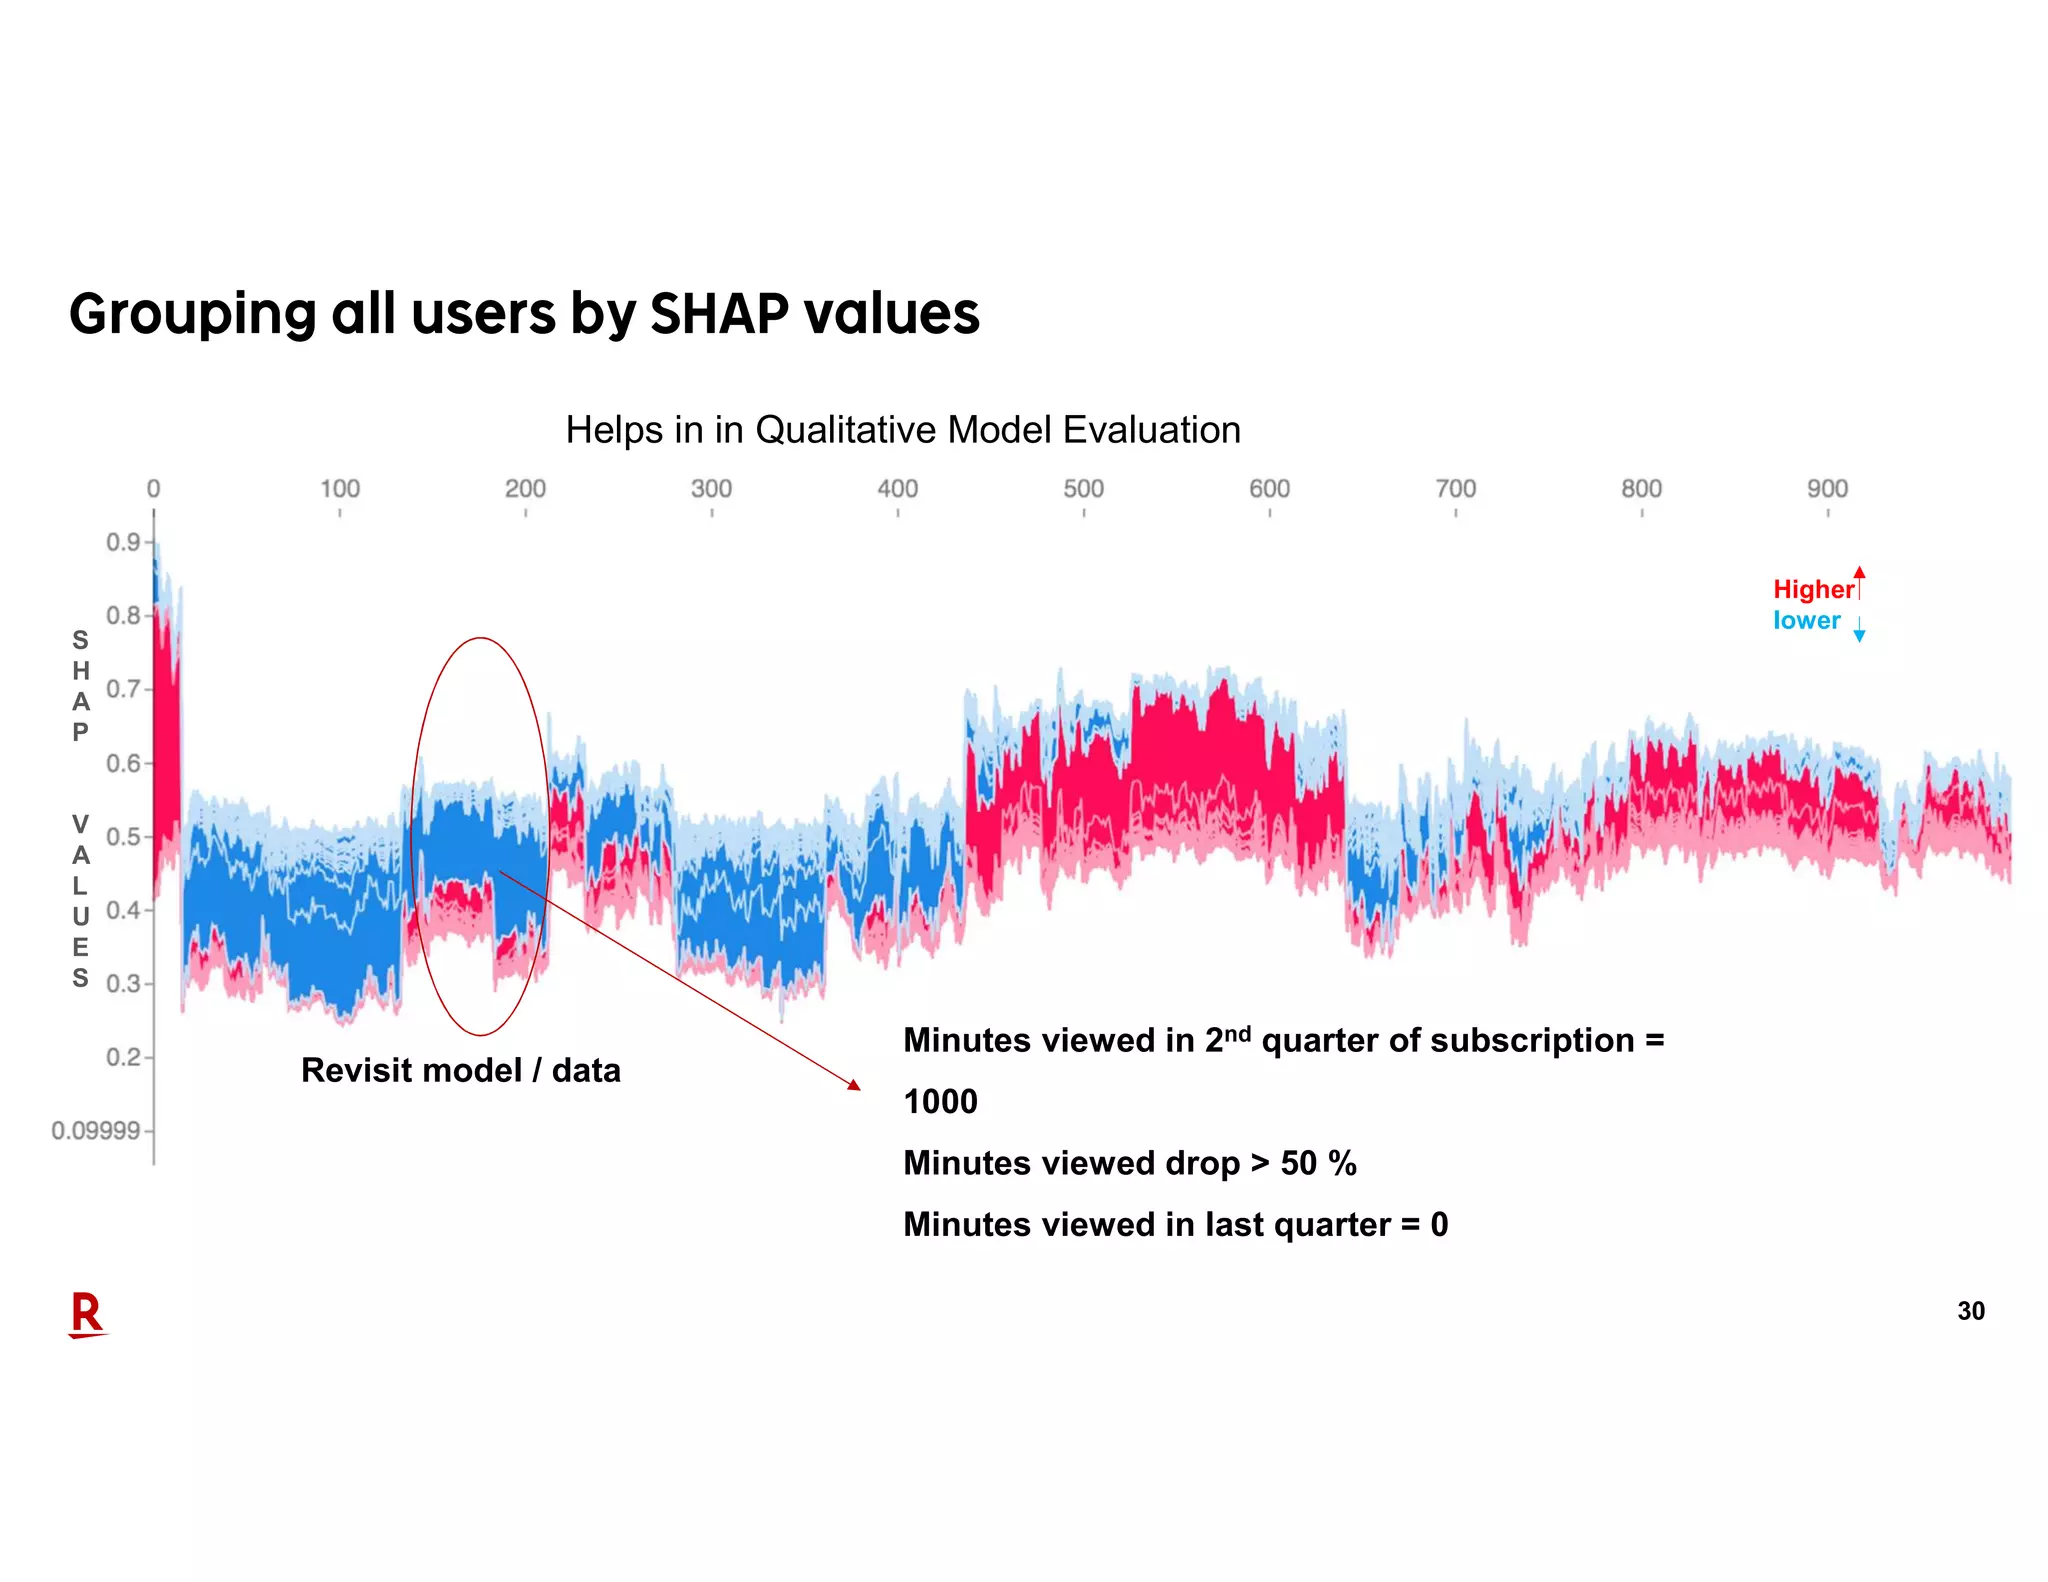
Oct 27, 2018
Akanksha Tiwari
Rakuten Institute of Technology
Singapore
2
I have built a model to predict which customer will cancel their subscription
..why is marketing not using it?
1. Marketing team will not use the model if they don’t know what action to take
on the predictions and why
2. Data Scientists can use model interpretation to help marketing team take
action
Video streaming platform that
streams Asian content.
4
Customers pay monthly
subscription fee to watch
content
Customers cancel
subscription and leave
+ $ - $
CHURN
5
…
Yes, sure.
That sounds
exciting
Management
Why don't we
start using AI to
identify which
customers will
churn next
month ?
Marketing
6
…
Yes, sure.
That sounds
exciting
Management
Why don't we
start using AI to
identify which
customers will
churn next
month ?
Marketing
Can you help
identify customers
who will churn next
month?
Data Scientist
7
…
Sure. I can use
past data to build
a model to predict
who will churn in
the next month.
Data Scientist
8
…
FEATURES
Video Viewing
Behavior
Click Stream
Behavior
Subscription
Behavior
Train the model on past
subscribers
Predict the probability to
churn in the next month
Model Outperforms vendor’s model
9
…
Data Scientist
10
…
If client is unable to action on predictions then the model will not be used
How should the output of the
model be used ? Given the
high risk churners what should
I do and why?
Marketing
11
Customer Probability to churn
X 0.27
Y 0.86
Z 0.82
CHURN MODEL PREDICTIONS
12
Customer Probability to churn Reason for prediction
X 0.27 Used service for more than year, Actively watching content
Y 0.86 New User, Cancelled in the past
Z 0.82
Used service for more than year, Lost Interest
CHURN MODEL PREDICTIONS EXPLANATION
13
MODEL INTERPRETATION
Model Interpretation of a machine learning model is how humans can
understand the choices made by the model in the decision making process
MODEL PREDICTIONS EXPLANATION
14
15
*(see the SHAP NIPS paper for details).
SHAP*:
• Latest work on model interpretation
• Explains the output of any machine learning model.
• Connects game theory with model explanations
• Unifies several previous methods (such as LIME, DeepLift)
16
Member A
What is an individual’s contribution in the team?
Team makes $400 profits
Member B Member C
17
Mapping teams to model prediction (Example)
Team Members  Features used for a prediction
Team sales  Prediction Score
Member A
Member A
Member A
$400 0.78
Days since subscription
Minutes Viewed
Number of past subscriptions
18
1: Calculate Normalizing Weights for all sub-sizes of teams
Team Size Normalizing Weight* Team Permutations
1
2
3
33%
16%
33% *Normalizing Weight = m! x (n-m-1)! / n!
n = size of original team
m = size of team player get’s added to
19
2: Contribution when each member is working alone
$200 $100 $0
Member A Member B Member C
20
3: Contribution of players as part of teams
B’s contribution
(in a team with A)
= 400 - 200 = $200
A’s contribution
(in a team with B)
= 400 - 100 = $300
+ = $400
Member A Member B
21
4: Final contributions
Final SHAP AttributionsNormalizing Weights
Team of 1
$200
$100
$0
33% 16% 33%
$200 + $300
= $500
=$300
$0
$300
$200
$0
Team of 2 Team of 3
33% x $200 + 16% x $500 + 33% x $300
= $250
= $0
= $150
Member A
Member B
Member C
22
No. of past cancellations
= 5
Prediction with a high churn score
23
Explanation of the prediction of the high churn score
days since subscription = 25
Minutes viewed last
quarter
(of subscription) = 0
No. of past cancellations = 5
24
Days since subscription = 311
Minutes viewed last quarter
(of subscription) = 3751
Days since last watched video = 0
Sample explanation of a low churn score
25
Flip the horizontal predictions vertically
26
Group all predictions by their SHAP values
27
Days since subscription = 31
days
Minutes viewed last quarter = 0
New users,
not watching content
Higher
lower
S
H
A
P
V
A
L
U
E
S
USERS
Helps marketing understand the decisions of the model
28
Disengaged
users
Higher
lower
Days since subscription = 301
Drop in minutes watched > 50%
Minutes viewed last quarter = 0
USERS
S
H
A
P
V
A
L
U
E
S
Helps marketing understand the decisions of the model and take action
29
Marketing Planning a campaign for disengaged users using content recommendation
Acquisition Date: 24th Sep 2018
30
Revisit model / data
Higher
lower
Minutes viewed in 2nd quarter of subscription =
1000
Minutes viewed drop > 50 %
Minutes viewed in last quarter = 0
S
H
A
P
V
A
L
U
E
S
Helps in in Qualitative Model Evaluation
31
• Churn prediction is just one component of churn management
• Marketing will not use the model if they don’t know what action to take on the
predictions and why
• Use model interpretation to help marketing take action
Why is my machine learning  model not being used ?

Why is my machine learning model not being used ?

  • 1.
    Oct 27, 2018 AkankshaTiwari Rakuten Institute of Technology Singapore
  • 2.
    2 I have builta model to predict which customer will cancel their subscription ..why is marketing not using it? 1. Marketing team will not use the model if they don’t know what action to take on the predictions and why 2. Data Scientists can use model interpretation to help marketing team take action
  • 3.
    Video streaming platformthat streams Asian content.
  • 4.
    4 Customers pay monthly subscriptionfee to watch content Customers cancel subscription and leave + $ - $ CHURN
  • 5.
    5 … Yes, sure. That sounds exciting Management Whydon't we start using AI to identify which customers will churn next month ? Marketing
  • 6.
    6 … Yes, sure. That sounds exciting Management Whydon't we start using AI to identify which customers will churn next month ? Marketing Can you help identify customers who will churn next month? Data Scientist
  • 7.
    7 … Sure. I canuse past data to build a model to predict who will churn in the next month. Data Scientist
  • 8.
    8 … FEATURES Video Viewing Behavior Click Stream Behavior Subscription Behavior Trainthe model on past subscribers Predict the probability to churn in the next month Model Outperforms vendor’s model
  • 9.
  • 10.
    10 … If client isunable to action on predictions then the model will not be used How should the output of the model be used ? Given the high risk churners what should I do and why? Marketing
  • 11.
    11 Customer Probability tochurn X 0.27 Y 0.86 Z 0.82 CHURN MODEL PREDICTIONS
  • 12.
    12 Customer Probability tochurn Reason for prediction X 0.27 Used service for more than year, Actively watching content Y 0.86 New User, Cancelled in the past Z 0.82 Used service for more than year, Lost Interest CHURN MODEL PREDICTIONS EXPLANATION
  • 13.
    13 MODEL INTERPRETATION Model Interpretationof a machine learning model is how humans can understand the choices made by the model in the decision making process MODEL PREDICTIONS EXPLANATION
  • 14.
  • 15.
    15 *(see the SHAPNIPS paper for details). SHAP*: • Latest work on model interpretation • Explains the output of any machine learning model. • Connects game theory with model explanations • Unifies several previous methods (such as LIME, DeepLift)
  • 16.
    16 Member A What isan individual’s contribution in the team? Team makes $400 profits Member B Member C
  • 17.
    17 Mapping teams tomodel prediction (Example) Team Members  Features used for a prediction Team sales  Prediction Score Member A Member A Member A $400 0.78 Days since subscription Minutes Viewed Number of past subscriptions
  • 18.
    18 1: Calculate NormalizingWeights for all sub-sizes of teams Team Size Normalizing Weight* Team Permutations 1 2 3 33% 16% 33% *Normalizing Weight = m! x (n-m-1)! / n! n = size of original team m = size of team player get’s added to
  • 19.
    19 2: Contribution wheneach member is working alone $200 $100 $0 Member A Member B Member C
  • 20.
    20 3: Contribution ofplayers as part of teams B’s contribution (in a team with A) = 400 - 200 = $200 A’s contribution (in a team with B) = 400 - 100 = $300 + = $400 Member A Member B
  • 21.
    21 4: Final contributions FinalSHAP AttributionsNormalizing Weights Team of 1 $200 $100 $0 33% 16% 33% $200 + $300 = $500 =$300 $0 $300 $200 $0 Team of 2 Team of 3 33% x $200 + 16% x $500 + 33% x $300 = $250 = $0 = $150 Member A Member B Member C
  • 22.
    22 No. of pastcancellations = 5 Prediction with a high churn score
  • 23.
    23 Explanation of theprediction of the high churn score days since subscription = 25 Minutes viewed last quarter (of subscription) = 0 No. of past cancellations = 5
  • 24.
    24 Days since subscription= 311 Minutes viewed last quarter (of subscription) = 3751 Days since last watched video = 0 Sample explanation of a low churn score
  • 25.
    25 Flip the horizontalpredictions vertically
  • 26.
    26 Group all predictionsby their SHAP values
  • 27.
    27 Days since subscription= 31 days Minutes viewed last quarter = 0 New users, not watching content Higher lower S H A P V A L U E S USERS Helps marketing understand the decisions of the model
  • 28.
    28 Disengaged users Higher lower Days since subscription= 301 Drop in minutes watched > 50% Minutes viewed last quarter = 0 USERS S H A P V A L U E S Helps marketing understand the decisions of the model and take action
  • 29.
    29 Marketing Planning acampaign for disengaged users using content recommendation Acquisition Date: 24th Sep 2018
  • 30.
    30 Revisit model /data Higher lower Minutes viewed in 2nd quarter of subscription = 1000 Minutes viewed drop > 50 % Minutes viewed in last quarter = 0 S H A P V A L U E S Helps in in Qualitative Model Evaluation
  • 31.
    31 • Churn predictionis just one component of churn management • Marketing will not use the model if they don’t know what action to take on the predictions and why • Use model interpretation to help marketing take action