Downloaded 39 times

![Script Examples
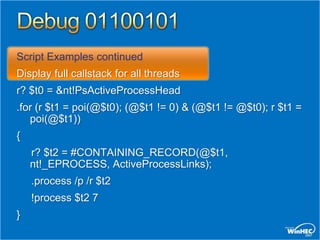
Search for kernel trap frames.
Demonstrates arbitrary processing
on each hit
.foreach ($addr { s-[1]d 80000000 l?7fffffff
23 23 }) { ? $addr ; .trap $addr - 0n52 ; kv
}!vm](https://image.slidesharecdn.com/dvrt410wh07-13217189852356-phpapp02-111119101246-phpapp02/85/Driver-Debugging-Basics-17-320.jpg)


This document provides an overview of debugging techniques for x64 and x86 architectures, including key differences and commands. It discusses debugging tools in Windows Vista and Windows Server, architectural changes, and answers the top 10 questions on debugging topics such as breakpoints, scripts, pseudo registers, and more. Recommended resources and related training sessions are also provided.