Food for thought
Highest growth velocity seen at ?
Difference between failure to thrive and short stature ?
What is growth failure ?
What is the most important determinant for
Birth weight?
Weight at 2 years ?
Final adult weight ?
What is MPH and what does it signify
3.
WHAT IS GROWTH?
Growth is the sum of all cell replication and organ differenciation
processes in the body.
• Dynamic process
• Increase in the physical size of the body
• Growth is genetically predetermined.
• Growth progresses orderly with individual variation.
• Factors influencing growth and development
Nutrition Family Emotional factors Socio cultural and community
Physical factors
Growth is an indicator of physical and mental well being of a child.
4.
Growth and development
.
Growth Development
Net increase in the size or mass of
tissues
Specifies maturation of functions
Multiplication of cells
Increase in intracellular substance
Hypertrophy and expansion of cell
size
Maturation and myelination of
nervous system
Indicates acquisition of skills
5.
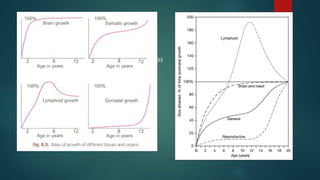
Laws of growth
Growth and development of children is a continuous and orderly
process
Growth pattern of every individual is unique
Order of growth is cephalocaudal and distal to proximal (head
neckarms legs and hands increase in size before arms )
Factors affecting growth
Size at birth does not affect the infants genetic growth potential, in
the first 2 years of life that infants gradually transition from their birth
size to their own genetically determined height potential.
Infants shift linear growth percentiles; 65% infants exhibit such shifts –
moving up and down the growth charts. By 24 months these shifts
are complete and children have entered a specific growth channel
Birth weight is generally a poor indicator of the eventual growth
pattern (except IUGR), most show catch up growth
9.
Factors affecting growth
Postnatal period
Genetic factors
IUGR
Nutrition
Hormonal influences : GH, Thyroid, Gonadal steroids, Glucocorticoids
Sex
Infections
Chemical agents
Trauma
Socioeconomic factors
Ethnicity and race
Environment and stimulation
Secular trend
11.
PURPOSE OF GROWTHASSESMENT
The purpose is to determine whether child is growing “normally”
or
Has “growth problem ” or trend towards a growth problem that
should be addressed.
12.
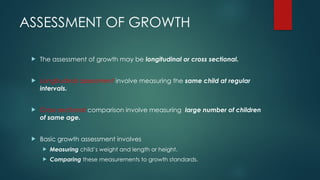
ASSESSMENT OF GROWTH
The assessment of growth may be longitudinal or cross sectional.
Longitudinal assessment involve measuring the same child at regular
intervals.
Cross sectional comparison involve measuring large number of children
of same age.
Basic growth assessment involves
Measuring child’s weight and length or height.
Comparing these measurements to growth standards.
13.
When to assessnormal growth
WELLNESS VISITS
Immunization contacts : 6, 10, 14 weeks, 9 months, 15- 18 months
Additional monitoring at 6 monthly intervals with opportunistic
monitoring at illness visits is recommended.
4 to 8 years: height and weight 6 monthly and BMI, PL, SMR yearly
from 6 years
9 to 18 years: height, weight, BMI, SMR should be assessed yearly
14.
Red flag signs/criteria for referral
Height <3rd
or >97th
HC <3rd
or >97th
Crossing 2 major percentile lines
Below or above MPH range
Absence of weight gain from 2 to 3 months between 6 to 11 months
BMI > 23rd
adult equivalent of IAP
Growth velocity less than 5cm/year between 3 to 9 years
Girls with axillary, pubic hair growth or breast budding before 8 years and
boys with axillary, pubic hair growth or genital growth or testicular
enlargement before 9 years
15.
Red flag signs/criteria for referral
Delayed puberty: girls without breast budding by 14yrs & no
menarche by 15 yrs or boys with no signs of puberty till 16 yrs
Arrest of puberty at some stage >2yrs
Micropenis
b/l or u/l undecended testis
Atypical genitalia
u/l or b/l gynecomastia in boys
Hirsutism or menstrual irregularities in girls
16.
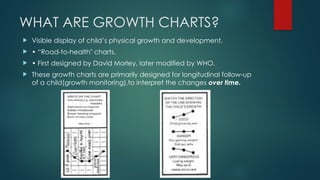
WHAT ARE GROWTHCHARTS?
Visible display of child’s physical growth and development.
• “Road-to-health" charts.
• First designed by David Morley, later modified by WHO.
These growth charts are primarily designed for longitudinal follow-up
of a child(growth monitoring),to interpret the changes over time.
17.
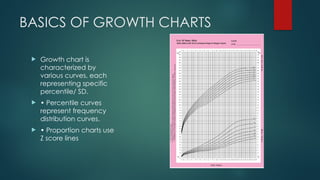
BASICS OF GROWTHCHARTS
Growth chart is
characterized by
various curves, each
representing specific
percentile/ SD.
• Percentile curves
represent frequency
distribution curves.
• Proportion charts use
Z score lines
18.
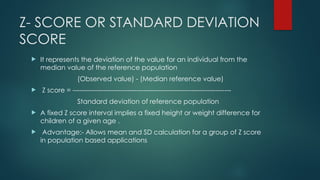
Z- SCORE ORSTANDARD DEVIATION
SCORE
It represents the deviation of the value for an individual from the
median value of the reference population
(Observed value) - (Median reference value)
Z score = ------------------------------------------------------------------------
Standard deviation of reference population
A fixed Z score interval implies a fixed height or weight difference for
children of a given age .
Advantage:- Allows mean and SD calculation for a group of Z score
in population based applications
20.
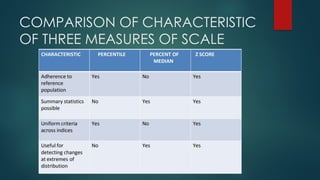
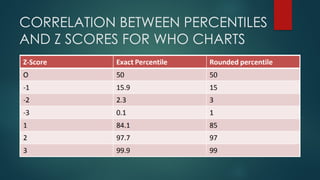
PERCENTILE
The rankposition of an individual on a given reference distribution,
stated in terms of what percentage of the group the individual
equals or exceeds .
Unable to calculate summary statistics with the use of percentiles.
Towards extremes of the reference distribution-only little change in
percentile value with substantial change in weight or height status
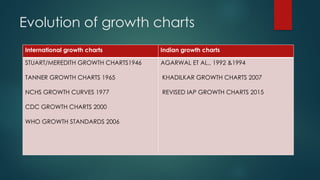
Evolution of growthcharts
International growth charts Indian growth charts
STUART/MEREDITH GROWTH CHARTS1946
TANNER GROWTH CHARTS 1965
NCHS GROWTH CURVES 1977
CDC GROWTH CHARTS 2000
WHO GROWTH STANDARDS 2006
AGARWAL ET AL., 1992 &1994
KHADILKAR GROWTH CHARTS 2007
REVISED IAP GROWTH CHARTS 2015
24.
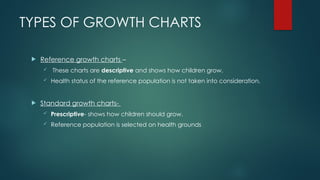
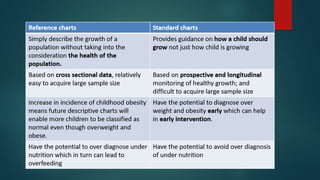
TYPES OF GROWTHCHARTS
Reference growth charts –
These charts are descriptive and shows how children grow.
Health status of the reference population is not taken into consideration.
Standard growth charts-
Prescriptive- shows how children should grow.
Reference population is selected on health grounds
HISTORY OF INNOVATIONOF
GROWTH CHARTS
Published the first growth charts
in his work “Histoire Naturelle”
28.
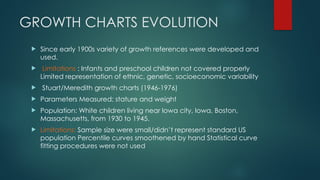
GROWTH CHARTS EVOLUTION
Since early 1900s variety of growth references were developed and
used.
Limitations : Infants and preschool children not covered properly
Limited representation of ethnic, genetic, socioeconomic variability
Stuart/Meredith growth charts (1946-1976)
Parameters Measured: stature and weight
Population: White children living near Iowa city, Iowa, Boston,
Massachusetts, from 1930 to 1945.
Limitations: Sample size were small/didn’t represent standard US
population Percentile curves smoothened by hand Statistical curve
fitting procedures were not used
29.
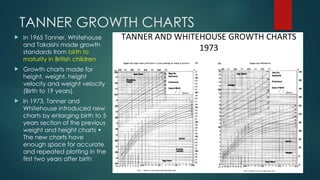
TANNER GROWTH CHARTS
In 1965 Tanner, Whitehouse
and Takaishi made growth
standards from birth to
maturity in British children
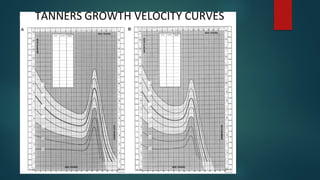
Growth charts made for
height, weight, height
velocity and weight velocity
(Birth to 19 years).
In 1973, Tanner and
Whitehouse introduced new
charts by enlarging birth to 5
years section of the previous
weight and height charts •
The new charts have
enough space for accurate
and repeated plotting in the
first two years after birth
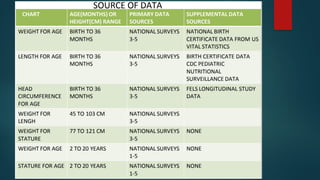
NCHS GROWTH CURVES1977
National Academy of Sciences urged to develop new growth
charts for infants and children by using current data.
NCHS task force of experts was formed
Developed mainly to assess nutritional disturbances in U.S. children
Source of data: Fels Research Institute Health Examination Surveys of
NCHS
Disadvantages
Triplets were excluded from study
Twins and low birth weight not excluded
National survey data were not available for birth to one year age
group; Supplemented with Fels data.
The infant charts were solely based on the Fels data
32.
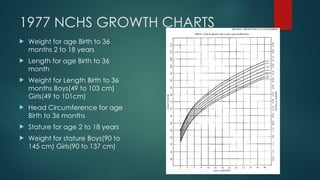
1977 NCHS GROWTHCHARTS
Weight for age Birth to 36
months 2 to 18 years
Length for age Birth to 36
month
Weight for Length Birth to 36
months Boys(49 to 103 cm)
Girls(49 to 101cm)
Head Circumference for age
Birth to 36 months
Stature for age 2 to 18 years
Weight for stature Boys(90 to
145 cm) Girls(90 to 137 cm)
33.
CDC GROWTH CHARTS2000
NCHS growth charts in use since 1977 were revised.
As CDC Growth Charts: released in 2000
Recommended for use in clinical practice and research to assess size
and growth in U.S. children.
Two set of charts Infants, birth to 36 months of age Children and
adolescents from ages 2 to 20 years.
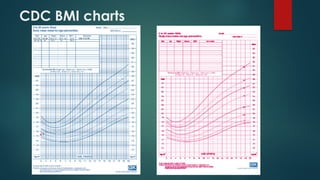
New body mass index-for-age (BMI-for-age) charts were created
35.
CDC GROWTH CHARTS
2000
Data collected: National Health
Examination Surveys II, III
National Health And Nutritional
Examination Surveys I,II&III and
Supplemental data
36.
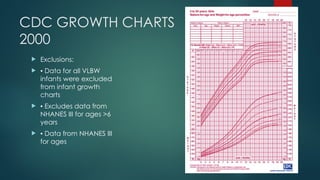
CDC GROWTH CHARTS
2000
Exclusions:
▪ Data for all VLBW
infants were excluded
from infant growth
charts
▪ Excludes data from
NHANES III for ages >6
years
▪ Data from NHANES III
for ages
WHO GROWTH CHARTS2006
NCHS/WHO growth reference, did not adequately represent
early childhood growth and that new growth curves were
necessary.
World Health Assembly endorsed this recommendation in 1994.
WHO undertook the Multicentre Growth Reference Study (MGRS)
between 1997 and 2003 to generate new curves for assessing the
growth and development of children UNDER THE AGE OF 5 YEARS
OVER THE WORLD
39.
The MGRScombined a longitudinal follow-up
from birth to 24 months & a cross-sectional survey
of children aged 18 to 71 months.
Sample Size: 8440 healthy breastfed infants and
young children 1743 for longitudinal component
6697 for cross sectional component Study
Location Brazil, Ghana, India, Norway, Oman
and USA.
The study populations lived in
• Socioeconomic conditions favourable to growth
• Mobility was low
• ≥20% of mothers followed WHO feeding
recommendations and
• Breastfeeding support was available
The mothers were non smokers and breast feeding
their children
40.
Why MGRSis unique? – Growth standards produced by selecting
healthy children living under conditions likely to favour achievement
of their full genetic growth potential.
MGRS data included
Weight and head circumference at all ages,
Recumbent length (longitudinal component),
Height (cross-sectional component),
Length and Height (between 18 to 30 months)
Arm circumference, triceps and subscapular skinfold thickness (all
children aged ≥3 months)
41.
SALIENT FINDINGS INMGRS
Striking similarity in linear growth across the diverse populations were
studied.
An evaluation of the differences in length of participants from birth
to 2 yrs of age within and among the MGRS sites demonstrated 70%
of the total variance in length was due to inter individual differences
and only 3% was due to inter site differences
Greater genetic variability resides within populations than among
populations
43.
WHO GROWTH CHARTS
Charts developed
• Weight for age
• Length/height for age
• Weight for length
• Weight for height
• Body Mass Index for age
• Mid arm circumference for age
• Head circumference for age • Triceps skin fold thickness for age • Sub
scapular skin fold thickness for age • Growth velocity charts based on weight,
height and head circumference • Windows of achievement in motor milestones
WHO growth standards were produced with both Z score curves and percentile
curves
Subscapular skinfold
BMIis not a direct measurement
of body fat
Skinfold thickness indicates the
status of fat deposits in the
body.
Measured using Harpenden
calliper
Measured over the triceps,
subscapular, biceps and
suprailiac area.
54.
Triceps skinfold forage
Normal skinfold thickness
depends on age and sex
Females > males
>85th
centile in age specific
percentile charts are
abnormal
55.
FEATURES OF WHOGROWTH
CHARTS
Based on prescriptive approach
Breastfeeding the biological “norm” and establishes the breastfed
infant as the normative growth model
Provides a truly international standard, that child populations grow
similarly across the world’s major regions when their needs for health
and care are met
New innovative growth indicators: the skin fold thicknesses
56.
Accompanying windowsof achievement for six key motor
development milestones provides a unique link between physical
growth and motor development.
57.
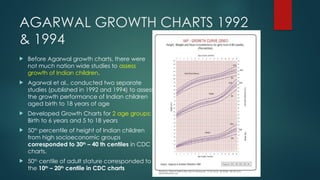
AGARWAL GROWTH CHARTS1992
& 1994
Before Agarwal growth charts, there were
not much nation wide studies to assess
growth of Indian children.
Agarwal et al., conducted two separate
studies (published in 1992 and 1994) to assess
the growth performance of Indian children
aged birth to 18 years of age
Developed Growth Charts for 2 age groups:
Birth to 6 years and 5 to 18 years
50th
percentile of height of Indian children
from high socioeconomic groups
corresponded to 30th
– 40 th centiles in CDC
charts.
50th
centile of adult stature corresponded to
the 10th
– 20th
centile in CDC charts
58.
BIRTH TO6 YEARS
Longitudinal study
Children belonging to the affluent
population segments (urban) in seven
cities were selected: Bangalore,
Bombay, Calcutta, Delhi, Kota,
Ludhiana, and Varanasi.
Years of Data collection: Two years
(1985-1987) as two different cohorts.
Cohort- I - birth to one year Cohort-II -
one to six years of age.
Sample size: Cohort-I - 418 boys and 332
girls Cohort –II - 1011 boys and 874 girls
Parameters measured: Weight
Height/length Circumferences of head,
chest and mid arm.
59.
5 TO 18YEARS
Crosssectional study Study location: Data were collected from 23
schools North Zone(Delhi, Shimla, Dehradun and Nainital) West-
South Zone(Bombay, Madras and Udaipur) Central Zone(Lucknow,
Allahabad, Varanasi) East Zone(Dhanbad and Calcutta)
Sample size: 12899 boys and 9951 girls studying in 1 to 12th std.
Exclusion: Children with systemic diseases or with major surgeries
Parameters measured: Weight Height, sitting height, Head and
Chest circumference Biacromial and Bicristal diameters and Skinfold
thickness (methods described by Tanner and Weiner and Lourie).
Sexual growth(development of genitalia, breast, presence of
auxillary and pubic hair(Graded according to Tanner)
60.
KHADILKAR GROWTH CHARTS2009
WHO recommends that each country should update its growth
references every decade
New growth references were produced in 2009 by Khadilkar et al.
Selection of sites: The IAP divides India into five zones Ten cities were
selected from these zones Schools admitting children of
socioeconomically well off families were selected (11 schools)
61.
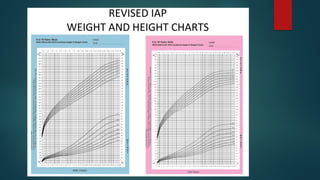
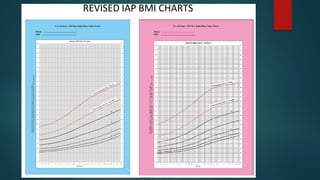
NEW IAP GROWTHCHARTS 2015
The need to revise IAP growth charts for 5- to 18-year-old Indian
children and adolescents was felt as India is in nutrition transition
and Previous IAP charts are based on data of two decades old.
Studies performed on Indian children’s growth, nutritional
assessment and anthropometry from upper and middle
socioeconomic classes in last 10 years were identified
Sample size: 87022 (5 to 18 years) • Data from 14 cities (Agartala,
Ahmadabad, Chandigarh, Chennai, Delhi, Hyderabad, Kochi,
Kolkata, Madurai, Mumbai, Mysore, Pune, Raipur and Surat) in India
were collected.
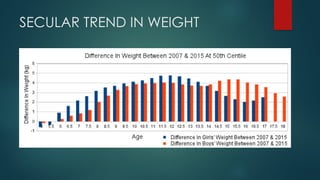
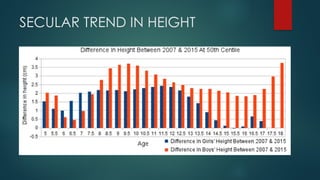
They found small increases in height in 50th
and 97th
centiles and
striking differences in weight percentiles, inidicating secular trend
and epidemic of obesity
Paediatrician friendly growthcharts
User-friendly growth charts for
Paediatrician’s everyday use.
No calculations are involved while using
these charts, neither for BMI nor for MPH
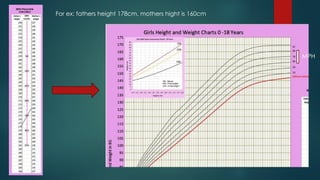
MPH percentile lookup tool which was
designed in such a way that by joining
the father’s height on left to the mother’s
height on the right (both in CM) gives the
MPH percentile (on the middle line) for
that specific gender
A quick BMI screening tool based on
weight for height that eliminates the need
to calculate BMI will help to rapidly
decide if a child is overweight, obese,
normal or underweight.
In a busy clinic, less calculations the
pediatrician must perform the better.
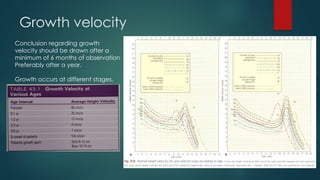
Growth velocity
Conclusion regardinggrowth
velocity should be drawn after a
minimum of 6 months of observation
Preferably after a year.
Growth occurs at different stages.
71.
Growth velocity
Periodof rapid growth: intrauterine
Postnatal growth, highest in the postnatal period, gradually
decreases upto the pre pubertal period followed by pubertal
growth spurt.
Girls Boys
Pubertal growth spurt Early , 10-11years Later, 9-14 years
Peak growth velocity 8-9cm/year 10.3cm /year
After menarche
growth velocity
declines and stops 2
years after menarche.
Higher peak growth
velocity and longer
period of growth
results in taller stature
72.
Height velocity inIndian children
Height velocity percentiles as per age for Indian children and adolescents for 5-17 years
The peak median height velocities were 6.6 cm at 10.5 years in girls and 6.8 cm at 13.5
years in boys
Aim: assess height velocity and develop height velocity percentiles in 5-17-year-old
apparently healthy Indian children from two centers from India (Pune and Delhi), and (ii)
to study the magnitude and
age at peak height velocity
during adolescence in
Indian children.
73.
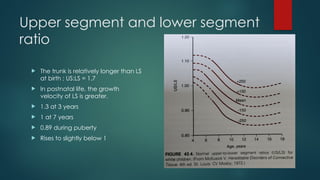
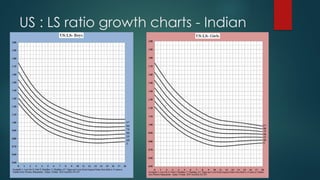
Upper segment andlower segment
ratio
The trunk is relatively longer than LS
at birth ; US:LS = 1.7
In postnatal life, the growth
velocity of LS is greater.
1.3 at 3 years
1 at 7 years
0.89 during puberty
Rises to slightly below 1
How to plotmid parental height
Mid parental height is necessary to understand child’s genetic
potential so that child’s current height percentile can be checked
against MPH percentile.
Involves a calculation and plotting at 18 years to know the mid
parental percentile
MPH = (fathers heigh + mothers height)/ 2 +/- 6.5
This value is plotted on charts, and gives an idea estimate of target
height for the child and the percentile it is likely to follow
Projected adult height = MPH +/- 8.5cm
76.
How to plotmid parental height
For ex:
Fathers height 176cm
Mothers height 168cm
MPH = (176 + 168)/2 +6.5
= 178.5
Present height
9 years: 126cm
77.
HA BA CAWA !!!???
Bone age is a measure of the degree of skeletal maturity of a child, i.e.
how far the child has advanced in its development of the skeleton.
Chronological age : it is the age of the child at present
Height age : Height age is that age at which the childs present
height would have been appropriate for age OR the age that
corresponds to the childs height when plotted at the 50th
percentile
on a growth chart
Weight age: the age that corresponds to the childs weight when
plotted at the 50th
percentile on a growth chart
78.
How to plotheight age
For ex:
8 year old girls height is 140cm
Which corresponds to 10.5 years
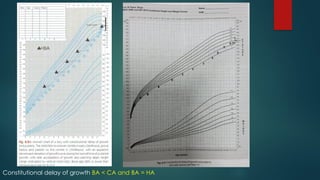
A: constitutional delayof growth and adolescence
BA < CA and BA = HA
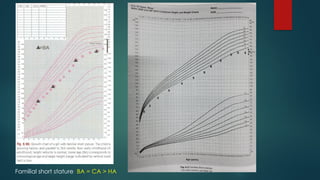
B : Familial short stature
BA = CA > HA
C : Acquired pathogenic growth failure
BA < HA < CA
D Precocius puberty
BA > HA > CA
D
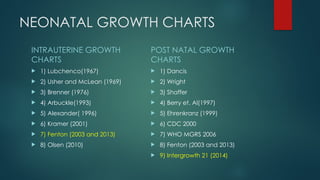
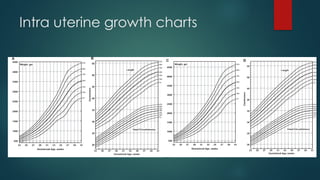
Neonatal growth charts
Optimal post natal growth
Growth standards versus
references
Intrauterine and Postnatal
preterm growth charts
Customized growth charts
Correlation of growth charts
with outcomes
84.
WHY DO WENEED NEONATAL
GROWTH CHARTS?
To identify SGA and LGA babies
To monitor the growth over a period of time ( reflects illness and
nutritional status)
To identify babies with EUGR at 36 weeks gestation
( neurodevelopmental impairment, final short height)
SGA- Asphyxia, hypothermia, hypoglycemia,
hypocalcemia, polycythemia, sepsis, death
LGA- Birth trauma, Asphyxia, hypoglycemia,
hypocalcemia, polycythemia
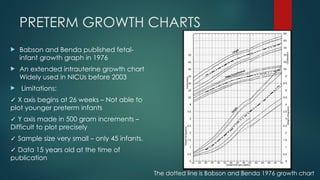
PRETERM GROWTH CHARTS
Babson and Benda published fetal-
infant growth graph in 1976
An extended intrauterine growth chart
Widely used in NICUs before 2003
Limitations:
✓ X axis begins at 26 weeks – Not able to
plot younger preterm infants
✓ Y axis made in 500 gram increments –
Difficult to plot precisely
✓ Sample size very small – only 45 infants.
✓ Data 15 years old at the time of
publication
The dotted line is Babson and Benda 1976 growth chart
87.
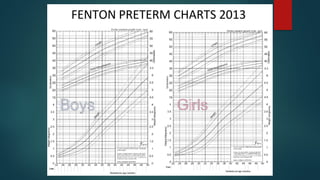
REVISED FENTON GROWTHCHARTS
2013
In 2003, Fenton produced updated version of Babson and Benda charts.
In 2013, revision of 2003 charts was done by Fenton and Kim.
Aim to harmonize the preterm growth chart with the new WHO growth Standard
Features of revised charts:
✓ Based on the recommended growth goal for preterm infants, fetus and term infant.
✓ Sex specific charts.
✓ Equivalent to WHO charts at 50 weeks gestational age( 10 weeks post term age)
✓ Large sample size of 4 million preterm infants
✓ Recent population based surveys collected between 1991 to 2007
✓ Data from developed countries
✓ Enables plotting as infants are measured, not as completed weeks
✓ Exact Z score and percentile calculator available.
✓ Growth references not standards
89.
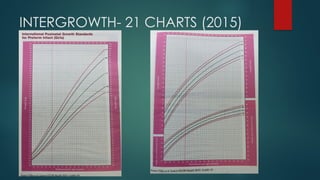
INTERGROWTH- 21 CHARTS(2015)
Series of projects
conducted
following the
WHO prescriptive
approach (Brazil,
Italy, Oman,
United Kingdom,
United States,
China, India and
Kenya)
Aim: provide
international
data irrespective
of racial/ethnic
origin
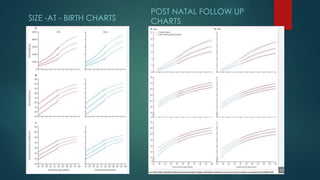
SIZE -AT -BIRTH CHARTS
POST NATAL FOLLOW UP
CHARTS
94.
POSTNATAL GROWTH
*POSTNATALDIP in weight- attributed to extracellular
fluid losses.
*Most preterm also do not grow in length or head
circumference in the first week of life, so all 3 growth
parameters often cross percentiles downwards on
growth charts.
*Grow approximately parallel to growth chart curves
once adequate nutrition is established and morbidities
addressed
Depends on genetic potential, internal and external factors
Infancy (Nutrition)
Childhood (Growth hormones)
Puberty (Growth hormones + Sex Steroids)
95.
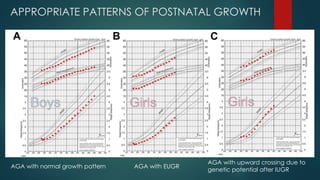
APPROPRIATE PATTERNS OFPOSTNATAL GROWTH
AGA with normal growth pattern AGA with EUGR
AGA with upward crossing due to
genetic potential after IUGR
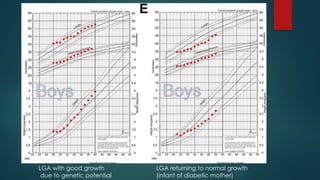
96.
LGA with goodgrowth
due to genetic potential
LGA returning to normal growth
(infant of diabetic mother)
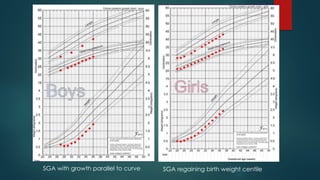
97.
SGA with growthparallel to curve SGA regaining birth weight centile
98.
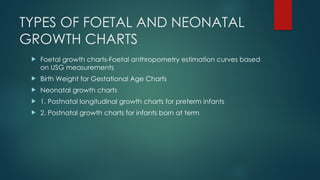
TYPES OF FOETALAND NEONATAL
GROWTH CHARTS
Foetal growth charts-Foetal anthropometry estimation curves based
on USG measurements
Birth Weight for Gestational Age Charts
Neonatal growth charts
1. Postnatal longitudinal growth charts for preterm infants
2. Postnatal growth charts for infants born at term
WHAT ARE CUSTOMIZEDGROWTH
CHARTS?
Adjusted to reflect maternal constitutional variation.
Optimized, by presenting a standard free from pathological factors
such as diabetes and smoking; and
Based on fetal weight curves derived from normal pregnancies,
rather than neonatal weight curves which include pathological
preterm deliveries.
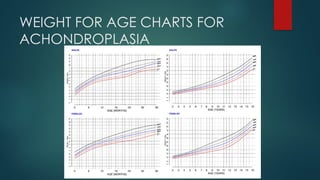
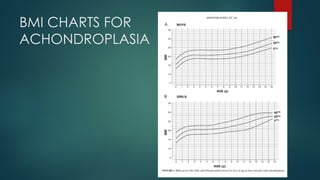
SPECIAL GROWTH CHARTS
Down syndrome
Turner syndrome
Achondroplasia
William syndrome
Cerebral palsy
103.
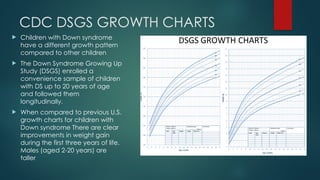
CDC DSGS GROWTHCHARTS
Children with Down syndrome
have a different growth pattern
compared to other children
The Down Syndrome Growing Up
Study (DSGS) enrolled a
convenience sample of children
with DS up to 20 years of age
and followed them
longitudinally.
When compared to previous U.S.
growth charts for children with
Down syndrome There are clear
improvements in weight gain
during the first three years of life.
Males (aged 2-20 years) are
taller
Uses of growthchart
1.Growth monitoring
2. Diagnostic tool: for identifying "high-risk“ children.
For example, malnutrition can be detected long before signs and symptoms of it
become apparent
3. Planning and policy making: by grading malnutrition, it provides an objective basis
for planning and policy making in relation to child health care at the local and
central levels
4. Educational tool: because of its visual character, the mother can be educated in
the care of her own child· and encourage her to participate more actively in
growth monitoring
108.
Uses of growthchart
5. Tool for action: it helps the health worker on the type of intervention that is
needed; it will help to make referrals easier
6. Evaluation: it provides a good method to evaluate the effectiveness of
corrective measures and the impact of a programme or of special
interventions for improving child growth and development.
7. Tool for teaching: it can also be used for teaching, for example, the
importance of adequate feeding; the deleterious effects of diarrhoea.
8.Reassurance:It provides reassurance about child’s health and prevents
parental anxiety.
110.
Answers
Highest growthvelocity seen at ?
Prenatal 66cm/yr > postnatal 25cm/yr
Difference between failure to thrive and short stature ?
FTT- poor wt gain in infants and young children and
Short stature – subnormal linear growth in childhood and adolescence
What is growth failure ?
Subnormal rate of growth; sustained height velocity <25th
centile or <-1.5SD
What is the most important determinant for
Birth weight? – maternal and placental factors
Weight at 2 years ? – gradual transition from birth size to genetic potential
Final adult weight ? – genetic potential
What is MPH and what does it signify – avg of both parents height after
correcting for sex, childs genetic potential
111.
Take home points
We must get into the habit of regularly plotting these
anthropometric data on the appropriate growth chart until the age
of 18 years, and this will help in picking up the reason for failure to
thrive early and thereby help to reduce expensive investigations.
112.
References
Nelson textbookof paediatrics
Nelson Paediatric symptom based diagnosis
OP GHAI textbook of essential paediatrics
Paediatric Endocrine Disorders by Meena P Desai
IAP textbook of Endocrinology
ILLINGWORTHs development of the infant and young child
WHO
IAP
Height Velocity Percentiles in Indian Children Aged 5-17 Years VAMANKHADILKAR1,
ANURADHAKHADILKAR1, ARCHANA ARYA2, VEENA EKBOTE1, NEHAKAJALE1, LAVANYA
PARTHASARATHY1, VIVEK PATWARDHAN1, SUPRIYA PHANSE1 AND
SHASHICHIPLONKAR1
Khadilkar V, Yadav S, Agrawal KK, Tamboli S, Banerjee M, Cherian A, Goyal JP,
Khadilkar A, Kumaravel V, Mohan V, Narayanappa D. Revised IAP growth charts for
height, weight and body mass index for 5-to 18-year-old Indian children. Indian
pediatrics. 2015 Jan 1;52(1):47-55.