Downloaded 18 times
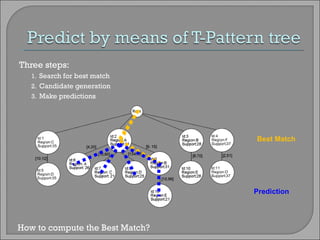
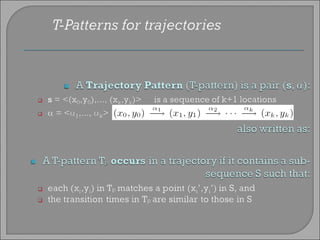
![To avoid the rules generation the T-Pattern set is organized as a prefix tree. For Each node v • Id identifies the node v • Region a spatial component of the T-Pattern • Support is the support of the T-pattern For Each edge j • [a,b] correspond to the time interval α n of the T-Pattern](https://image.slidesharecdn.com/wherenext-100506140651-phpapp01/85/Where-Next-10-320.jpg)
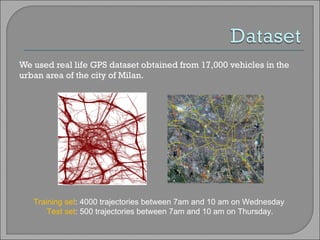
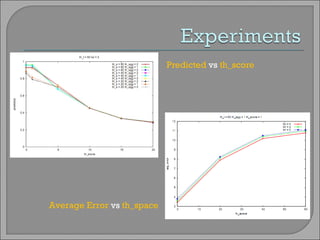
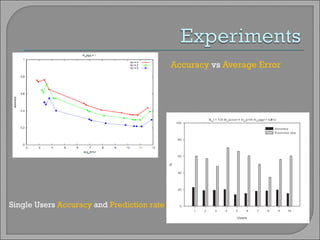
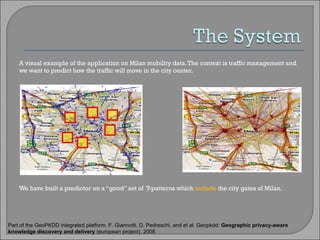

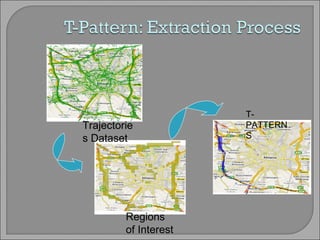
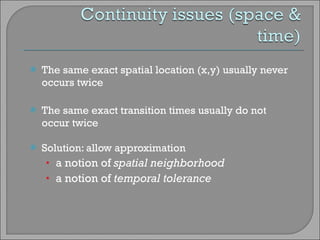
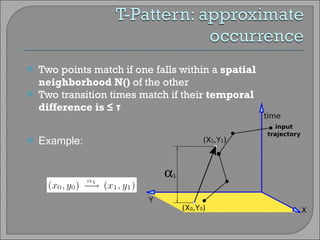
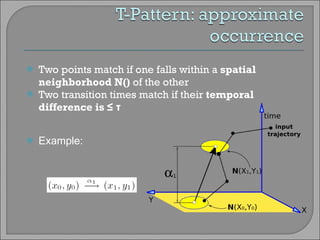

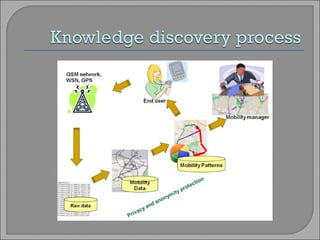
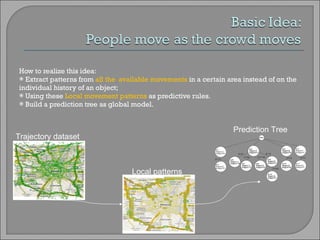
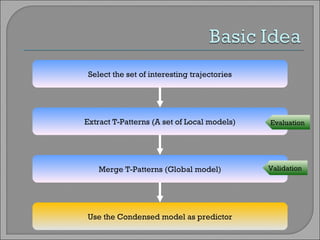
- The document presents a technique called WhereNext that predicts the next location of a trajectory based on analyzing patterns from previous movements without considering individual user information. - WhereNext builds a prediction tree model from patterns of movement called T-Patterns extracted from trajectory data. It allows spatial and temporal approximation to account for noise in real trajectories. - The method can be tuned for accuracy and prediction rate. Evaluation on a real dataset of 17,000 vehicle GPS trajectories in Milan showed it effectively predicts next locations.