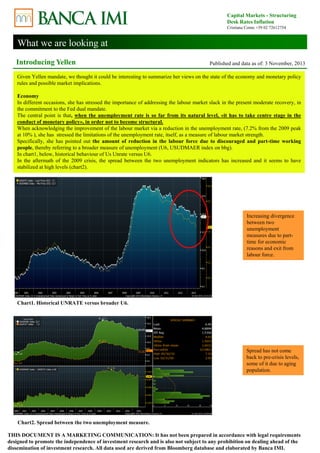
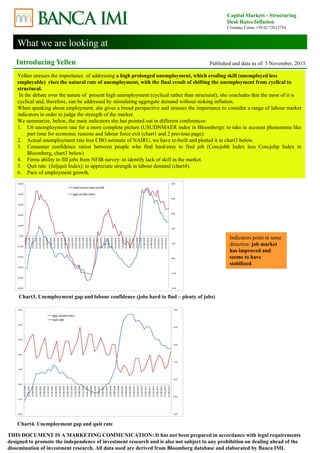
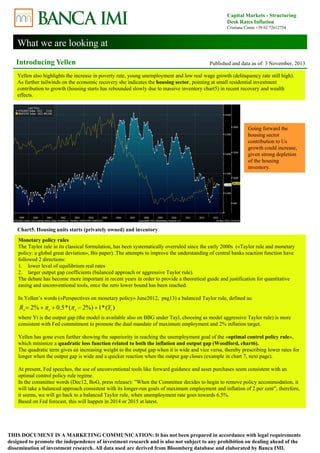
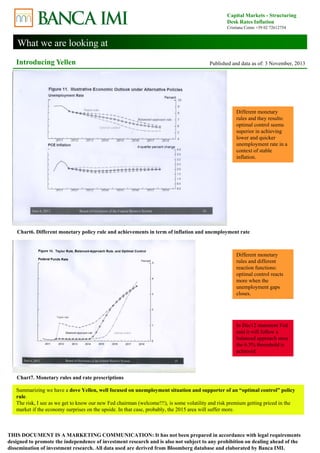
Yellen stresses the importance of addressing high prolonged unemployment to prevent it from becoming structural. She judges the strength of the labor market using multiple indicators including the U6 unemployment rate, the gap between actual and estimated NAIRU rates, and measures of job availability and quits. Yellen supports an "optimal control" monetary policy rule that aims to minimize unemployment and inflation gaps, prescribing lower rates when output gaps are wide. She expects the Fed will follow a balanced monetary policy approach once unemployment falls to around 6.5%, likely in 2014-2015.
Financialization, Rentier Interests, and Central Bank PolicyConor McCabe
Financialization, Rentier Interests, and Central Bank Policy
Gerald Epstein
Department of Economics and Political Economy Research Institute (PERI)
University of Massachusetts, Amherst
December, 2001; this version, June, 2002
This document discusses monetary policy responses to the global financial crisis, using Egypt as a case study. It finds that the Central Bank of Egypt's ideal policy tools are the overnight interest rate and legal reserve requirements. Interest rates have a longer-term impact on goals like growth, price stability, and job creation. The study also argues for enhancing central bank independence and transparency in nations with high corruption, to help address chronic inflation and socio-political instability.
The document provides an overview and analysis of prevailing market conditions as of late 2009. It discusses signs of continued economic recovery, remaining risks from withdrawing stimulus, and new global economic patterns emerging from the financial crisis. Opportunities are seen in identifying companies and industries that will benefit from these changes. Charts show improved economic indicators, earnings beating estimates, and valuations looking more attractive as earnings recover.
This document is a paper analyzing quantitative easing (QE) policies, specifically examining their use in the United States and Japan. It begins with an overview of QE, defining it as a monetary policy where central banks increase money supply by purchasing assets like treasury bonds. The paper then reviews research on Japan's use of QE in the 1990s, finding it increased money supply and lowered interest rates without significantly raising inflation. Turning to the US, the paper notes the Federal Reserve has enacted two rounds of QE but debates whether it has been effective. It concludes that more study is needed but US inflation may rise, so QE policies should be reined in to avoid hyperinflation.
The document discusses four challenges facing the American economy: the Federal Reserve's large balance sheet from quantitative easing, historically low interest rates, a sluggish housing market, and growing government debt. It analyzes the implications of the Fed either maintaining or selling off its assets on interest rates and inflation. While higher rates could curb inflation, it may also slow the housing recovery and increase the cost of servicing government debt. The best approach is for the Fed to gradually raise rates through asset sales as the economy continues improving.
This document discusses estimating fiscal multipliers for the Indian economy. It presents the framework for doing so, including the main fiscal policy levers of government spending on capital/revenue accounts and tax rates. Capital expenditures have the strongest multiplier effect on output. The document estimates multipliers using a structural macroeconomic model that incorporates a fiscal block. It finds the capital expenditure multiplier is 2.45, the transfer payments multiplier is 0.98, and the other revenue expenditure multiplier is 0.99.
Stock market and economic growth the nigerian experienceAlexander Decker
This document analyzes the relationship between the stock market and economic growth in Nigeria. It specifically examines the effects and causal relationship between market capitalization (a measure of stock market size) and gross domestic product (GDP, a measure of economic growth) in Nigeria from 1981 to 2008.
The study employs an error correction model and Granger causality tests to analyze the interaction between stock market and economic growth. The results show there is unidirectional causality from economic growth to the stock market in the short run, with the stock market having a negative effect on economic growth. However, in the long run the stock market has a positive effect on economic growth. The study concludes the Nigerian stock market can stimulate economic growth
This document discusses key economic concepts including the circular flow of income, GDP, the economic cycle, recession, and economic indicators. It defines the circular flow of income as showing flows of goods and services between households and firms. GDP is defined as the total market value of goods and services produced within a country in a year. The economic cycle and recession refer to periods of decline and growth in economic activity. Economic indicators such as inflation, interest rates, and Euribor are also defined.
This document discusses the concept of "black swans" and economic forecasting. It begins by explaining the origin of the term "black swan" and how Nassim Taleb later used it to describe rare events with disproportionate impacts. It then discusses challenges with economic analysis and forecasting due to lack of data and uncertainties. The rest of the document focuses on analyzing past recessions and economic cycles, challenges with the recent recovery, issues around credit growth and deleveraging, and the importance of considering many interrelated factors when developing economic forecasts. It also describes the machine learning techniques and models used by the company discussed in the document to generate their economic forecasts.
- Real interest rates in the US are currently at their most negative level in almost three decades, which is an important development that should not be ignored by investors.
- Historically, periods of deeply negative real rates have typically been followed by improvements in leading economic indicators and increased spending, consumption, and demand for assets by both consumers and businesses.
- Based on historical relationships, the current negative real rate environment suggests that US economic prospects and equity markets may find increased support and possibly a sustained rally in the coming year.
Does government spending spur economic growth evidence from nigeriaAlexander Decker
- The document examines the impact of government spending on economic growth in Nigeria using annual time series data from 1970 to 2010.
- The results show that at the aggregate level, government spending in Nigeria has a small positive impact on growth (0.16%), but at the disaggregated level only recurrent spending significantly and positively impacts growth while capital spending has a negative and insignificant effect.
- This finding contradicts economic theory, so the authors cautiously interpret it as a special case for Nigeria, which has poor institutions, corruption, and a weak capital infrastructure base.
This document summarizes a research study on the impact of inflation on Nigeria's economic growth from 1981 to 2018. The study used an Auto Regressive Distributed Lag model and data from the Central Bank of Nigeria. The results showed that inflation had a negative and significant impact on economic growth, while exchange rate had a negative but insignificant impact. The study concluded that curbing inflation is important for Nigeria's economy. It recommended that monetary authorities reduce money supply through fiscal and monetary policies to lower inflation.
Economic indicators provide information about economic performance and allow analysis of business cycles. Some key economic indicators mentioned in the document include GDP, fiscal deficit, Sensex stock index, CPI inflation index, HDI human development index, and balance of payments. GDP measures total economic output, fiscal deficit is the gap between government spending and revenues, Sensex tracks the Bombay stock exchange, CPI measures inflation, HDI assesses health, education and income, and balance of payments tracks international monetary transactions.
Location quotients are used to measure how concentrated a particular industry is in a geographic area compared to the national average. They are calculated by taking an industry's share of total local employment and dividing it by the industry's share of total national employment. A location quotient of 1 means the industry has the same concentration locally as nationally. Values above 1 mean it is more concentrated locally, while values below 1 mean it is underrepresented. The document provides examples of calculating location quotients for industries in Bridgeport, CT and Hampton Roads, VA to show their leading industries and explain how location quotients can be used to analyze a region's economic strengths.
This document summarizes an article titled "Increasing Returns and Long-Run Growth" by Paul M. Romer. It proposes an alternative model of long-run economic growth where knowledge, rather than physical capital, is the main driver of growth. Knowledge exhibits increasing marginal returns in production but decreasing returns in research and development. This allows for perpetual economic growth without limits in a competitive market equilibrium framework. The model overturns conventional assumptions that growth rates decrease and countries converge over time by introducing externalities from new knowledge and increasing rather than diminishing returns to knowledge accumulation.
Inflation Targeting and Growth: The Way Forward for IndiaBIOLOGICAL FORUM
ABSTRACT: This paper looks at the genesis of inflation targeting and the impact of repo rate on Gross Domestic Product (GDP) and brings out our experience with a reconstituted Monetary Policy Committee (MPC) with its thrust to combine inflation targeting [1] with growth. It brings out how an extremely cautionary approach in fixing repo rate can have deleterious impact on growth and concomitantly on private sector investment and animal spirits. Tracing the importance of Taylor rule in taking a balanced approach towards actual and potential growth and inflation for repo rate determination, the paper brings out, how there is a broad congruence now between growth and inflation, once the MPC system fixes a reasonable repo rate. The paper also looks at macro economic variables like low PLF in power sector combined with surging thermal generation, twin balance sheet challenges that continue to confront the corporate and banking sector affecting capacity utilization and dissuading new investment. The paper makes a strong case for a much lower repo rate, in order to take the country come out of its morass of low investment trap and kindle the animal spirits of the investors.
Single digit inflation targeting does it promote economic growthAlexander Decker
This document summarizes a journal article that investigates the relationship between single-digit inflation and economic growth in South Africa using annual time series data from 1965-2010. The results of the analysis suggest that targeting single-digit inflation undermines economic growth in South Africa in the long run. While some studies have found that inflation below 11% promotes growth in developing countries, the mixed findings in the literature highlight the need to specifically examine the impact of single-digit inflation. The analysis in this document finds that periods of single-digit inflation are negatively correlated with economic growth in South Africa, questioning the benefits of targeting low single-digit inflation rates in developing countries.
DT2 - Indian Inflation - Populism, Politics and Procurement PricesNikhil Mohan
- Aggregate demand in India is weak and weakening, contrary to claims by the RBI.
- India's excess inflation is mostly due to high minimum support prices set by the government for agricultural products.
- Inflation in India has peaked and interest rates set by the RBI have also peaked, so there is no justification for the RBI's recent interest rate hikes.
This document provides an introduction to macroeconomics. It defines macroeconomics, discusses key questions in the field, and outlines different schools of thought regarding the appropriate role of government intervention in the economy. The document also summarizes different economic goals and debates around activist versus non-activist policy approaches.
This document discusses various leading economic indicators of the Indian economy presented by group 12. It provides details on indicators such as GDP, purchasing power parity, inflation, interest rates, credit levels, foreign exchange reserves, foreign direct investment, and monsoon rainfall. GDP growth in India has been strong, with the economy being the second fastest growing major economy. However, economic performance still depends heavily on factors like monsoon rainfall and agriculture given the large population engaged in farming.
Market efficiency, market anomalies, causes, evidences, and some behavioral a...Alexander Decker
This document discusses market anomalies and the efficient market hypothesis. It provides definitions of market efficiency, forms of market efficiency including weak, semi-strong, and strong forms. It then defines market anomalies as deviations from expected market behavior that cannot be explained by market efficiency. The document categorizes anomalies into fundamental anomalies, technical anomalies, and calendar or seasonal anomalies. It provides examples of calendar anomalies such as the weekend effect and turn-of-the-month effect, and discusses previous studies that have found evidence of these anomalies in various stock markets. The document aims to review market anomalies and discuss their possible causes from both market efficiency and behavioral finance perspectives.
Stock market anomalies a study of seasonal effects on average returns of nair...Alexander Decker
This document summarizes a research study that examines seasonal effects (anomalies) on stock returns in the Nairobi Securities Exchange (NSE) in Kenya. Specifically, it analyzes the day of the week effect, weekend effect, and monthly effect. The study tests hypotheses about whether average returns differ by day of the week or month. It reviews previous literature documenting calendar anomalies in other stock markets. The conceptual framework focuses on analyzing the three seasonal effects. The study uses 12 years of daily closing price data for NSE indices to test the hypotheses and determine if the NSE exhibits calendar anomalies.
The document discusses key aspects of India's economic environment and policies. It describes macroeconomic factors that influence consumer behavior and business performance. It also outlines different types of economic systems including traditional, command, market and mixed economies. It provides details on India's GDP, inflation, interest rates, economic planning and industrial policies. The document presents an overview of key concepts in India's economic landscape.
Carlos Crespo has over 30 years of experience developing real estate projects. He has developed over 18 million square feet of commercial and industrial facilities in 17 countries. Crespo holds masters degrees from Indiana University and the University of London, and is an active member of several professional organizations.
The document discusses the expected monetary policy approach of Janet Yellen as the new Chair of the Federal Reserve. It outlines Yellen's academic background in Keynesian economics and belief in government intervention. It also describes her views on continuing unconventional monetary policies like quantitative easing to further stimulate the economy and reduce unemployment. The summary provides high-level context about Yellen's appointment and expected policy priorities.
The document discusses the benefits of exercise for mental health. Regular physical activity can help reduce anxiety and depression and improve mood and cognitive function. Exercise causes chemical changes in the brain that may help alleviate symptoms of mental illness and boost overall mental well-being.
The document discusses the benefits of exercise for mental health. Regular physical activity can help reduce anxiety and depression and improve mood and cognitive functioning. Exercise causes chemical changes in the brain that may help protect against mental illness and improve symptoms.
The document discusses the benefits of exercise for mental health. Regular physical activity can help reduce anxiety and depression and improve mood and cognitive function. Exercise causes chemical changes in the brain that may help protect against mental illness and improve symptoms.
The document discusses several topics related to fixed income investing and the yield curve, including: yield curve determinants like default risk, supply and demand, and central bank intervention; interpreting the slope of the yield curve; and the interest rate cycle. It also covers components of the Consumer Price Index (CPI) like food, housing, transportation, and education; factors that influence corporate leverage; and how the CPI measures the cost of shelter through owners' equivalent rent and rent of primary residence.
Foreign Currencies Effect on Stock PricesAustin Polk
This document analyzes the effect of foreign currency fluctuations on the stock prices of 4 companies between January and March 2016. It finds that American Airlines stock price increased slightly due to strengthening of the dollar against currencies it is exposed to. Activision Blizzard stock declined as dollar gains hurt foreign revenues more than expenses. Toyota Motor stock fell as a strong dollar hurt costs. Nokia stock dropped after an unfavorable patent settlement and currency hedging losses.
Investors are betting that interest rates will rise faster than expected by purchasing put options on interest rates. The put to call ratio on interest rate options has risen from 1.9 to 3.2, indicating that more investors now expect rates to increase sooner as employment figures rise and the Federal Reserve continues to phase out its bond purchasing stimulus program and raise rates. Traders are using short-term interest rate options to profit from any potential policy changes or surprises from the Federal Reserve regarding interest rates.
Fixed Income Trading and Platform ArchitectureKhader Shaik
The document discusses the key aspects of a fixed income trading platform. It describes the main participants in the fixed income market like broker/dealers, funds, and banks. It outlines the typical organization structure of a fixed income trading desk with front, middle, and back offices. The main system modules for trading, position management, pricing, risk management, and market access are covered. Key features of trade entry, quote management, and connectivity to liquidity sources are also summarized.
This document discusses the performance of the zero coupon yield curve (ZCYC) in pricing government bonds in India. It finds that a ZCYC that weights bonds by traded volume and uses filtered input data performs best, with the lowest error levels for the most liquid bonds. The analysis shows that such a model can effectively hedge exposures to single bonds, protecting against losses compared to an unhedged position. Overall, the document evaluates different ZCYC specifications and bond selection criteria to determine how well the ZCYC works in pricing bonds and its usefulness for hedging and speculation activities.
This document introduces the Core Master Trading Strategies course from Online Finance Academy. The course teaches professional trading strategies and techniques over multiple parts, including understanding market behavior, technical analysis using charts and indicators, identifying high-probability trade setups, risk management, and psychology. It is taught by experienced traders and aims to help students develop their skills and careers in trading. Completing this course is the starting point for further specialized courses offered by the Academy.
This document provides an overview of spread trading strategies in the US Treasury market. It defines spread trading as taking long and short positions in different futures contracts to profit from perceived mispricing. The document discusses why spread trading requires lower margins and forces traders to think in terms of price targets. It provides examples of common spread trading strategies like intermarket, calendar, butterfly, and condor spreads. It also addresses frequently asked questions about spread trading and lists topics covered in the accompanying yield curve trading strategies course.
Scalping futures is a technique which can provide a steady revenue stream to talented traders. This course explains the basics of the techniques involved in short term trading of index futures and what is involved in becoming a successful day trader.
During the week of February 22, 2016, the U.S. Treasury yield curve steepened overall as investor expectations of future interest rate rises increased. The yield curve fluctuated between steepening and flattening on different days due to factors like weakening currencies, global economic uncertainty, and U.S. Treasury auctions. By week's end, positive U.S. economic data reduced recession fears and caused investors to sell Treasuries, steepening the yield curve further.
The document analyzes potential unemployment scenarios in the United States over the next decade. It first examines current unemployment data and trends, finding the unemployment rate at 10% with 17.3% underemployment. It then presents three scenarios: 1) unemployment peaking in late 2010 and returning to pre-recession levels by 2013, based on historical patterns; 2) unemployment declining more slowly due to factors like declining consumer credit, part-time work, and low labor participation; 3) unemployment remaining elevated for years due to challenges across many industries in creating sufficient new jobs.
Developing Trends - Central Banks - The Good the Bad and the UglyNikhil Mohan
This document discusses central banks and their performance. It summarizes that central banks aim to target inflation and maximize output. The US central bank has performed best among developed economies, while Israel's central bank has performed best among emerging markets from 2002-2011. Countries with interest rates lower than what the Taylor Rule prescribes have experienced little inflation cost and stronger growth. Inflation was a concern in early-mid 2011, but growth, or the lack thereof, will be a bigger concern for emerging markets going forward, suggesting interest rate cuts may be needed.
Why Macroeconomic Structural and Wage-Price Indicators are Puzzling the Polic...Economic Policy Dialogue
This commentary tries to answer the puzzling questions – why there is a disconnect between inflation and unemployment, unemployment rate and wage rate, monetary policy rate stance and real economy, economic buoyancy and price-wage indicators; and also, why the neutral interest rate and the natural unemployment rate are declining. It points out that the official data do not represent the structural realities of the economy. As the official measurements have been deviating more from the social and economic facts, the economic indicators have tended to become less predictable and applicable.
PLEASE REWORD THESE PARAGRAPHS IN YOUR OWN WORDS. PLEASE DO NOT US.docxLeilaniPoolsy
PLEASE REWORD THESE PARAGRAPHS IN YOUR OWN WORDS. PLEASE DO NOT USE THE SAME WORDS AS IN THE PARAGRAPHS. THANKS.
· 1-According to Lisa Huddlestun, "Macroeconomics is the study of behaviors and activities of the economy as a whole, looks at such areas as the Federal Reserve System, unemployment, gross domestic product (GDP), and business cycles" (Huddlestun 2015.) The Federal Reserve System's most important attribute is the regulation of the supply of money in circulation. This is important to the economy because it influences interest rates, money available for loans, and the overall price level of the economy. Unemployment could mean a loss of income for individuals and lost production for the economy. There are three type of unemployment; frictional unemployment, cyclical unemployment, and structural unemployment. Frictional includes people that have quit their jobs or have been fired causing them to be unemployed. Cyclical is related to the economy, such as being laid off during a recession. Structural unemployment is when someone hasn't been hired because they do not have the required skills or do not live in a high employment area. The gross domestic product (GDP) is determined by total economic spending. Economic spending includes consumer, business, and government spending. Lisa states, GDP is "the market value of all final products produced in a year's time" (Huddlestun 2015.) Economic performance is measured by GDP. An increase in GDP means the economy is growing. GDP also determines if there will be inflation or not. Policy makers look at past and present GDP to formulate policies to help economic growth. If we have economic growth then we could have an increase in production of goods and services. Microeconomics according to Lisa is, "the individual components of the economy, such as costs of production, maximizing profits, and the different market structures" (Huddlestun 2015.) Businesses are the suppliers of goods and services the individual wants. Most businesses want to make a profit, or maximize their profits. The level of output must be determined to help result in the greatest profit. Cost of production has a huge part in this. There are two types of cost production; variable and fixed costs. Fixed costs are costs that do not vary with the level of output, for example a rent payment. Variable costs are cost that change with level of output, like wages and raw material.
· 2-This was a great video for the theory of supply and demand. I was able to relate particularly about the housing market as someone who was a real estate investor in 2005. It was a real experience of supply and demand. Briefly in video, the breakdown of three concepts are covered supply curve, demand curve, and equilibrium. The supply curve is an illustration for supply and price relationship. When prices go up, supplies increase as well and vice versa. The demand curve is an illustration for demand and price relationship. When prices go up, dem.
This paper explores how unemployment and self-employment impact the shadow economy during recessions and periods of economic growth using panel data from seven countries from 1999-2007. The paper finds that unemployment has a significant positive effect on the size of the shadow economy during recessions as unemployed individuals supplement their income through unreported work, but unemployment does not significantly impact the shadow economy during growth periods. Additionally, the paper finds that self-employment consistently has a statistically significant positive effect on the size of the shadow economy regardless of the economic cycle.
This document summarizes a research note from the Platt Retail Institute about testing the impact of a digital communications network (DCN) installed in bank branches. The research involved installing cameras and collecting data from 10 bank branches over 90 days. Key findings include:
1) The DCN was effective at raising customer awareness of messages.
2) Customers reported higher satisfaction levels and more positive perceptions of their bank experience with the DCN.
3) Branch productivity increased with the DCN by allowing more efficient transaction processing and potential cost reductions.
4) The DCN boosted customer awareness of products/services and increased related revenue and transaction activity.
The document discusses increasing unemployment rates and reasons for unemployment. It notes private sector employment has been negative for 10 years, with 8 million jobs lost during the recession. Unemployment duration and rates are at record highs. Reducing unemployment will require stimulating all three engines of the economy - consumers, businesses, and government - as each are currently struggling. The document proposes a non-profit jobs program as a potential "fourth engine" to reduce unemployment.
4th Qtr Year End 2011 Economic Review Feb 15 [Autosaved] [Autosaved]Gary Crosbie
2011 4th Qtr Economic Review
Economic Summary
Fed Policy
Bus Investment
Other Economic Indicators
Employment Analytics
“Falling Knife -1- Employment vs Skils”
“Falling Knife -2- The Great In-equality of Wages”
Thought Experiment
Market Forecast
Picks
4th Qtr Year End 2011 Economic Review Feb 15 [Autosaved] [Autosaved]Gary Crosbie
The document provides an economic summary and analysis for the 4th quarter of 2011. Key points include:
- Economic growth was sluggish in 2011, with GDP growth averaging 1.7% for the year, well below the 5-8% typically seen in recoveries. Unemployment improved slightly but remains high.
- This recovery has been the weakest since World War II. Job and GDP growth have been insufficient to significantly reduce unemployment.
- Business investment and hiring have been hampered by economic uncertainty, regulations, taxes. Corporations have large cash reserves but are using funds mostly for mergers and stock buybacks rather than hiring.
- The Federal Reserve has pursued monetary stimulus through policies
4th Qtr Year End 2011 Economic Review Feb 15 [Autosaved] [Autosaved]Gary Crosbie
The document provides an economic summary and analysis of the 2011 4th quarter. It finds that while some economic indicators showed improvement, overall growth remained sluggish. GDP growth increased in 2011 but was still lower than in 2009-2010. Job growth improved but remained insufficient to significantly lower the unemployment rate. The recovery has been much weaker than past post-WWII recessions. Uncertainty around fiscal policy, taxes, and regulations has hindered business investment and hiring. Overall the economic outlook remains tepid with growth expected around 2% for 2012 and unemployment remaining elevated.
- Growth in 2022 will moderate from 2021 levels as central banks and governments begin removing stimulus measures, but the economic recovery is still expected to continue with firm demand.
- Household balance sheets have significantly improved, increasing savings and wealth, which will support continued strong consumer spending. Government infrastructure spending plans will also support growth.
- Supply challenges are a greater concern than demand, as supply chains remain disrupted and key production hubs like China maintain COVID restrictions, which could keep inflation elevated for longer.
- Tight labor markets may also put upward pressure on wages, supporting consumer spending but challenging the view that inflation will remain low. Central banks are expected to withdraw stimulus gradually and are unlikely to aggressively raise rates in 2022
This paper develops a forward-looking indicator for macroeconomic uncertainty that employers are confronted with when they take decisions about the size of their workforce. The model that provides the basis for this uncertainty indicator interprets hires and lay-offs of workers as an investment into projects with uncertain return. Employers decide when to undertake this investment. Uncertainty can then be derived as a function of a labour productivity threshold above which it is profitable for employers to hire workers. The measure that is first theoretically derived is then taken to the data. Economy-wide uncertainty for G7 economies and uncertainty by economic sector for the United States are calculated from data on hiring demand and unit labour costs. The resulting quarterly time series demonstrate that in most economies hiring uncertainty went up at the onset of the Great Recession and has remained at an elevated level since then. A panel VAR analysis reveals that hiring uncertainty excercises a significant, economically sizeable and persistent effect on both the output gap and unemployment.
This document summarizes a report on the effects of minimum wage in developing countries. Key points include:
1) Evidence suggests minimum wages tend to have a small negative effect on unemployment but a positive effect on wages, especially for low-wage workers in covered sectors.
2) Effects in uncovered sectors are unclear due to limited data. Minimum wages may positively or negatively impact wages and employment in these sectors.
3) Overall, the evidence is inconclusive on whether minimum wages improve outcomes for low-paid workers across covered and uncovered sectors. More research is needed, especially on indirect effects in uncovered sectors.
Swedbank was founded in 1820, as Sweden’s first savings bank was established. Today, our heritage is visible in that we truly are a bank for each and every one and in that we still strive to contribute to a sustainable development of society and our environment. We are strongly committed to society as a whole and keen to help bring about a sustainable form of societal development. Our Swedish operations hold an ISO 14001 environmental certification, and environmental work is an integral part of our business activities.
This document provides an overview of macroeconomics and the circular flow of income through several models. It discusses key concepts such as:
1. Macroeconomics studies the economy as a whole by looking at aggregates like total output and income, whereas microeconomics looks at individual units.
2. Common macroeconomic policy objectives are full employment, price stability, economic growth, and balance of payments equilibrium.
3. The circular flow of income can be modeled in a two-sector closed economy with households and firms or a three-sector model that includes government. Savings and investment are incorporated through financial markets to achieve equilibrium.
Business Design OutlineThe StudentBA500-ManagementInstructor.docxRAHUL126667
Business Design Outline
The Student
BA500-Management
Instructor
Date
Table of Contents
1.0 Executive Summary
1.1 Objective
1.2 Mission
1.3 Keys to Success
2.0 Explain the roles, functions, and management approaches to leading
2.1 Levels of Management
2.2 Planning
2.3 Organizing
2.4 Leading
2.5 Controlling
2.6 Classical Management
2.7 Behavioral Management
2.8 Modern Management
3.0 Describe Formal and Informal Structures
3.1 Functional
3.2 Divisional
3.3 Matrix
4.0 Organizing Resources
4.1 Divide Work
4.2 Arrange Resources
4.3 Coordinate Activities
5.0 Alternative Views of Ethics
5.1 Utilitarian
5.2 Individualism
5.3 Moral-rights
5.4 Commutative Justice
6.0 Emotional Intelligence
6.1 Self-Awareness
6.2 Social Awareness
6.3 Self-Management
6.4 Motivation and Persistence
6.5 Relationship Management
7.0 Teams
7.1 Forming
7.2 Storming
7.3 Norming
7.4 Performing
7.5 Adjourning
Inflation, Unemployment and the Fed
Gross Domestic Product (GDP) is the total monetary value of goods produced and services provided in a particular country in a year. The real GDP is total monetary value of goods produced and services provided in a particular country in a year adjusted for the changes of their prices in that year. The nominal GDP total monetary value of goods produced and services provided in a particular country in a year before adjusting for the changes of their prices in that year.
This is the general increase in prices of goods and services and the subsequent fall in the purchasing power of money. Inflation in a year is calculated by divided the change in price by the price of the product in the previous year and multiplying by 100 percent. The two types of inflation are: demand-push inflation and cost-push inflation. Demand-push inflation occurs due to the faster increase in demand for goods and services as compared with the supply of these goods and services. Cost-push inflation occurs when the prices of raw materials are taxes increase and thus increasing the total cost of production and this will be transferred to goods produced in order to off-set the cost (Axilrod, 2013). During inflation borrowers benefit because the money they borrow today has more purchasing power than when they pay it back in a year or more thus hindering the lender because it worth less than the amount borrowed.--
Unemployment is a phenomenon which occurs when individuals who have skills and are looking for work but cannot find. It is normally used as a measure of how the economy is performing. Unemployment rate is always used to measure unemployment in a country in a given year and this rate is calculated as the total number of unemployed people divided by the total labor ...
ChinnIrwin International Economics, Chapter 13 (draft 76201.docxchristinemaritza
This chapter discusses how exchange rates, output, and interest rates adjust under floating exchange rates. It presents a model showing:
- How fiscal and monetary policies affect output, exchange rates, and interest rates differently under floating vs. fixed rates
- How exchange rates freely float to maintain external equilibrium in response to interest rate and trade flow changes under floating rates
- Examples of how expansionary fiscal policy in the US in the 1980s, and contractionary monetary policy, led to a stronger dollar and large trade deficits as exports were "crowded out"
This document provides an introduction to macroeconomics. It discusses the key components and concerns of macroeconomics including inflation, output growth, unemployment, and income distribution. It also covers aggregate demand and supply, the circular flow model, and the roles of households, firms, government and the international sector in the macroeconomy. Government policies aim to achieve price stability, economic growth, full employment, and an equitable distribution of income.
This document discusses unemployment and its impact on the economy. It defines unemployment as people who are able and willing to work but cannot find employment. There are two main types of unemployment discussed: frictional unemployment which occurs due to imperfect information in the job market, and demand-deficient unemployment which occurs when there is a fall in aggregate demand. The document also examines unemployment rates among youth aged 15-24 and older workers aged 55-64 from 1995-2005 in Australia, finding that youth unemployment fell significantly while older worker unemployment also declined in 2005.
The document discusses new techniques in artificial intelligence for analyzing financial markets. It introduces the A.I.4Trading project which uses machine learning and deep learning models to extract patterns from market data and provide forecasts. The Market Clock module uses clustering and classification algorithms to analyze intraday price movements and predict the probability distribution of the market's end-of-day return. By recognizing patterns in historical market trajectories, the models aim to forecast the most probable trajectory of prices for the rest of the trading day.
This document provides an analysis of the September 2017 Btp futures roll and deliverable bonds. It finds that given current yield levels and heterogeneity in the deliverable basket, changes to the futures contract coupon would not significantly impact deliverability option value. While there is theoretically potential for some deliverability around the switch point between bonds, increasing yield volatility to +/-100bps is needed to realize meaningful value. The Btp Jun26 bond, which will fall out of the September basket, faces limited potential to cheapen given it may become a target for central bank purchases. Overall, the analysis does not see major opportunities in the September basket beyond a long position in the Sep28 basis in a bull or very bearish flattening scenario.
The document analyzes potential future purchases of Italian government bonds by the European Central Bank under its Public Sector Purchase Programme (PSPP). It finds that:
1) Modeling future purchases under an objective of either maximizing duration or minimizing variance, the bulk of purchases would be concentrated in the 7-5 year maturity bucket.
2) Incorporating assumptions of future issuance and declining durations, the conclusion remains unchanged - purchases will still focus on the 7-5 year sector.
3) By December 2017, simulated portfolios show purchases distributed across maturities with the overall duration of the portfolio declining over time as shorter-dated bonds mature.
The BOJ has introduced a new monetary policy framework of "yield curve control" consisting of two components: 1) targeting long-term interest rates and 2) committing to overshooting its 2% inflation target. This represents a further step in unconventional monetary policy beyond quantitative easing (QE). By targeting long-term rates, the BOJ aims to add monetary stimulus while avoiding the limitations and market distortions of QE. However, long-term rate targeting also presents risks to the BOJ's balance sheet from unpredictable bond purchases needed to maintain its target.
This document analyzes European inflation trends over time using principal component analysis of inflation indexes from various countries. It finds that credit growth, as represented by growth in loans to corporations, correlates strongly with and can explain the long-term trend in inflation. In the short-term, deviations from this trend are explained by economic slack and price indicators like oil and commodity prices. The analysis concludes that inflation in Europe remains heavily dependent on accommodative monetary policy and that some upside is possible in inflation expectations in the near future, but underlying inflation trends remain subdued.
The document discusses bond futures, specifically:
1) Bond futures allow short sellers to deliver any eligible bond, giving them strategic delivery options. This optionality makes bond futures hybrid products.
2) Net basis can approximate the value of delivery options for the cheapest-to-deliver bond, but for other bonds it represents delivery costs plus optionality.
3) At expiration, net basis will be zero for the cheapest-to-deliver bond and positive for other bonds, representing the relative expensiveness of delivering those bonds.
This document provides a summary and analysis of recent updates from the European Central Bank (ECB) regarding their quantitative easing (QE) program and targeted longer-term refinancing operations (TLTRO). It finds that most eurozone countries have already met lending benchmarks to receive TLTRO funds at low rates, suggesting upcoming TLTRO allotments could see high demand. It also notes the ECB may gradually reduce monthly QE purchases and shift more toward supranational agency bonds as some countries approach the 33% issuer limit. Overall trades suggested include long positions in euro swap rates and select sovereign debt markets.
The document summarizes analysis on collective action clauses (Cacs) in European sovereign bonds. It finds that with 33% of debt held by the ECB, the Cac procedure for restructuring is already impaired. It also provides data on Cac holdings and pricing analysis, finding the non-Cac premium moves similarly across markets and is correlated with convexity value. Additional sections summarize the ECB's quantitative easing program, including breakdowns by country of purchases and outstanding debt.
This document discusses negative interest rate policy (NIRP) implemented by several central banks and considers whether further reductions in interest rates could be beneficial. It estimates that the effective lower bound for euro area interest rates is -1.1% to -2.6% depending on banknote denominations. While further rate cuts could boost lending and spending, they also pose risks by squeezing bank profits and disrupting financial markets. The benefits of NIRP are uncertain and depend on how much rates are reduced and whether that leads to increased credit and inflation.
The document discusses challenges facing Europe in 2017, including the lack of a common European safe asset. It proposes some potential solutions to developing a European safe asset, such as using financial engineering to create "Nasbies" or National safe bonds. The document also discusses other European challenges, such as geopolitical issues, declining population growth and economic importance relative to Asia, and the "back to the past" sentiment seen in some recent European elections. It analyzes policies from the ECB, BOJ and potential developments in 2017 that could help address these challenges, including continuing work on banking union, capital markets union, and fiscal policy coordination in Europe.
This document discusses the implementation of the European Central Bank's Public Sector Purchase Programme (PSPP) and its impact on bond markets. Some key points:
- Over €5 trillion in bonds globally are trading at negative yields, with over €9 trillion in G7 countries' bonds at negative rates.
- In the EU, €3.2 trillion or 50% of outstanding bonds are at negative yields. Low yields increase interest expenses for governments but reduce participation in bond markets.
- An increase in issuer limits under PSPP may modestly extend the time until the ECB exhausts its pool of eligible German bonds, while increasing overall portfolio duration and the percentage of government bonds held. This could affect pricing along
The Rise and Fall of Ponzi Schemes in America.pptxDiana Rose
Ponzi schemes, a notorious form of financial fraud, have plagued America’s investment landscape for decades. Named after Charles Ponzi, who orchestrated one of the most infamous schemes in the early 20th century, these fraudulent operations promise high returns with little or no risk, only to collapse and leave investors with significant losses. This article explores the nature of Ponzi schemes, notable cases in American history, their impact on victims, and measures to prevent falling prey to such scams.
Understanding Ponzi Schemes
A Ponzi scheme is an investment scam where returns are paid to earlier investors using the capital from newer investors, rather than from legitimate profit earned. The scheme relies on a constant influx of new investments to continue paying the promised returns. Eventually, when the flow of new money slows down or stops, the scheme collapses, leaving the majority of investors with substantial financial losses.
Historical Context: Charles Ponzi and His Legacy
Charles Ponzi is the namesake of this deceptive practice. In the 1920s, Ponzi promised investors in Boston a 50% return within 45 days or 100% return in 90 days through arbitrage of international reply coupons. Initially, he paid returns as promised, not from profits, but from the investments of new participants. When his scheme unraveled, it resulted in losses exceeding $20 million (equivalent to about $270 million today).
Notable American Ponzi Schemes
1. Bernie Madoff: Perhaps the most notorious Ponzi scheme in recent history, Bernie Madoff’s fraud involved $65 billion. Madoff, a well-respected figure in the financial industry, promised steady, high returns through a secretive investment strategy. His scheme lasted for decades before collapsing in 2008, devastating thousands of investors, including individuals, charities, and institutional clients.
2. Allen Stanford: Through his company, Stanford Financial Group, Allen Stanford orchestrated a $7 billion Ponzi scheme, luring investors with fraudulent certificates of deposit issued by his offshore bank. Stanford promised high returns and lavish lifestyle benefits to his investors, which ultimately led to a 110-year prison sentence for the financier in 2012.
3. Tom Petters: In a scheme that lasted more than a decade, Tom Petters ran a $3.65 billion Ponzi scheme, using his company, Petters Group Worldwide. He claimed to buy and sell consumer electronics, but in reality, he used new investments to pay off old debts and fund his extravagant lifestyle. Petters was convicted in 2009 and sentenced to 50 years in prison.
4. Eric Dalius and Saivian: Eric Dalius, a prominent figure behind Saivian, a cashback program promising high returns, is under scrutiny for allegedly orchestrating a Ponzi scheme. Saivian enticed investors with promises of up to 20% cash back on everyday purchases. However, investigations suggest that the returns were paid using new investments rather than legitimate profits. The collapse of Saivian l
An accounting information system (AIS) refers to tools and systems designed for the collection and display of accounting information so accountants and executives can make informed decisions.
Navigating Your Financial Future: Comprehensive Planning with Mike Baumannmikebaumannfinancial
Learn how financial planner Mike Baumann helps individuals and families articulate their financial aspirations and develop tailored plans. This presentation delves into budgeting, investment strategies, retirement planning, tax optimization, and the importance of ongoing plan adjustments.
A toxic combination of 15 years of low growth, and four decades of high inequality, has left Britain poorer and falling behind its peers. Productivity growth is weak and public investment is low, while wages today are no higher than they were before the financial crisis. Britain needs a new economic strategy to lift itself out of stagnation.
Scotland is in many ways a microcosm of this challenge. It has become a hub for creative industries, is home to several world-class universities and a thriving community of businesses – strengths that need to be harness and leveraged. But it also has high levels of deprivation, with homelessness reaching a record high and nearly half a million people living in very deep poverty last year. Scotland won’t be truly thriving unless it finds ways to ensure that all its inhabitants benefit from growth and investment. This is the central challenge facing policy makers both in Holyrood and Westminster.
What should a new national economic strategy for Scotland include? What would the pursuit of stronger economic growth mean for local, national and UK-wide policy makers? How will economic change affect the jobs we do, the places we live and the businesses we work for? And what are the prospects for cities like Glasgow, and nations like Scotland, in rising to these challenges?
Explore the world of investments with an in-depth comparison of the stock market and real estate. Understand their fundamentals, risks, returns, and diversification strategies to make informed financial decisions that align with your goals.
Monthly Market Risk Update: June 2024 [SlideShare]Commonwealth
Markets rallied in May, with all three major U.S. equity indices up for the month, said Sam Millette, director of fixed income, in his latest Market Risk Update.
For more market updates, subscribe to The Independent Market Observer at https://blog.commonwealth.com/independent-market-observer.
Budgeting as a Control Tool in Government Accounting in Nigeria
Being a Paper Presented at the Nigerian Maritime Administration and Safety Agency (NIMASA) Budget Office Staff at Sojourner Hotel, GRA, Ikeja Lagos on Saturday 8th June, 2024.
Dr. Alyce Su Cover Story - China's Investment Leadermsthrill
In World Expo 2010 Shanghai – the most visited Expo in the World History
https://www.britannica.com/event/Expo-Shanghai-2010
China’s official organizer of the Expo, CCPIT (China Council for the Promotion of International Trade https://en.ccpit.org/) has chosen Dr. Alyce Su as the Cover Person with Cover Story, in the Expo’s official magazine distributed throughout the Expo, showcasing China’s New Generation of Leaders to the World.
What Lessons Can New Investors Learn from Newman Leech’s Success?Newman Leech
Newman Leech's success in the real estate industry is based on key lessons and principles, offering practical advice for new investors and serving as a blueprint for building a successful career.
What Lessons Can New Investors Learn from Newman Leech’s Success?
Introducing Yellen
1. What we are looking at
Capital Markets - Structuring
Desk Rates Inflation
Cristiana Corno +39 02 72612754
Introducing Yellen Published and data as of: 3 November, 2013
Given Yellen mandate, we thought it could be interesting to summarize her views on the state of the economy and monetary policy
rules and possible market implications.
Economy
In different occasions, she has stressed the importance of addressing the labour market slack in the present moderate recovery, in
the commitment to the Fed dual mandate.
The central point is that, when the unemployment rate is so far from its natural level, «it has to take centre stage in the
conduct of monetary policy», in order not to become structural.
When acknowledging the improvement of the labour market via a reduction in the unemployment rate, (7.2% from the 2009 peak
at 10% ), she has stressed the limitations of the unemployment rate, itself, as a measure of labour market strength.
Specifically, she has pointed out the amount of reduction in the labour force due to discouraged and part-time working
people, thereby referring to a broader measure of unemployment (U6, USUDMAER index on bbg).
In chart1, below, historical behaviour of Us Unrate versus U6.
In the aftermath of the 2009 crisis, the spread between the two unemployment indicators has increased and it seems to have
stabilized at high levels (chart2).
Chart1. Historical UNRATE versus broader U6.
Chart2. Spread between the two unemployment measure.
Increasing divergence
between two
unemployment
measures due to part-time
for economic
reasons and exit from
labour force.
Spread has not come
back to pre-crisis levels,
some of it due to aging
population.
THIS DOCUMENT IS A MARKETING COMMUNICATION: It has not been prepared in accordance with legal requirements
designed to promote the independence of investment research and is also not subject to any prohibition on dealing ahead of the
dissemination of investment research. All data used are derived from Bloomberg database and elaborated by Banca IMI.
2. What we are looking at
Capital Markets - Structuring
Desk Rates Inflation
Cristiana Corno +39 02 72612754
Introducing Yellen Published and data as of: 3 November, 2013
Yellen stresses the importance of addressing a high prolonged unemployment, which eroding skill (unemployed less
employable) rises the natural rate of unemployment, with the final result of shifting the unemployment from cyclical to
structural.
In the debate over the nature of present high unemployment (cyclical rather than structural), she concludes that the most of it is
cyclical and, therefore, can be addressed by stimulating aggregate demand without stoking inflation.
When speaking about employment, she gives a broad perspective and stresses the importance to consider a range of labour market
indicators in order to judge the strength of the market.
We summarize, below, the main indicators she has pointed out in different conferences:
1. U6 unemployment rate for a more complete picture (USUDNMAER index in Bloomberg): to take in account phenomena like
part time for economic reasons and labour force exit (chart1 and 2 previous page).
2. Actual unemployment rate less CBO estimate of NAIRU, we have re-built and plotted it in chart3 below.
3. Consumer confidence ration between people who find hard/easy to find job (Concjobh Index less Concjobp Index in
Bloomberg, chart3 below)
4. Firms ability to fill jobs from NFIB survey: to identify lack of skill in the market.
5. Quit rate (Joljquit Index): to appreciate strength in labour demand (chart4).
6. Pace of employment growth.
5.00
4.00
3.00
2.00
1.00
0.00
‐1.00
‐2.00
50.00
40.00
30.00
20.00
10.00
0.00
‐10.00
‐20.00
‐30.00
‐40.00
‐50.00
hard versus easy to find
gap unrate‐nairu
01/03/1990
01/10/1990
01/05/1991
01/12/1991
01/07/1992
01/02/1993
01/09/1993
01/04/1994
01/11/1994
01/06/1995
01/01/1996
01/08/1996
01/03/1997
01/10/1997
01/05/1998
01/12/1998
01/07/1999
01/02/2000
01/09/2000
01/04/2001
01/11/2001
01/06/2002
01/01/2003
01/08/2003
01/03/2004
01/10/2004
01/05/2005
01/12/2005
01/07/2006
01/02/2007
01/09/2007
01/04/2008
01/11/2008
01/06/2009
01/01/2010
01/08/2010
01/03/2011
01/10/2011
01/05/2012
01/12/2012
Chart3. Unemployment gap and labour confidence (jobs hard to find – plenty of jobs)
5.00
4.00
3.00
2.00
1.00
0.00
‐1.00
‐2.00
gap unrate‐nairu
quit rate
01/12/2000
01/04/2001
01/08/2001
01/12/2001
01/04/2002
01/08/2002
01/12/2002
01/04/2003
01/08/2003
01/12/2003
01/04/2004
01/08/2004
01/12/2004
01/04/2005
01/08/2005
01/12/2005
01/04/2006
01/08/2006
01/12/2006
01/04/2007
01/08/2007
01/12/2007
01/04/2008
01/08/2008
01/12/2008
01/04/2009
01/08/2009
01/12/2009
01/04/2010
01/08/2010
01/12/2010
01/04/2011
01/08/2011
01/12/2011
01/04/2012
01/08/2012
01/12/2012
01/04/2013
Chart4. Unemployment gap and quit rate
Indicators point in same
direction: job market
has improved and
seems to have
stabilized.
3.00
2.50
2.00
1.50
1.00
0.50
0.00
THIS DOCUMENT IS A MARKETING COMMUNICATION: It has not been prepared in accordance with legal requirements
designed to promote the independence of investment research and is also not subject to any prohibition on dealing ahead of the
dissemination of investment research. All data used are derived from Bloomberg database and elaborated by Banca IMI.
3. What we are looking at
Capital Markets - Structuring
Desk Rates Inflation
Cristiana Corno +39 02 72612754
Introducing Yellen Published and data as of: 3 November, 2013
Yellen also highlights the increase in poverty rate, young unemployment and low real wage growth (delinquency rate still high).
As further tailwinds on the economic recovery she indicates the housing sector, pointing at small residential investment
contribution to growth (housing starts has rebounded slowly due to massive inventory chart5) in recent recovery and wealth
effects.
Chart5. Housing units starts (privately owned) and inventory
Going forward the
housing sector
contribution to Us
growth could increase,
given strong depletion
of the housing
inventory.
Monetary policy rules
The Taylor rule in its classical formulation, has been systematically overruled since the early 2000s («Taylor rule and monetary
policy: a global great deviation», Bis paper). The attempts to improve the understanding of central banks reaction function have
followed 2 directions:
1. lower level of equilibrium real rates
2. larger output gap coefficients (balanced approach or aggressive Taylor rule).
The debate has become more important in recent years in order to provide a theoretical guide and justification for quantitative
easing and unconventional tools, once the zero lower bound has been reached.
In Yellen’s words («Perspectives on monetary policy» June2012, pag13) a balanced Taylor rule, defined as:
2% 0.5*( 2%) 1*( ) t t t t R Y
where Yt is the output gap (the model is available also on BBG under Tayl, choosing as model aggressive Taylor rule) is more
consistent with Fed commitment to promote the dual mandate of maximum employment and 2% inflation target.
Yellen has gone even further showing the superiority in reaching the unemployment goal of the «optimal control policy rule»,
which minimize a quadratic loss function related to both the inflation and output gap (Woodford, chart6).
The quadratic term gives an increasing weight to the output gap when it is wide and vice versa, thereby prescribing lower rates for
longer when the output gap is wide and a quicker reaction when the output gap closes (example in chart 7, next page).
At present, Fed speeches, the use of unconventional tools like forward guidance and asset purchases seem consistent with an
optimal control policy rule regime.
In the committee words (Dec12, BoG, press release): ”When the Committee decides to begin to remove policy accommodation, it
will take a balanced approach consistent with its longer-run goals of maximum employment and inflation of 2 per cent”, therefore,
it seems, we will go back to a balanced Taylor rule, when unemployment rate goes towards 6.5%.
Based on Fed forecast, this will happen in 2014 or 2015 at latest.
THIS DOCUMENT IS A MARKETING COMMUNICATION: It has not been prepared in accordance with legal requirements
designed to promote the independence of investment research and is also not subject to any prohibition on dealing ahead of the
dissemination of investment research. All data used are derived from Bloomberg database and elaborated by Banca IMI.
4. What we are looking at
Capital Markets - Structuring
Desk Rates Inflation
Cristiana Corno +39 02 72612754
Introducing Yellen Published and data as of: 3 November, 2013
Different monetary
rules and they results:
optimal control seems
superior in achieving
lower and quicker
unemployment rate in a
context of stable
inflation.
Chart6. Different monetary policy rule and achievements in term of inflation and unemployment rate
Chart7. Monetary rules and rate prescriptions
Different monetary
rules and different
reaction functions:
optimal control reacts
more when the
unemployment gaps
closes.
In Dec12 statement Fed
said it will follow a
balanced approach once
the 6.5% threeshold is
achieved.
Summarizing we have a dove Yellen, well focused on unemployment situation and supporter of an “optimal control” policy
rule.
The risk, I see as we get to know our new Fed chairman (welcome!!!), is some volatility and risk premium getting priced in the
market if the economy surprises on the upside. In that case, probably, the 2015 area will suffer more.
THIS DOCUMENT IS A MARKETING COMMUNICATION: It has not been prepared in accordance with legal requirements
designed to promote the independence of investment research and is also not subject to any prohibition on dealing ahead of the
dissemination of investment research. All data used are derived from Bloomberg database and elaborated by Banca IMI.
5. What we are looking at
Capital Markets - Structuring
Desk Rates Inflation
Cristiana Corno +39 02 72612754
Introducing Yellen Published and data as of: 3 November, 2013
“Monetary policy: many targets, many instruments. Where do we stand?”, J.L.Yellen 16th April 2013
“A painfully slow recovery for America’s workers: causes, implications and the Federal reserve’s response”, J.L.Yellen 11th
February 2013
“Perspective on monetary policy”, J.L.Yellen 6th June 2012
“Taylor rule and optimal monetary policy”, M. Woodford January 2001
“Methods of policy accommodation at the interest rate lower bound”, M.Woodford 16th September 2012
THIS DOCUMENT IS A MARKETING COMMUNICATION: It has not been prepared in accordance with legal requirements
designed to promote the independence of investment research and is also not subject to any prohibition on dealing ahead of the
dissemination of investment research. All data used are derived from Bloomberg database and elaborated by Banca IMI.
6. What we are looking at
Capital Markets - Structuring
Desk Rates Inflation
Cristiana Corno +39 02 72612754
Introducing Yellen Published and data as of: 3 November, 2013
Disclaimer
This marketing communication has been prepared and is distributed by Banca IMI, a bank belonging to the Intesa Sanpaolo
Banking Group which is authorised to carry out investment services in Italy and is regulated by the Bank of Italy and Consob.
The information contained in this document:
constitutes a marketing communication and, as such, it has not been prepared in accordance with the legal requirements
designed to promote the independence of investment research and is not subject to any prohibition on dealing ahead of the
dissemination of investment research;
may differ from the recommendations prepared by financial analysts of the Servizio Studi e Ricerche of Intesa Sanpaolo and
distributed by Banca IMI.
The information contained herein does not constitute investment research or an implicit or explicit recommendation or advice in
relation to any investment strategy on the financial instruments or on the issuers referred to herein, or a solicitation or invitation,
or investment advice, and does not purport to offer legal, tax or any other advice. Neither the Intesa Sanpaolo Banking Group,
nor any officer, representative or employee thereof accepts any liability (for neglicence or otherwise) for any direct or
consequential losses arising from any use of information including, without limitation, the reliance on any such information
contained in this communication.
The information and views contained in this communication are based on sources believed to be reliable and in good faith.
Accordingly, Banca IMI does not implicitly or explicitly guarantee their accuracy, completeness or correctness.
The views, forecasts and estimates contained in this communication reflect the personal view of the author as of the date of its
publication. The views may differ from those of others within the Intesa Sanpaolo Banking Goup.
All prices and rates included herein are shown for indication only and should not be relied upon to re-evaluate any positions
held by any recipient of this document. For specific quotations, please contact your Banca IMI usual contact. There is no
guarantee that the future results or any other future events will be consistent with the views, forecasts and estimates contained
in this communication. Furthermore, any information included herein is subject to change by the author after the date of its
publication without any notice by Banca IMI to the person to whom this communication has been distributed.
This document is intended for distribution in Italy and in the Member States of the European Union only to professional clients
and eligible counterparties, as defined in the MiFID Directive 2004/39/EC, either as a printed document and/or electronic form.
Conflicts of interest.
The companies belonging to the Intesa Sanpaolo Group, their officers, employees or representatives and/or their
relatives may from time to time have an interest in the financial instruments, including related financial instruments,
and in the issuers or transactions referred to in this communication. Such interests may include having long or short
positions and, at any time, trading the financial instruments, including related financial instruments, or financial
instruments whose value is dependent upon, or is linked to, the financial instruments, issuers, parameters or indices
referred to herein. Such interests may also include holding significant shareholdings, holding an office, participating in
shareholders’ agreements, providing banking, credit or other financial services to the issuers of the financial
instruments referred to herein, including their controlling companies or other companies belonging to the issuer’s
group. Banca IMI may act in the capacity of sponsor, specialist, listing partner, market maker, corporate broking
and/or liquidity provider or in any other similar capacity with regard to the financial instruments, including related
financial instruments, referred to herein. Banca IMI, in the carrying out of trading activities, may have significant
directional positions in the financial instruments referred to herein or positions which are contrary to the views
expressed herein.
In consideration of the above, the companies belonging to the Intesa Sanpaolo Banking Group, its officers, employees or
representatives and/or their relatives may have positions in conflict of interest with the positions held by any investor.
This communication is for exclusive use by the person to whom has been distributed by Banca IMI and may not be reproduced
or redistributed, directly or indirectly, to any other person or published, fully or partially, for any reason whatsoever, without
the prior written consent of Banca IMI. The copyright and any other intellectual rights on data, information, opinions and
estimates referred to herein belong to the Intesa Sanpaolo Banking Group, unless otherwise stated. Such data, information,
opinions and estimates may not be fully or partially distributed or reproduced in any form, and by any means, without the prior
written consent of Banca IMI.
Any recipient of this communication is required to comply with the above requirements.
THIS DOCUMENT IS A MARKETING COMMUNICATION: It has not been prepared in accordance with legal requirements
designed to promote the independence of investment research and is also not subject to any prohibition on dealing ahead of the
dissemination of investment research. All data used are derived from Bloomberg database and elaborated by Banca IMI.