Download to read offline


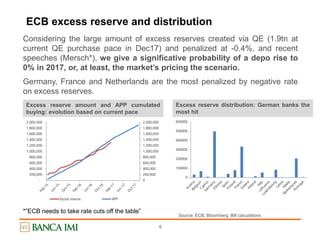
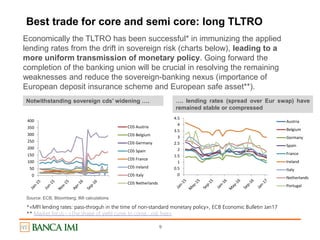
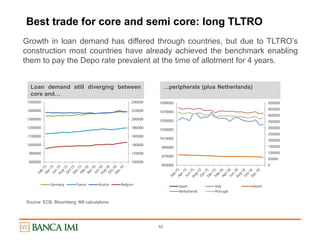
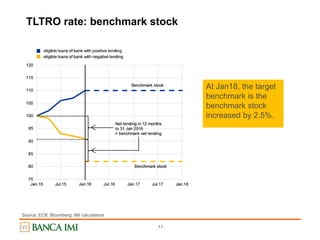
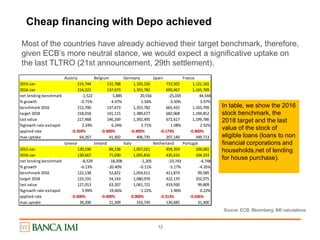
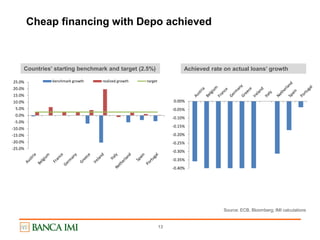
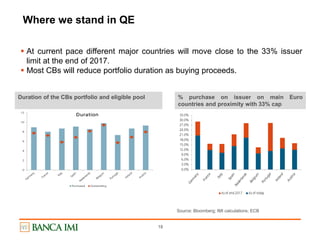
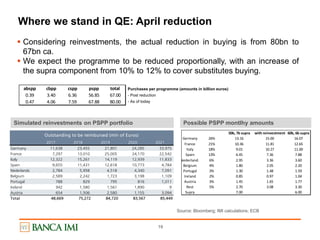
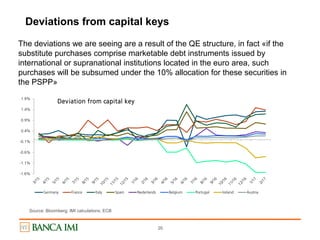
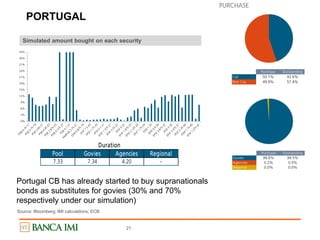
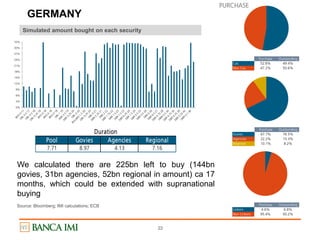
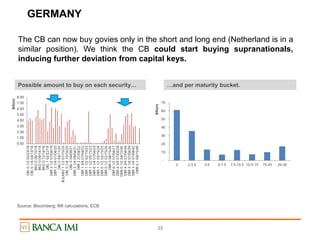
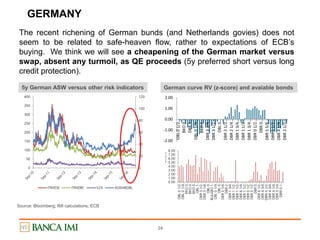
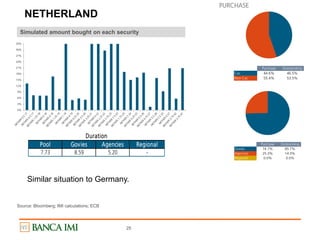
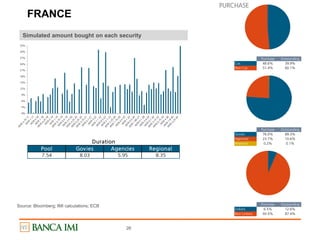
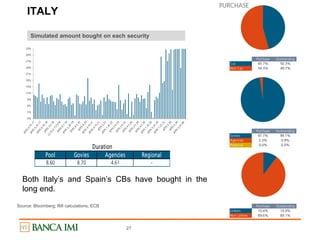
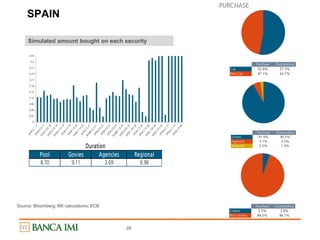
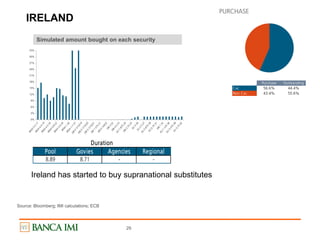


This document provides a summary and analysis of recent updates from the European Central Bank (ECB) regarding their quantitative easing (QE) program and targeted longer-term refinancing operations (TLTRO). It finds that most eurozone countries have already met lending benchmarks to receive TLTRO funds at low rates, suggesting upcoming TLTRO allotments could see high demand. It also notes the ECB may gradually reduce monthly QE purchases and shift more toward supranational agency bonds as some countries approach the 33% issuer limit. Overall trades suggested include long positions in euro swap rates and select sovereign debt markets.


