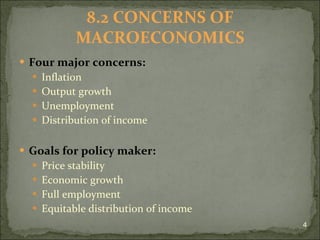
CHAPTER 8:  INTRODUCTION TO MACROECONOMICS
8.1 Introduction 8.2 Concern of Macroeconomics 8.3 Government policy 8.4 Component of Macroeconomics 8.5 Aggregate Demand & Aggregate Supply
Microeconomics examines the behavior of individual decision-making-units business firms and households. Macroeconomics  deals with the economy as a whole; it examines the behavior of economic aggregates such as aggregate income, consumption, investment, and the overall level of prices. Aggregate behavior  refers to the behavior of all households and firms together. Connection to microeconomics: Macroeconomic behavior is the sum of all the microeconomic decision made by individual households & firms 8.1 INTRODUCTION TO MACROECONOMICS
Four major concerns: Inflation Output growth Unemployment Distribution of income Goals for policy maker: Price stability Economic growth Full employment Equitable distribution of income 8.2 CONCERNS OF MACROECONOMICS
If the inflation rate is 2% annually, theoretically a RM1 pack of candy will cost???
INFLATION A continuous increase in the general price level of goods and services in the economy.  Deflation Decrease in the overall price level. Prolonged periods of deflation can be just as damaging for the economy as sustained inflation.  Stagflation Refers to a situation in an economy when there is high unemployment and rapid inflation simultaneously.
There are various degree of inflation such as: Creeping inflation  – a sustained rise in price i.e. about 2% per year Mild inflation  – a sustained rise in price of about 8% to 10% per year Hyperinflation  – occurs when monthly prices rise to 50% to 60% or more. Hyperinflation was witnessed in Germany in 1923, Hungary in 1947 and China in 1949.
Measures of Inflation: (1) GDP Deflator: A comprehensive inflation measure of all goods and services included in the GDP. GDP deflator = (nominal GDP / real GDP) x 100 Nominal GDP is dollar value of GDP in a particular year measured in prices of that same year. Real GDP is dollar value of GDP in a particular year measured in base year prices.
Measures of Inflation (continue..) (2) Consumer Price Index (CPI) The CPI is the most popular used to measure the rate of inflation. CPI is an index that measures changes in the average price of consumer goods and services. The formula below shows how the rate of inflation is computed: Inflation rate =  CPI this year – CPI previous year CPI previous year
Measures of Inflation (continue..) (3) Producer Price Index (PPI) These are indexes of prices that producers receive for products at all stages in the production process, not just the final stage. The three main categories are finished goods, intermediate materials and crude materials.
Causes of Inflation (1) Demand-Pull Inflation :  Inflation that is initiated by an increase in aggregate demand  (AD curve shift rightward).  AD increases may be due to a rise in consumer demand, or an increase in the level of government expenditure etc. (2) Cost-Push Inflation :  Inflation that is initiated by a decrease in aggregate supply  (AS curve shift leftward). AS decreases may be due to increase in the cost shock, natural disaster and so on. Will be discussed more detail in Topic 12
Effects of Inflation Distribution of Income Inflation changes the existing pattern of distribution of income and wealth in society where some groups are relatively better off than others. E.g. businessman will earn higher profits from rising prices (gain) and people who depend on fixed income will tend to lose because of inflation. Savings The value of fixed deposits, bonds, life insurance policies and money would depreciate in terms of real income.  Since inflation depreciates the value of fixed deposits, people will save less and invest in non-financial sectors such as house and land.
Effects of Inflation (continue..) (3) Production During inflation, general level of prices rises and producers make higher profits. This will lead producers to increase their level of production and investment and will create more job opportunities and reduce unemployment. Balance of Trade During inflation, many countries face a deficit balance of trade since imports are greater than exports. When price of domestic products rise, foreigners will reduce the demand for domestic products. At the same time, imports increase because the imported products are now cheaper than domestic products.
(5)  Effects on debtors/ borrowers (owes a debt)    &  creditors Inflation that is lower than expected benefits creditors and hurt the debtor and vice versa  . For example:  If I loan you RM100 to be paid back in a year, and prices increase 10%, I get back 10% less in real terms than what I loaned you. (6)  Investment risk investor could be reluctant to invest and make  long-term commitment. slow down the economic growth.  Effects of Inflation (continue..)
OUTPUT GROWTH Output growth is the growth rate of the output for the entire economy. It can be measured using the rate of GDP of that country. Business cycle: Refer to the regular fluctuations in economic activity particularly with regard to national income, employment and output. 4 phases of the business cycle: (1) Peak or Boom (3) Trough (2) Recession (4) Expansion
Expansion/ boom The period in the business cycle from a trough up to a peak, during which output and employment rise. Contraction /recession/ slump   The period in the business cycle from a peak down to a trough, during which output and employment fall.
No job, no $$$$..... How to survive???? Take it easy,  relax….
UNEMPLOYMENT Definition: A situation where labour force participations are available and willing to work but are unable to find jobs.   key indicator of the economy’s health. Unemployment rate: It can be measured using this unemployment rate indicator. The ration of the number of people unemployed to the total number of people in the labor force.  Unemployment rate =  Number of Unemployed   x  100 (%) Labour Force
Total labor force in Malaysia is  11,420.7 (‘000), 11,025.6 (‘000) people employed and total population is 15,021(‘000). What is the unemployment rate? Hints: Fourth quarter of 2009
Population Labor force Not in labor force Employed Unemployed < 16 > 55 Discourage workers
Labor Force All persons above the age of 16 and older who are employed or are actively seeking employment. Not in the labor force A person who is not looking for work, either because he or she does not want a job or has given up looking. Discouraged workers The people who want to work but cannot find jobs.  They grow discourage and  stop looking  for jobs in the short-term.
Total labor force in Malaysia is  11,420.7 (‘000), 11,025.6 (‘000) people employed and 39.51 (‘000) people looking for work. What is the unemployment rate? Hints: Fourth quarter of 2009
(1) Frictional unemployment Definition : Occurs when people are in between jobs, entering and reentering the labour force; used to denote short-run job/skill matching problems. Example :  Employers need time to learn about the talent available while the job seekers need time to learn about employment opportunities. Generally happen in short-term and voluntary. Types of Unemployment
(2)  Structural unemployment Definition : The portion of unemployment that is due to  changes in the structure  of the economy that result in a significant loss of jobs in certain industries. Example :  W orkers do not have the skills demanded by employers. Occurs because changes in tastes, technology, taxes, or competition reduce the demand for certain skills and increase the demand for other skills.
(3)  Cyclical unemployment   Definition : The increase in unemployment that occurs during recessions and depressions  . Example:   Worker laid off because recessions and gets rehired some monthly later.  (4)  Seasonal unemployment  Definition : The unemployment that arises because of  seasonal changes in labor demand during the year.  Example :  A fisherman which is unable to catch fish in winter or in rainy weather.
Natural Rate of Unemployment   The unemployment that occurs as a normal part of the functioning of the economy.  Sometimes taken as the sum of frictional unemployment and structural unemployment. Does not mean zero unemployment but low unemployment, with estimates ranging from 4% to 6% of the unemployment rate.
Productivity inefficient Less goods and services are being produced then it is possible to produce. Lower living standard Less income in a given region as people are working. Less spending on goods and services. Social and political problem People have more free time and lower incomes. May engage in troublesome social and political activities.  Lead to more crimes Effects of Unemployment
Government tax The government will earn less from direct taxation because people are not earning and indirect taxation revenue will also fall because people are not spending as well. Government budget will also be affected because less income and higher spending by government. Investment Firm lose confidence in the economy and do not put money into longer-term projects. Effects of Unemployment
DISTRIBUTION OF INCOME Income distribution  is how a nation’s total economy is distributed amongst its population.  It has always been a central concern of economic theory and economic policy.  Government need to consider policies to improve the distribution of income and wealth because the benefit s of growth for the poor may be diminished if the distribution of income worsens.
Three kinds of policies: Fiscal policy Refer to government policies concerning taxes and spending Monetary policy Consist of tools used by the central bank to control the quantity of money in the economy Supply-side policy Government policies that focus on stimulating aggregate supply  . 8.3 GOVERNMENT POLICIES
Macroeconomics focuses on four   groups: Households Firms Government Rest of the world (International sector) 8.4 THE COMPONENTS OF MACROECONOMICS
Circular Flow Diagram   Definition : shows the economic interaction between the four sectors in the economy.  Everyone’s expenditure is someone else’s receipt.  Every transaction must have 2 sides.
The Circular Flow Diagram
Household: Owns/sell all the factors of production. Work in the firm and for the government where they receive wages for their services. Also receive other payment from government such as transfer payment  and subsidies. Spends income by buying goods and services produced by firms and also pay tax for government. Firm: Buy the factors of production from household. Produce and sell goods and services to household and government – earn income. Firms pay for services of factors of production; wages, rent, interest and profit.
Government: Collect taxes from households and firms. Government revenues will use to spend on welfare activities, provision of public utility services, and so on. Will make payments to households in the form wages, interest and transfer payment and buy goods and services from firms. Rest of the World: Households will buy goods and services from rest of the world. People from foreign country will also buy exported goods from domestic firms.
Households, firms, the government, & the rest of the world all interact in 3 different market arenas: Input Market Output Market Financial market (1) Input Market Households are sellers; sell factors of production. Firms and government are buyers; buy the factors of production from household. Market Arenas
(2) Output Market Firms are sellers; sell goods and services produces Households & the government are buyers; buy goods and services from firms. (3) Financial Market Households buy stocks & bonds from firms. Households  s upply funds to this market in the expectation of earning income, & also demand (borrow) funds from this market. Firms, government, & the rest of the world also engage in borrowing & lending, coordinated by financial institutions.
AD  is the total DD for goods & services in an economy. AS  is the total SS of goods and services in an economy. AD & AS curves are more complex than simple market DD & market SS curves. 8.5 AGGREGATE DEMAND & AGGREGATE SUPPLY
THANK YOU

Chap8

  • 1.
    CHAPTER 8: INTRODUCTION TO MACROECONOMICS
  • 2.
    8.1 Introduction 8.2Concern of Macroeconomics 8.3 Government policy 8.4 Component of Macroeconomics 8.5 Aggregate Demand & Aggregate Supply
  • 3.
    Microeconomics examines thebehavior of individual decision-making-units business firms and households. Macroeconomics deals with the economy as a whole; it examines the behavior of economic aggregates such as aggregate income, consumption, investment, and the overall level of prices. Aggregate behavior refers to the behavior of all households and firms together. Connection to microeconomics: Macroeconomic behavior is the sum of all the microeconomic decision made by individual households & firms 8.1 INTRODUCTION TO MACROECONOMICS
  • 4.
    Four major concerns:Inflation Output growth Unemployment Distribution of income Goals for policy maker: Price stability Economic growth Full employment Equitable distribution of income 8.2 CONCERNS OF MACROECONOMICS
  • 5.
    If the inflationrate is 2% annually, theoretically a RM1 pack of candy will cost???
  • 6.
    INFLATION A continuousincrease in the general price level of goods and services in the economy. Deflation Decrease in the overall price level. Prolonged periods of deflation can be just as damaging for the economy as sustained inflation. Stagflation Refers to a situation in an economy when there is high unemployment and rapid inflation simultaneously.
  • 7.
    There are variousdegree of inflation such as: Creeping inflation – a sustained rise in price i.e. about 2% per year Mild inflation – a sustained rise in price of about 8% to 10% per year Hyperinflation – occurs when monthly prices rise to 50% to 60% or more. Hyperinflation was witnessed in Germany in 1923, Hungary in 1947 and China in 1949.
  • 8.
    Measures of Inflation:(1) GDP Deflator: A comprehensive inflation measure of all goods and services included in the GDP. GDP deflator = (nominal GDP / real GDP) x 100 Nominal GDP is dollar value of GDP in a particular year measured in prices of that same year. Real GDP is dollar value of GDP in a particular year measured in base year prices.
  • 9.
    Measures of Inflation(continue..) (2) Consumer Price Index (CPI) The CPI is the most popular used to measure the rate of inflation. CPI is an index that measures changes in the average price of consumer goods and services. The formula below shows how the rate of inflation is computed: Inflation rate = CPI this year – CPI previous year CPI previous year
  • 10.
    Measures of Inflation(continue..) (3) Producer Price Index (PPI) These are indexes of prices that producers receive for products at all stages in the production process, not just the final stage. The three main categories are finished goods, intermediate materials and crude materials.
  • 11.
    Causes of Inflation(1) Demand-Pull Inflation : Inflation that is initiated by an increase in aggregate demand (AD curve shift rightward). AD increases may be due to a rise in consumer demand, or an increase in the level of government expenditure etc. (2) Cost-Push Inflation : Inflation that is initiated by a decrease in aggregate supply (AS curve shift leftward). AS decreases may be due to increase in the cost shock, natural disaster and so on. Will be discussed more detail in Topic 12
  • 12.
    Effects of InflationDistribution of Income Inflation changes the existing pattern of distribution of income and wealth in society where some groups are relatively better off than others. E.g. businessman will earn higher profits from rising prices (gain) and people who depend on fixed income will tend to lose because of inflation. Savings The value of fixed deposits, bonds, life insurance policies and money would depreciate in terms of real income. Since inflation depreciates the value of fixed deposits, people will save less and invest in non-financial sectors such as house and land.
  • 13.
    Effects of Inflation(continue..) (3) Production During inflation, general level of prices rises and producers make higher profits. This will lead producers to increase their level of production and investment and will create more job opportunities and reduce unemployment. Balance of Trade During inflation, many countries face a deficit balance of trade since imports are greater than exports. When price of domestic products rise, foreigners will reduce the demand for domestic products. At the same time, imports increase because the imported products are now cheaper than domestic products.
  • 14.
    (5) Effectson debtors/ borrowers (owes a debt) & creditors Inflation that is lower than expected benefits creditors and hurt the debtor and vice versa . For example: If I loan you RM100 to be paid back in a year, and prices increase 10%, I get back 10% less in real terms than what I loaned you. (6) Investment risk investor could be reluctant to invest and make long-term commitment. slow down the economic growth. Effects of Inflation (continue..)
  • 15.
    OUTPUT GROWTH Outputgrowth is the growth rate of the output for the entire economy. It can be measured using the rate of GDP of that country. Business cycle: Refer to the regular fluctuations in economic activity particularly with regard to national income, employment and output. 4 phases of the business cycle: (1) Peak or Boom (3) Trough (2) Recession (4) Expansion
  • 16.
    Expansion/ boom Theperiod in the business cycle from a trough up to a peak, during which output and employment rise. Contraction /recession/ slump The period in the business cycle from a peak down to a trough, during which output and employment fall.
  • 17.
    No job, no$$$$..... How to survive???? Take it easy, relax….
  • 18.
    UNEMPLOYMENT Definition: Asituation where labour force participations are available and willing to work but are unable to find jobs. key indicator of the economy’s health. Unemployment rate: It can be measured using this unemployment rate indicator. The ration of the number of people unemployed to the total number of people in the labor force. Unemployment rate = Number of Unemployed x 100 (%) Labour Force
  • 19.
    Total labor forcein Malaysia is 11,420.7 (‘000), 11,025.6 (‘000) people employed and total population is 15,021(‘000). What is the unemployment rate? Hints: Fourth quarter of 2009
  • 20.
    Population Labor forceNot in labor force Employed Unemployed < 16 > 55 Discourage workers
  • 21.
    Labor Force Allpersons above the age of 16 and older who are employed or are actively seeking employment. Not in the labor force A person who is not looking for work, either because he or she does not want a job or has given up looking. Discouraged workers The people who want to work but cannot find jobs. They grow discourage and stop looking for jobs in the short-term.
  • 22.
    Total labor forcein Malaysia is 11,420.7 (‘000), 11,025.6 (‘000) people employed and 39.51 (‘000) people looking for work. What is the unemployment rate? Hints: Fourth quarter of 2009
  • 23.
    (1) Frictional unemploymentDefinition : Occurs when people are in between jobs, entering and reentering the labour force; used to denote short-run job/skill matching problems. Example : Employers need time to learn about the talent available while the job seekers need time to learn about employment opportunities. Generally happen in short-term and voluntary. Types of Unemployment
  • 24.
    (2) Structuralunemployment Definition : The portion of unemployment that is due to changes in the structure of the economy that result in a significant loss of jobs in certain industries. Example : W orkers do not have the skills demanded by employers. Occurs because changes in tastes, technology, taxes, or competition reduce the demand for certain skills and increase the demand for other skills.
  • 25.
    (3) Cyclicalunemployment Definition : The increase in unemployment that occurs during recessions and depressions . Example: Worker laid off because recessions and gets rehired some monthly later. (4) Seasonal unemployment Definition : The unemployment that arises because of seasonal changes in labor demand during the year. Example : A fisherman which is unable to catch fish in winter or in rainy weather.
  • 26.
    Natural Rate ofUnemployment The unemployment that occurs as a normal part of the functioning of the economy. Sometimes taken as the sum of frictional unemployment and structural unemployment. Does not mean zero unemployment but low unemployment, with estimates ranging from 4% to 6% of the unemployment rate.
  • 27.
    Productivity inefficient Lessgoods and services are being produced then it is possible to produce. Lower living standard Less income in a given region as people are working. Less spending on goods and services. Social and political problem People have more free time and lower incomes. May engage in troublesome social and political activities. Lead to more crimes Effects of Unemployment
  • 28.
    Government tax Thegovernment will earn less from direct taxation because people are not earning and indirect taxation revenue will also fall because people are not spending as well. Government budget will also be affected because less income and higher spending by government. Investment Firm lose confidence in the economy and do not put money into longer-term projects. Effects of Unemployment
  • 29.
    DISTRIBUTION OF INCOMEIncome distribution is how a nation’s total economy is distributed amongst its population. It has always been a central concern of economic theory and economic policy. Government need to consider policies to improve the distribution of income and wealth because the benefit s of growth for the poor may be diminished if the distribution of income worsens.
  • 30.
    Three kinds ofpolicies: Fiscal policy Refer to government policies concerning taxes and spending Monetary policy Consist of tools used by the central bank to control the quantity of money in the economy Supply-side policy Government policies that focus on stimulating aggregate supply . 8.3 GOVERNMENT POLICIES
  • 31.
    Macroeconomics focuses onfour groups: Households Firms Government Rest of the world (International sector) 8.4 THE COMPONENTS OF MACROECONOMICS
  • 32.
    Circular Flow Diagram Definition : shows the economic interaction between the four sectors in the economy. Everyone’s expenditure is someone else’s receipt. Every transaction must have 2 sides.
  • 33.
  • 34.
    Household: Owns/sell allthe factors of production. Work in the firm and for the government where they receive wages for their services. Also receive other payment from government such as transfer payment and subsidies. Spends income by buying goods and services produced by firms and also pay tax for government. Firm: Buy the factors of production from household. Produce and sell goods and services to household and government – earn income. Firms pay for services of factors of production; wages, rent, interest and profit.
  • 35.
    Government: Collect taxesfrom households and firms. Government revenues will use to spend on welfare activities, provision of public utility services, and so on. Will make payments to households in the form wages, interest and transfer payment and buy goods and services from firms. Rest of the World: Households will buy goods and services from rest of the world. People from foreign country will also buy exported goods from domestic firms.
  • 36.
    Households, firms, thegovernment, & the rest of the world all interact in 3 different market arenas: Input Market Output Market Financial market (1) Input Market Households are sellers; sell factors of production. Firms and government are buyers; buy the factors of production from household. Market Arenas
  • 37.
    (2) Output MarketFirms are sellers; sell goods and services produces Households & the government are buyers; buy goods and services from firms. (3) Financial Market Households buy stocks & bonds from firms. Households s upply funds to this market in the expectation of earning income, & also demand (borrow) funds from this market. Firms, government, & the rest of the world also engage in borrowing & lending, coordinated by financial institutions.
  • 38.
    AD isthe total DD for goods & services in an economy. AS is the total SS of goods and services in an economy. AD & AS curves are more complex than simple market DD & market SS curves. 8.5 AGGREGATE DEMAND & AGGREGATE SUPPLY
  • 39.