Download to read offline

![4
THIS DOCUMENT IS A MARKETING COMMUNICATION: It has not been prepared in accordance with legal requirements
designed to promote the independence of investment research and is also not subject to any prohibition on dealing
ahead of the dissemination of investment research.
If banks decide to move out on the credit curve and buy riskier assets relative to holding reserves with a
central bank at a negative return, a portfolio rebalancing may occur. Thus, a central bank may want to
check how much credit risk premium is left to be exploited. With risk premium falling, the cost of capital
should fall too, with a positive impact on funding conditions for economic agents. At the same time,
lower rates along the maturity spectrum may alter households’ time preferences and induce them to
spend more.
Another potential channel of transmission may be the signalling effect, if the move into negative rates is
perceived as a commitment from the central bank to meet its inflation target. Thus, the measure may
contribute to reducing overall uncertainty, together with easing financial conditions and encouraging
spending decisions.
The exchange rate channel is potentially relevant if negative rates are successful in halting capital inflows.
Denmark and Switzerland have so far been successful in stabilising the exchange rate against the euro.
But, it seems that the marginal benefits in terms of exchange rate stabilisation are decreasing. Moreover,
on a global scale, engaging a currency war by cutting rates into more negative territory is equivalent to a
zero sum game.
The potential costs of switching to a NIRP regime
But when deciding to cut rates into negative or more negative territory, costs should not be
underestimated. Negative rates generally have a negative effect on banks’ profitability, as they tend to
erode net interest margins. ECB executive board member Benoît Coeuré described the mechanism
through which negative rates may affect banks’ profitability: as policy rates fall into negative territory,
money market rates should fall too, putting pressure on lending rates. But, the banks are unlikely to pass
negative rates on to deposits of households and non-financial corporates. ECB board member Coeuré
illustrated the mechanism quite effectively: “banks’ lending rates fall linearly but their funding costs are
non-linear – as interest rates on retail deposits are sticky – which puts a squeeze on net interest margins”.
For households in particular, it should be easy to switch from deposits to cash if they are charged to hold
money with the banks. For non-financial corporates, it is more difficult to switch out of bank accounts if
the remuneration turns negative. Indeed, the experience of Denmark and Sweden confirms that rates on
non-financial corporates’ deposits fall more than the rate on household deposits. The impact on banks’
profitability of negative rates will also depend on how much the cost of market funding falls, with market
rates and credit spreads adjusting to negative rates. In the its January 2016 Economic Bulletin (see Recent
developments in the composition and cost of bank funding in the euro area, pp. 26-41), the ECB
concludes that the monetary policy measures adopted since 2012 have contributed to reduce the cost of
wholesale funding. In the Euro area, it is possible that the cost of market funding will increase, as the new
regulatory regime and the coming into force of the BRRD (Banks’ resolution directive) may initially put
pressure on the cost of funding. The ECB notes that, “the reduction in the risk of further systemic crises
will lead to a more stable banking system and robust transmission mechanism”. The ECB drawing from ad
hoc questions from the April and October 2015 Bank Lending surveys notes that, “the APP, together with
negative rates on excess reserves, is likely to lead to lower unit margins but these effects are so far partly
offset by the capital gains on securities held by banks”. Moreover, the impact of negative rates on banks’
profitability will also depend on the loan structure (on the share of fixed rate loans as a percentage of the
total), on the impact of negative rates on lending volumes, and credit quality improvements (lower default
rates associated with lower interest charges).
Negative rates can potentially] put pressure on pension, insurance funds and asset managers, which may
find it hard to meet the guaranteed returned on their liabilities in a regime of declining short- and longer-
term returns. Moreover, there could be perverse effects on money market funds, with managers finding it
hard to provide investors with liquidity and capital preservation in a falling returns environment. The
Danish experience suggests, however, that money markets can pass through the negative rates without
massive disruptions in the market.
Also, negative interest rates may result in legal and operational challenges. With rates staying in negative
territory for an extended period of time, there might be a need to redesign contracts to deal with the
issue of the payment of interest on debt securities. Societies tend to operate under positive interest rate](https://image.slidesharecdn.com/nirp-170221094418/85/Nirp-4-320.jpg)
![5
THIS DOCUMENT IS A MARKETING COMMUNICATION: It has not been prepared in accordance with legal requirements
designed to promote the independence of investment research and is also not subject to any prohibition on dealing
ahead of the dissemination of investment research.
conventions. For example, people can prepay tax obligations paying zero interest while they would be
charged a negative interest rate on their current account holdings. Together with the convention that all
prepayments of debt carry a zero interest rate, creditors generally have the option to decide when to
collect a debt. But in a negative interest rate regime, creditors may want to collect debt slowly in order to
avoid the negative interest charge during the time the obligation actually comes to maturity. For example,
if you receive a cheque, you may want to leave it undeposited for as long as possible with possible costs
for the cheque writer (unplanned overdraft costs). The lower interest rates fall into negative territory and
the longer they stay there, the more likely that legal distortions and economic frictions become
quantitatively relevant. In the case of the United States, Garbade and McAndrews (2012) found that with
money markets rates at -0.5% for an extended period of time there could be innovations to circumvent
negative interest rates. Such innovations could include the creation of new institutions to store cash.
Last but not least, negative interest rates could send the wrong signal and be interpreted as a sign that a
central bank has no other means of meeting its inflation target. The risk is that as nominal rates fall into
negative rate[territory], volatility increases and medium- to longer-term inflation expectations fall too.
Thus, in conclusion, there is ample uncertainty on whether negative interest rate policy can contribute to
a reduction in lending rates and credit spreads, or stimulate credit availability, growth and inflation. At the
same time, a negative interest rate policy carries more risk regarding financial stability, legal friction and
resource allocations than can be prima facie understood, Following a gradual approach in order to let the
system adjust to the new policy regime may be desirable, and it is indeed the approach the ECB has
followed so far. Indeed, ECB Vice President Constancio on December 31 2015 stated that “I very much
hope and believe that negative deposit rates are a temporary phenomenon worldwide and not a
permanent feature of normal monetary policy.”
Other central bank experiences with negative rates
As NIRP policies are a relatively new tool, and provided that the transmission to the economy depends on
the pass-through of the rate cut to money market rates and on term and risk premiums, we have looked
at the experiences of the Danish, Swiss and Swedish central banks, which have more experience
operating with negative rates than the ECB, to understand whether the way a central bank implements
the negative interest rate regime had different implications for the transmission onto money markets and
banks profitability. Indeed, ECB board member Coeuré said (02/03/2016) that the “ECB is carefully
studying the schemes used in other jurisdictions to mitigate possible adverse effects for the bank’s lending
channel”.
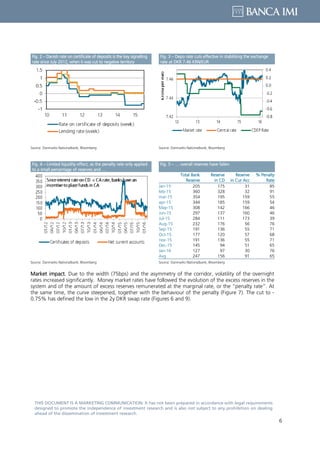
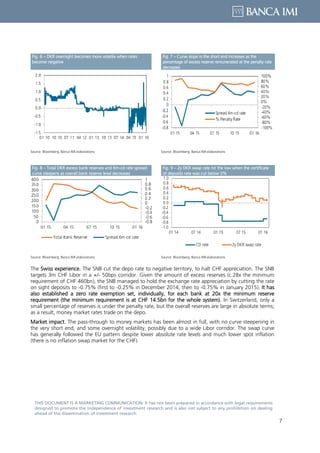
The Danish experience. Denmark’s was the first central bank to cut the rate on the certificate of deposits
into negative territory in July 2012 (to -0.20%), with the decision taken solely based on the consideration
of maintaining Denmark’s fixed exchange rate regime of 7.46 kroner/1.0 euro with a fluctuation band of
+/- 2.25 percent. The rate on certificates of deposit was lowered to as low as -0.75% in February 2015
and then raised to -0.65% this past January. The discount rate has always been left at zero. Thus, the
certificate of deposit rate has become the key signalling rate. The certificate of deposit rate is applied on
reserves in excess of a common current account limit. Reserves up to the common current account limit
are charged at zero interest. Only if the systemic reserves exceed the common limit will individual banks’
reserves in excess of 0.75% of an institution’s deposit base be converted into certificates of deposit
charged at -0.65%. The cap on current accounts has been increased to protect banks’ profitability from
DKR 37bn to DKR 173bn and are now back at DKR 31.4bn. The liquidity reallocation effect in Denmark
has been virtually non-existent, as the central bank left the rate on current accounts at zero. As a result,
banks shifted reserves from the deposit facility to current accounts.](https://image.slidesharecdn.com/nirp-170221094418/85/Nirp-5-320.jpg)

This document discusses negative interest rate policy (NIRP) implemented by several central banks and considers whether further reductions in interest rates could be beneficial. It estimates that the effective lower bound for euro area interest rates is -1.1% to -2.6% depending on banknote denominations. While further rate cuts could boost lending and spending, they also pose risks by squeezing bank profits and disrupting financial markets. The benefits of NIRP are uncertain and depend on how much rates are reduced and whether that leads to increased credit and inflation.


