The document presents an empirical investigation into what constitutes an agile organization, capturing various aspects such as values, conditions, capabilities, and activities that define agility. It details insights drawn from participants across different roles, sizes, locations, and customer types, aiming to delineate characteristics that foster agile practices in organizations. The findings contribute to a better understanding of agility in the context of business management and inform further research in the field.
![2. Participants
Altogether, the survey has been viewed by 1522 persons and 768 of them answered at least one question.
Among those respondents, 490 completed the questionnaire. Unfortunately, 53 invalid responses had to be
excluded from analysis because they do not belong to the focused industry of software development and IT
services. Hence, 437 responses were included for further analysis (see figure 2.1). All following numbers,
figures, and tables apply to these 437 responses.
In addition, figure 2.1 shows the roles of all participants within their organization. More than one third of
them are Enterprise and IT Architects, followed by Chief Executive Officers at nearly 30 %. Chief Informa-tion
Officers, Chief Technology Officers, and other IT and ITC Managers sum up to more than 20 %. Roles
summarized as Other include leading positions like Managerial Board Members, Chief Financial Officers,
Technical Directors, or Senior Managers of Quality Management, Research & Development, Sales, IT, and
others. In general, all participants hold leading or managerial positions in their organizations, and hence it
is assured that they are able to assess their organization from an extensive point of view and are suitable to
answer the survey questions.
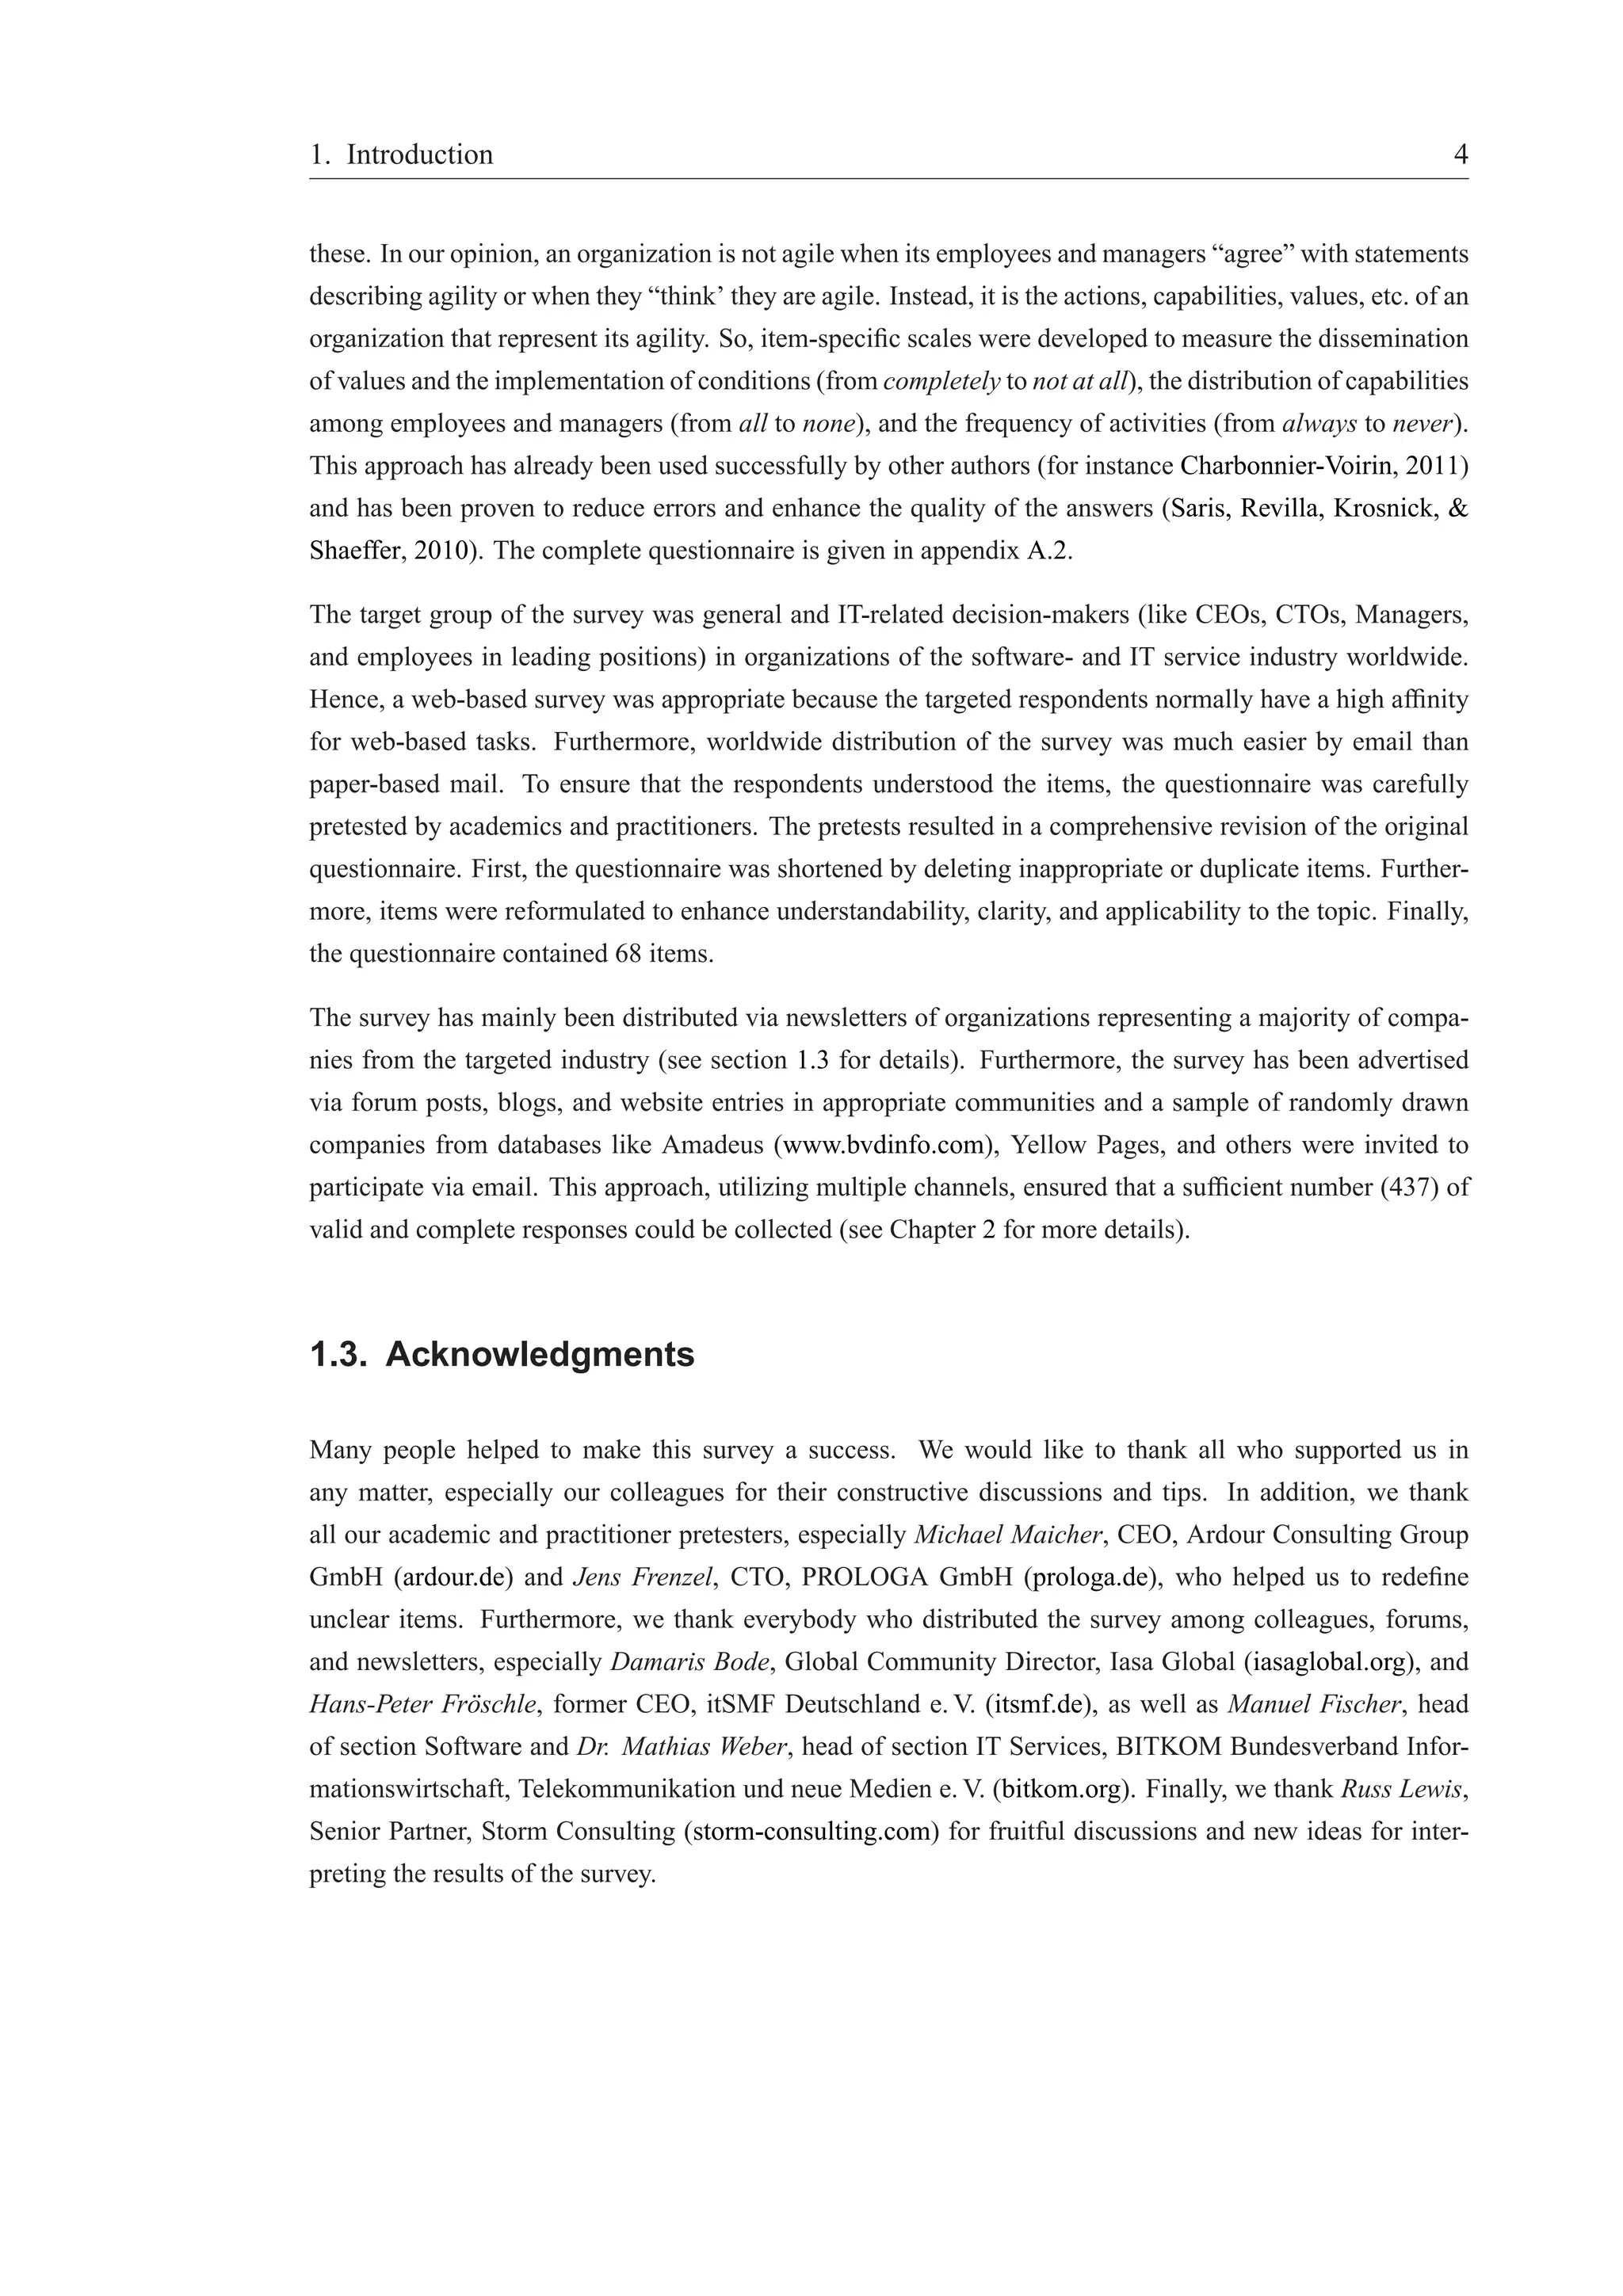
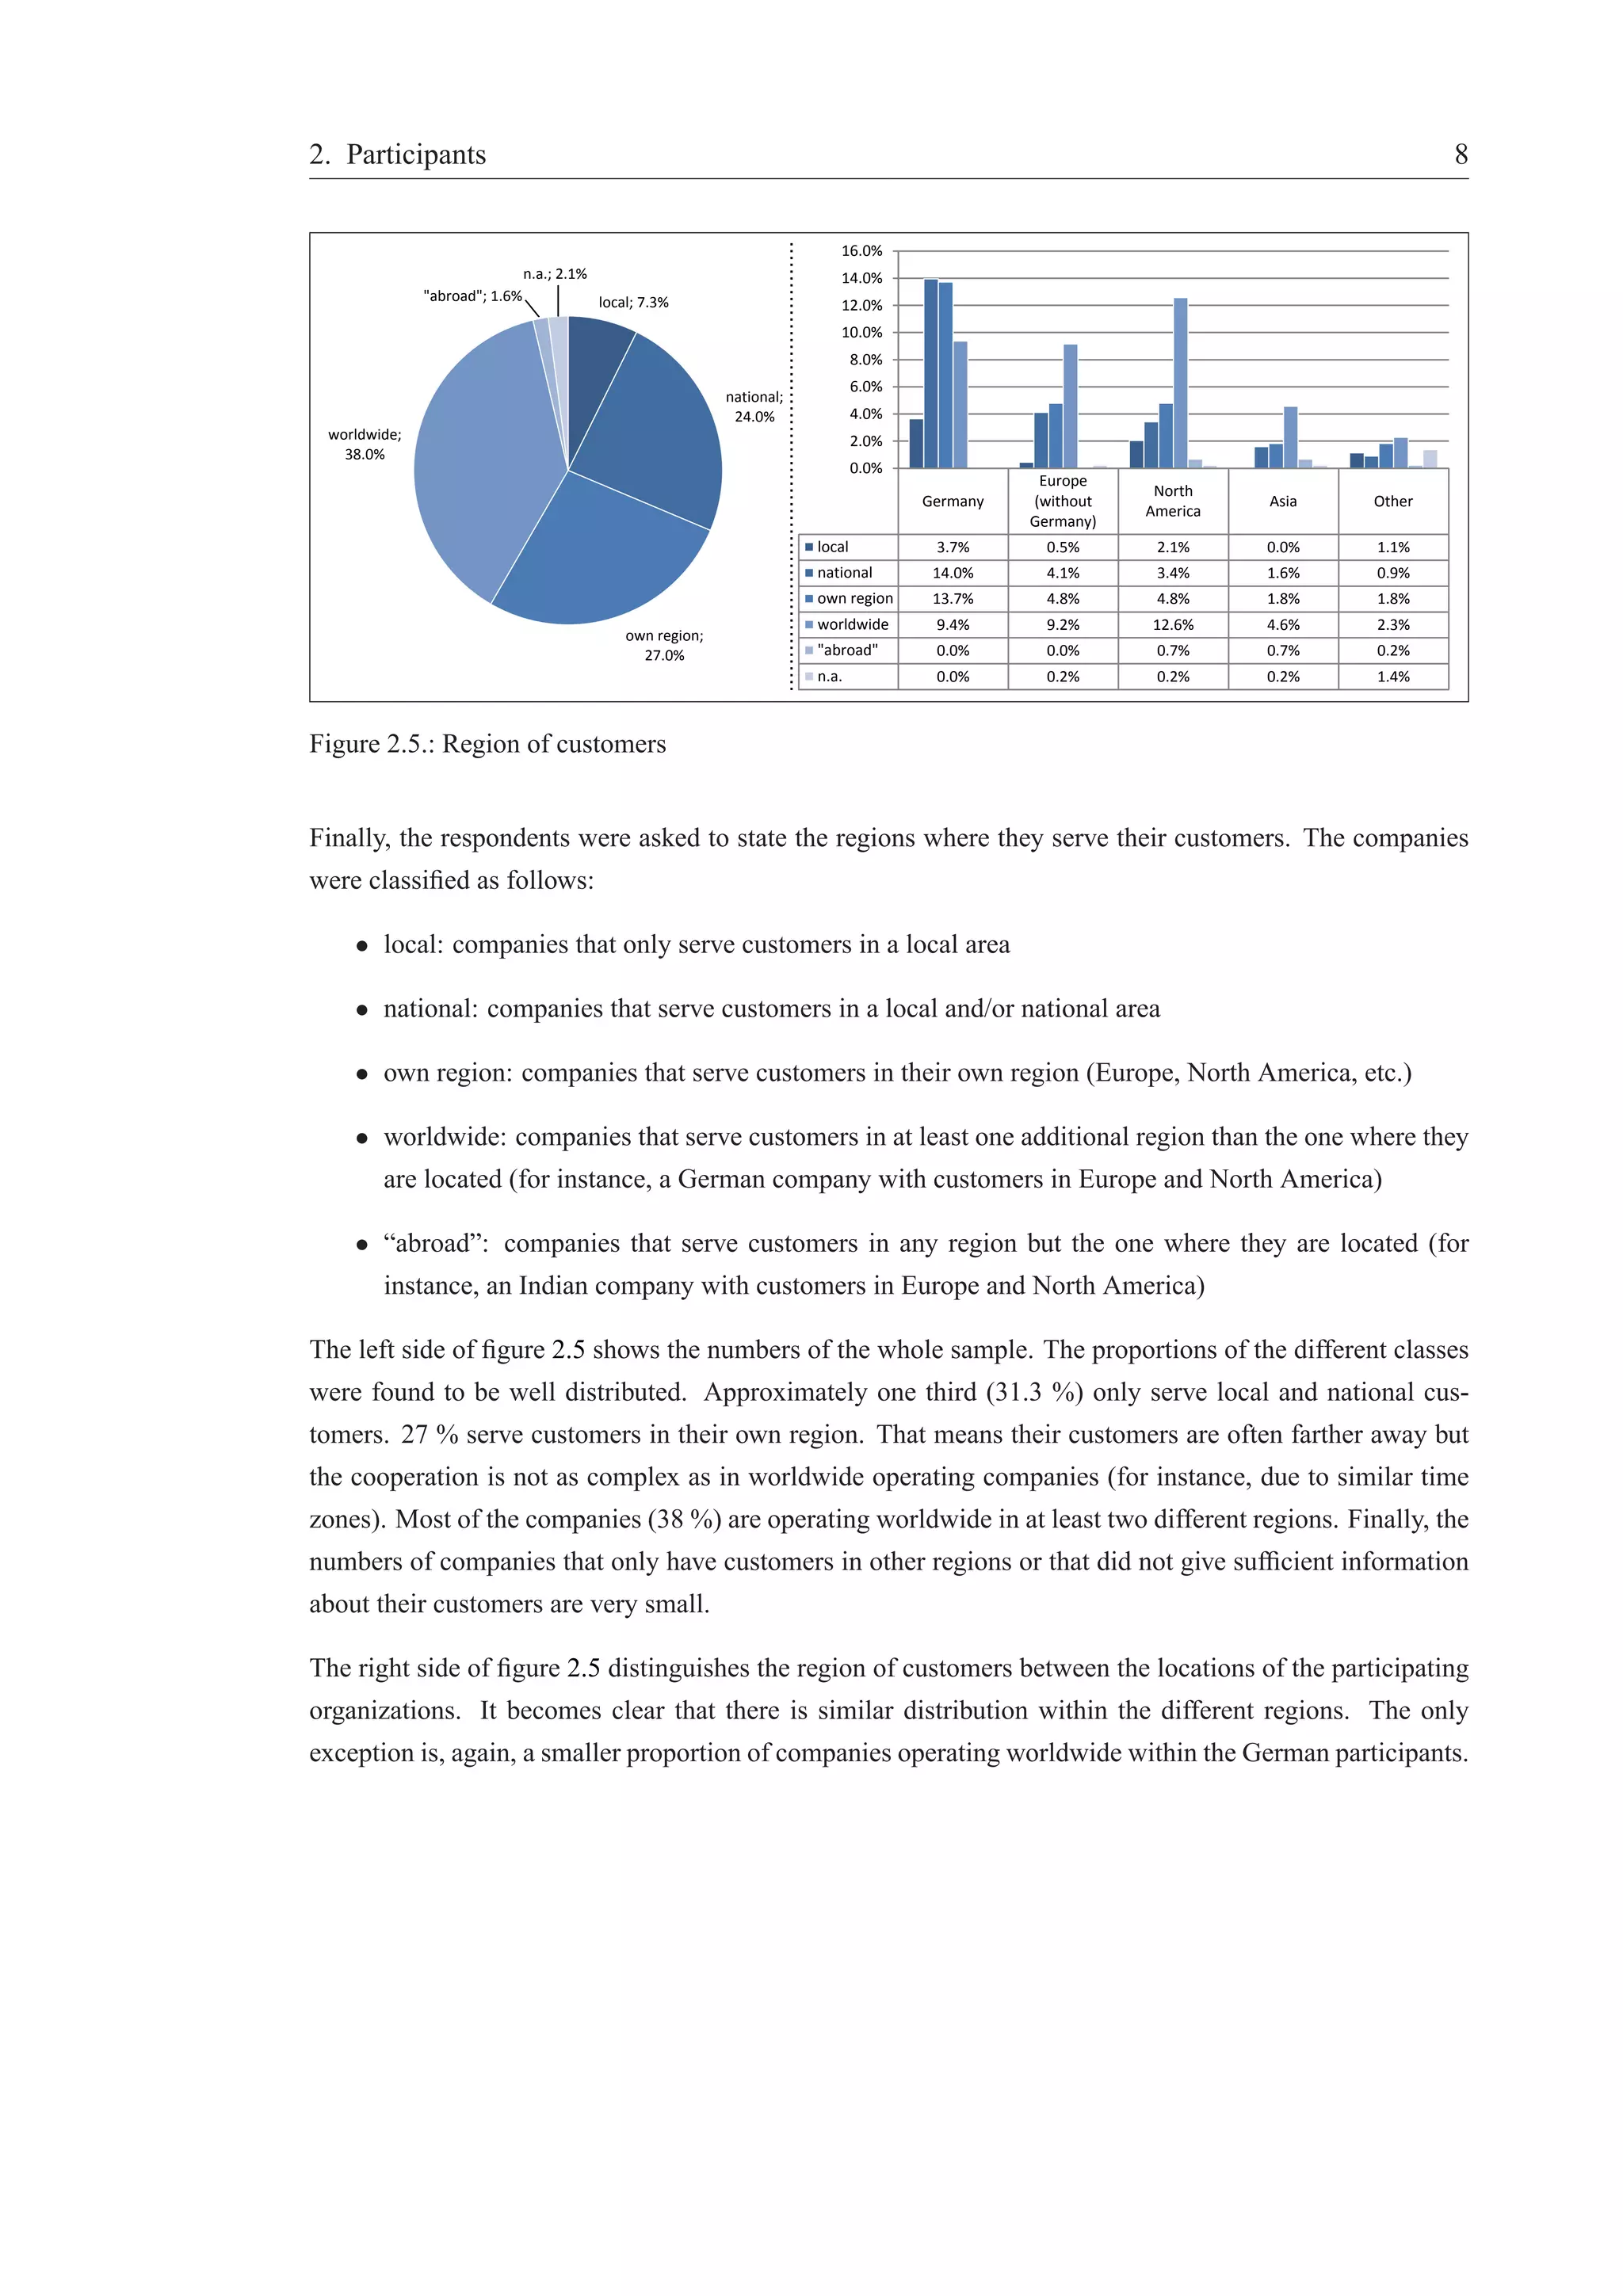
Figure 2.2 shows the fields of activity of the participating organizations. Most of them are nearly equally
distributed within Programming and Software Development (43.1 %), and IT Services and Consultancy
(41.6 %). Computer Facilities Management (6.5 %) is less represented. Other includes a mix of different
industries, for instance banking, telecommunications, commerce, and advertising, among others. However,
all are closely connected with the software and IT service industry or even operate in one of the other three
fields, too. Over all, 239 organizations are active in more than one field of activity.
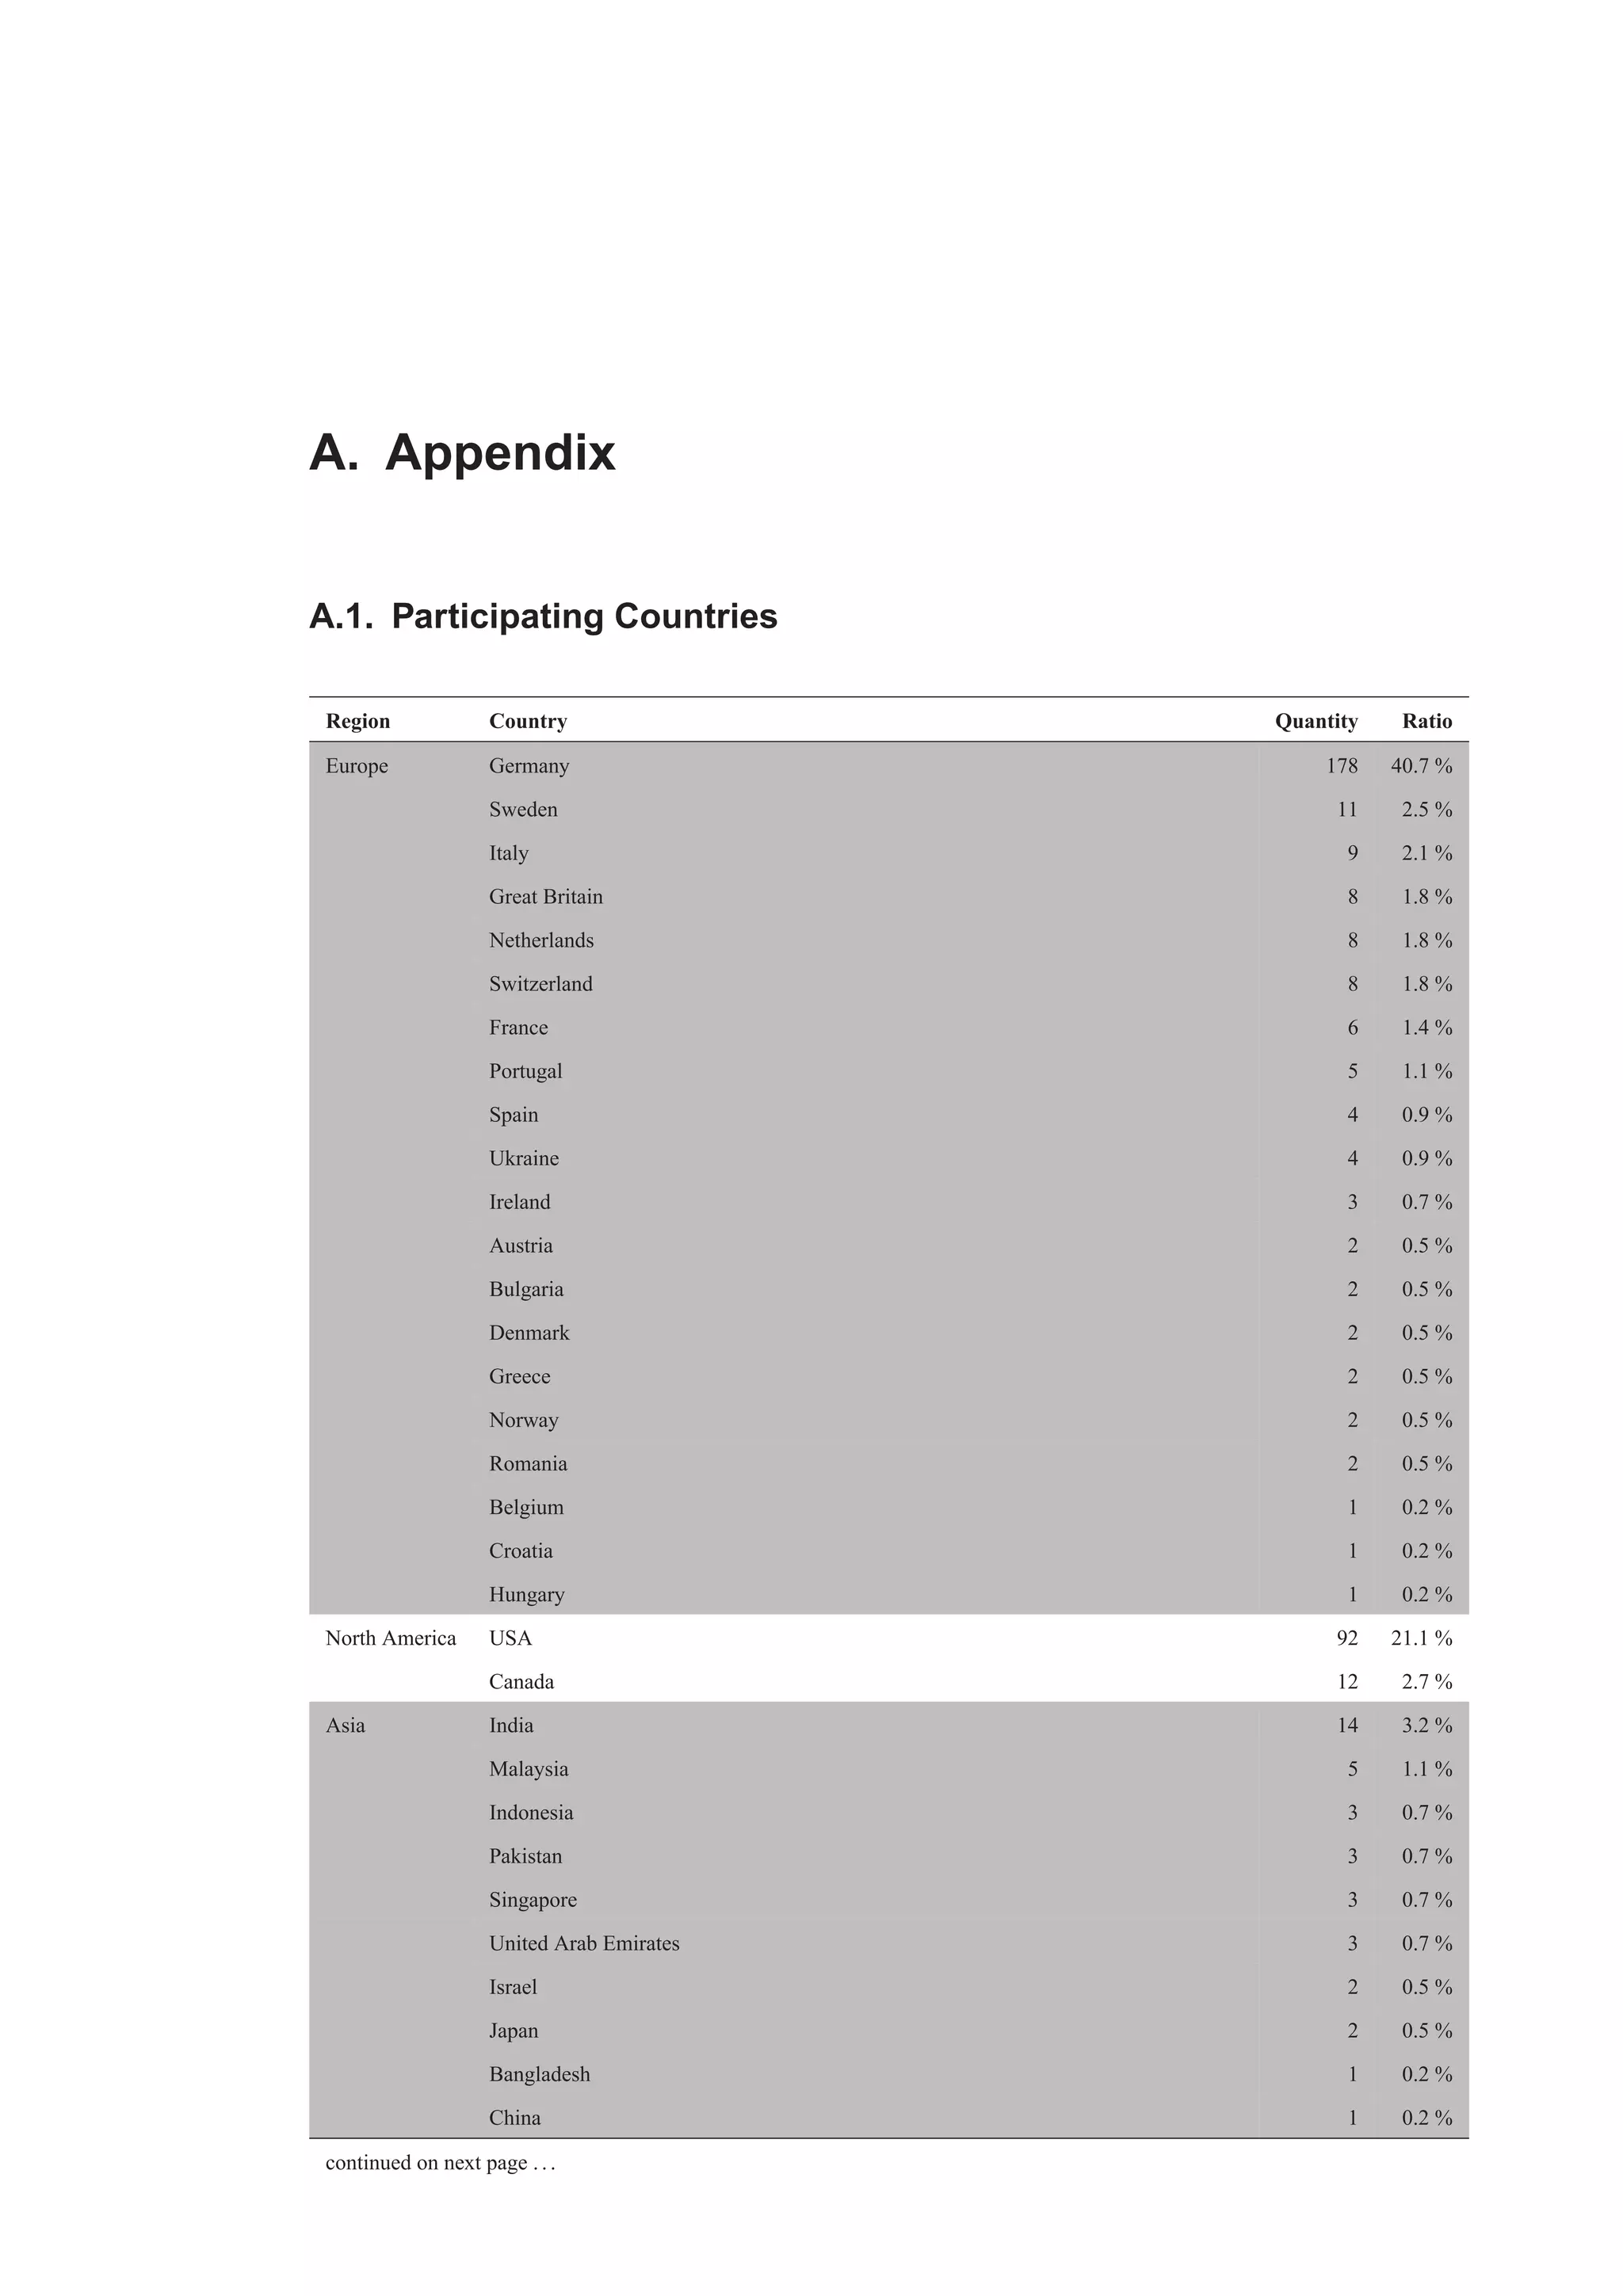
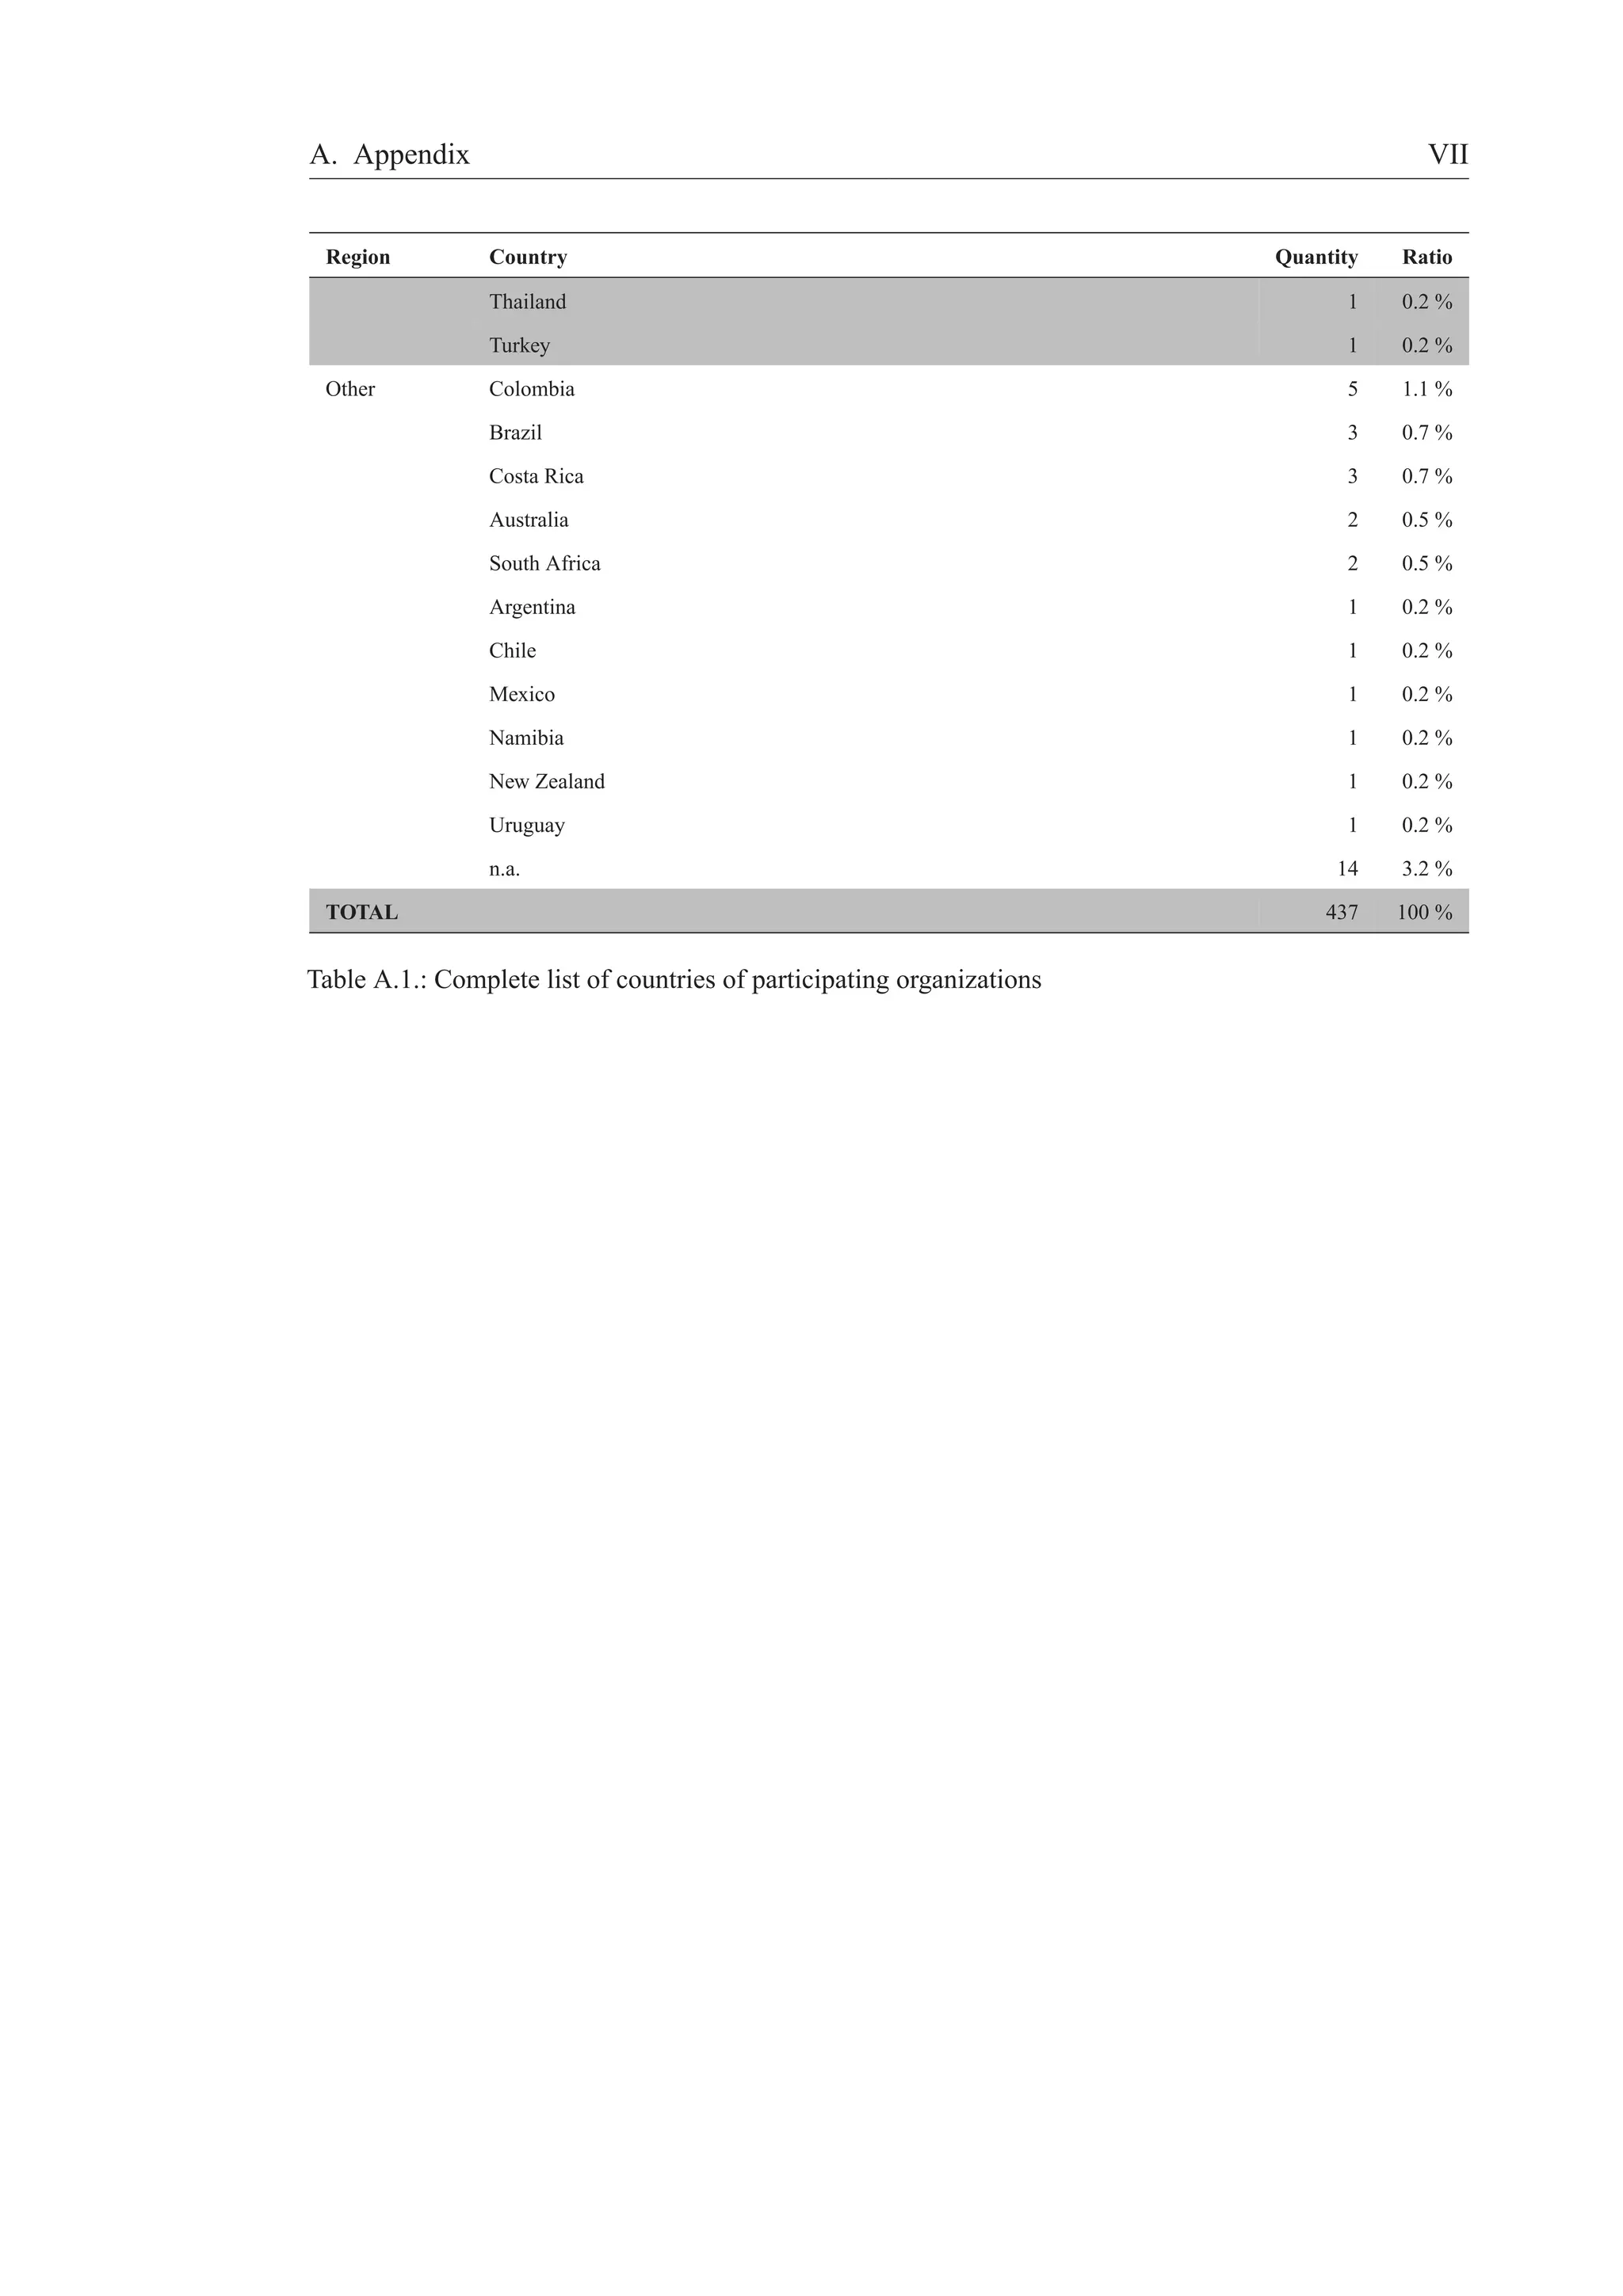
Furthermore, the participants were asked to state the location of their organization or, in case of multina-tional
companies, the location of their headquarters. As table 2.1 reveals, most companies are situated in
Europe, especially Germany. Due to the high number of German participants, a differentiation between
Germany and other European countries is possible. A high number of participating organizations are from
Chief Executive
Officer; 29.1%
Chief
Information /
Technology
Officer; 8.2%
IT / ITC Manager;
13.5%
Other; 13.7%
Enterprise / IT
Architect; 35.5%
no answer;
754
completed,
valid; 437
completed,
invalid; 53
started; 278
[out of 437 valid responses]
Figure 2.1.: Respondents and participants](https://image.slidesharecdn.com/gelbe-reiheagility-survey-140826135420-phpapp02/75/WHAT-CONSTITUTES-AN-AGILE-ORGANIZATION-DESCRIPTIVE-RESULTS-OF-AN-EMPIRICAL-INVESTIGATION-12-2048.jpg)
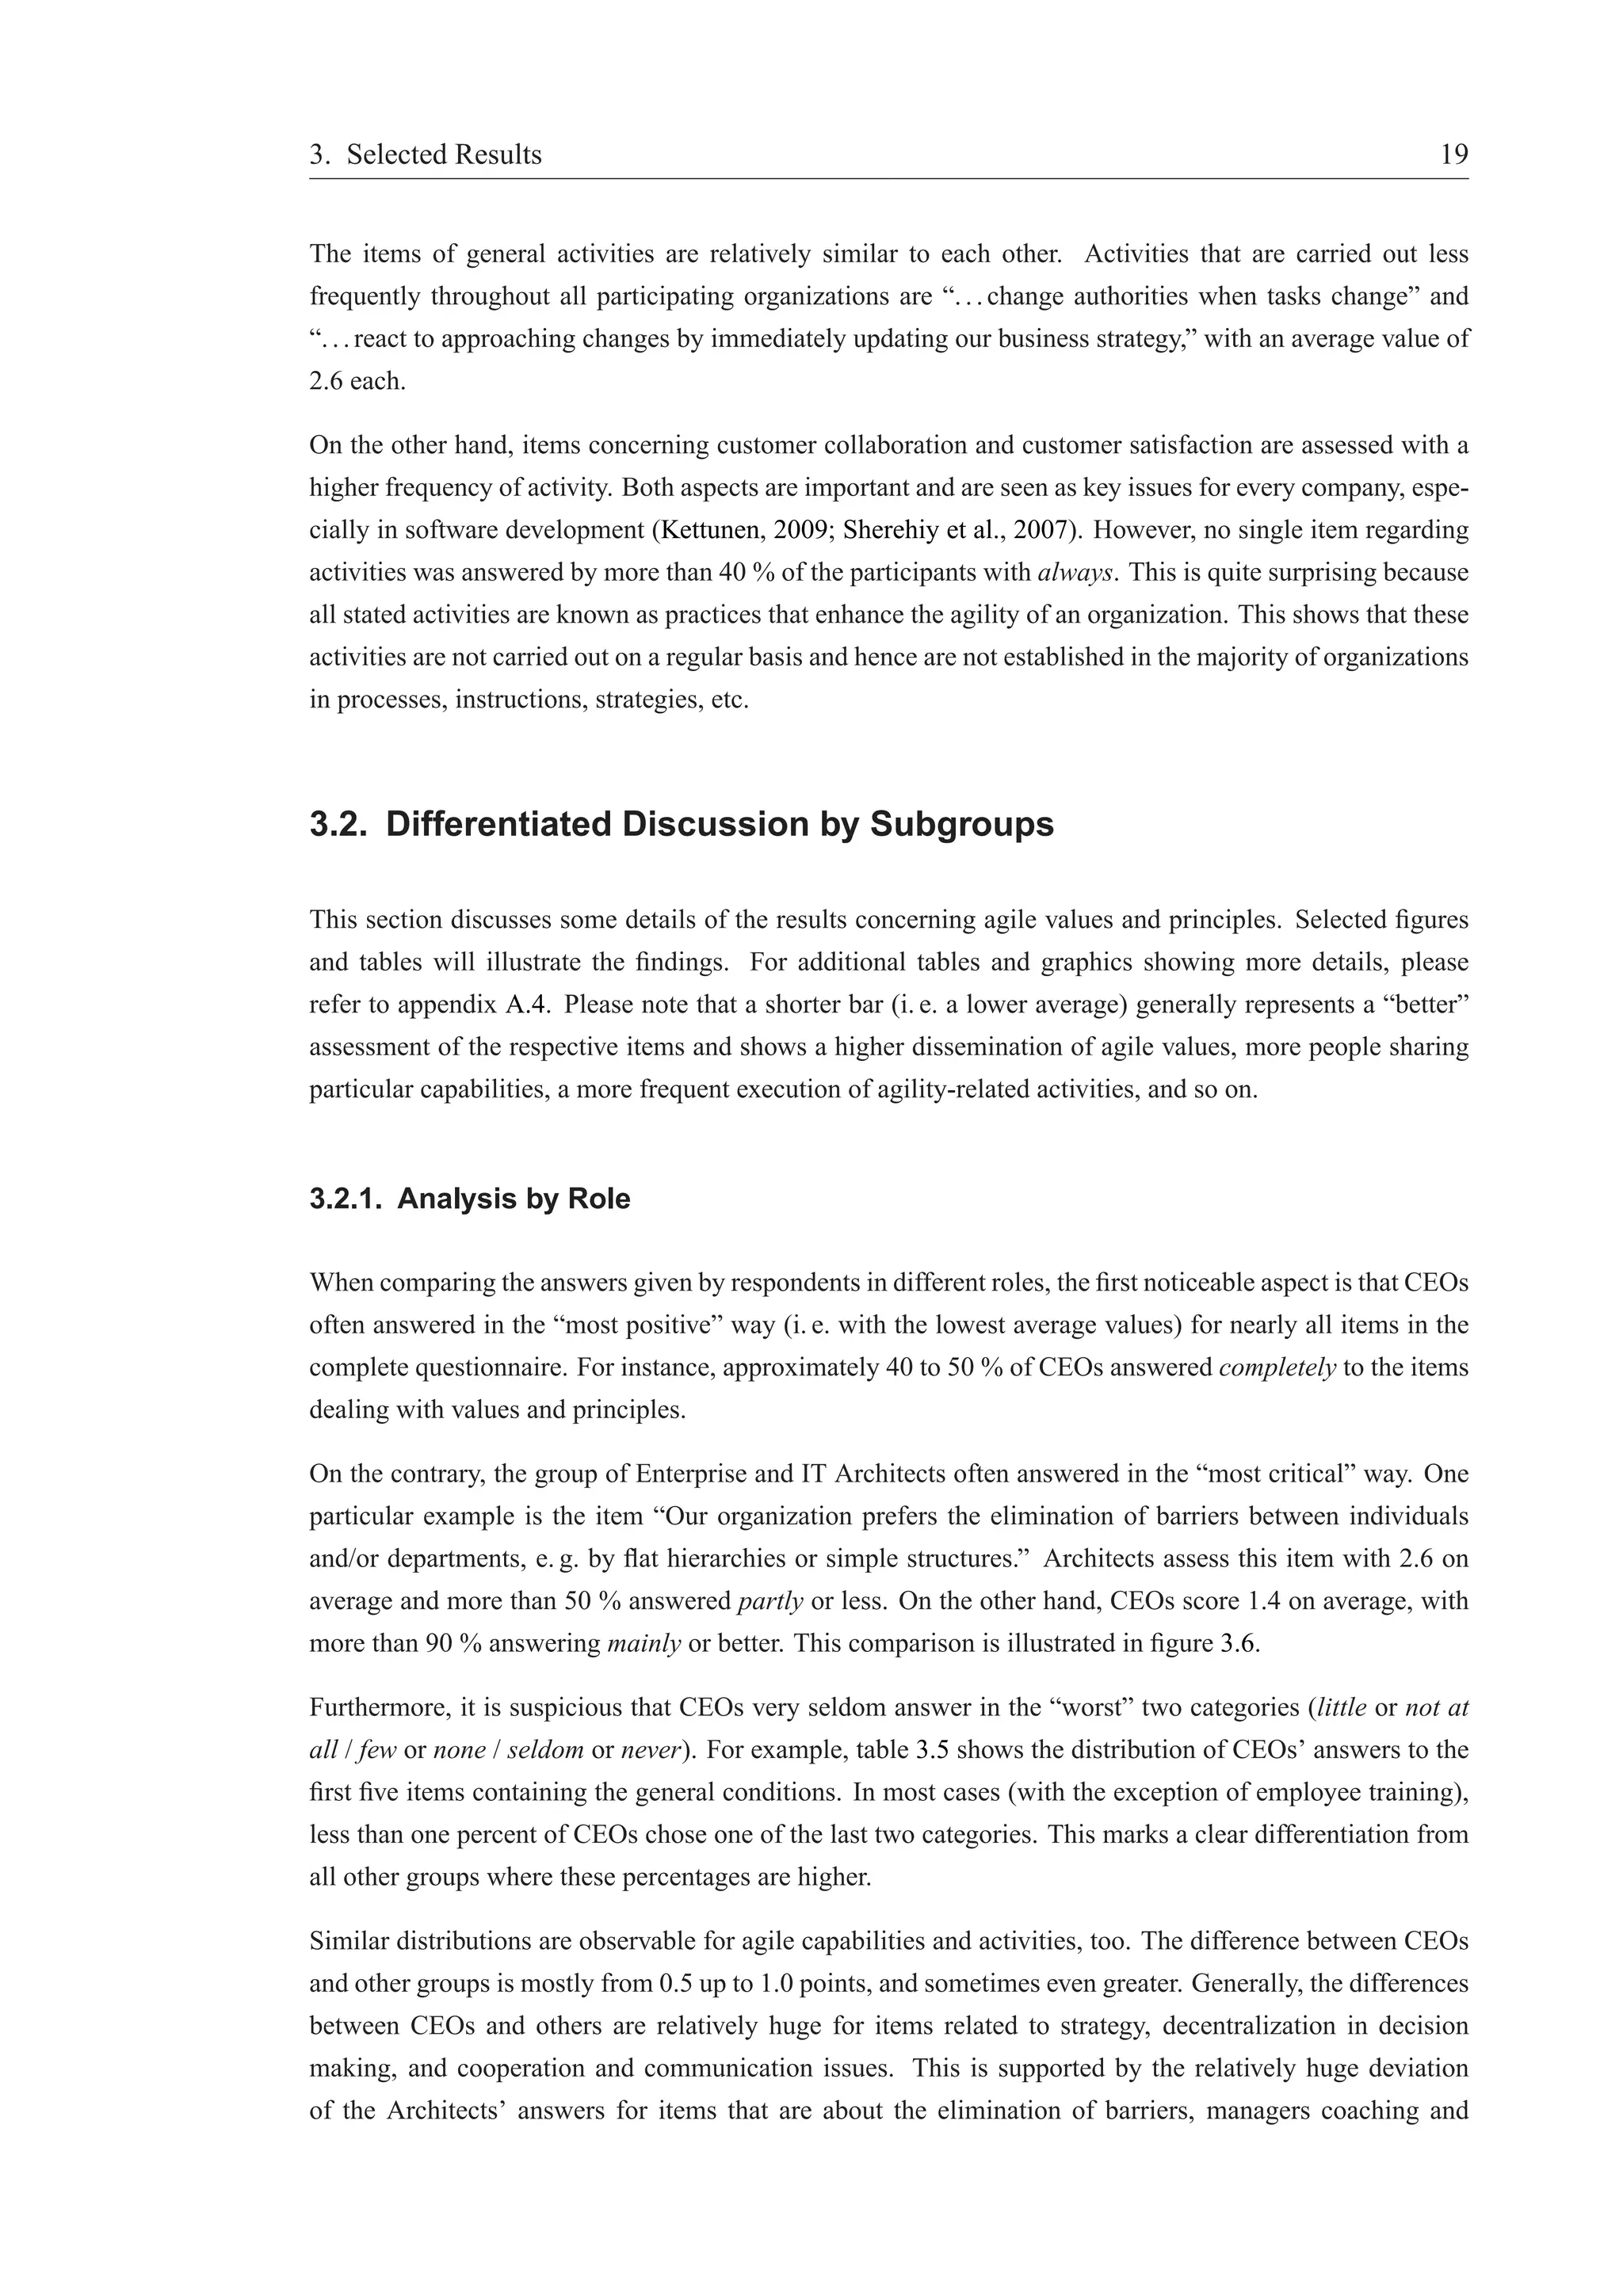
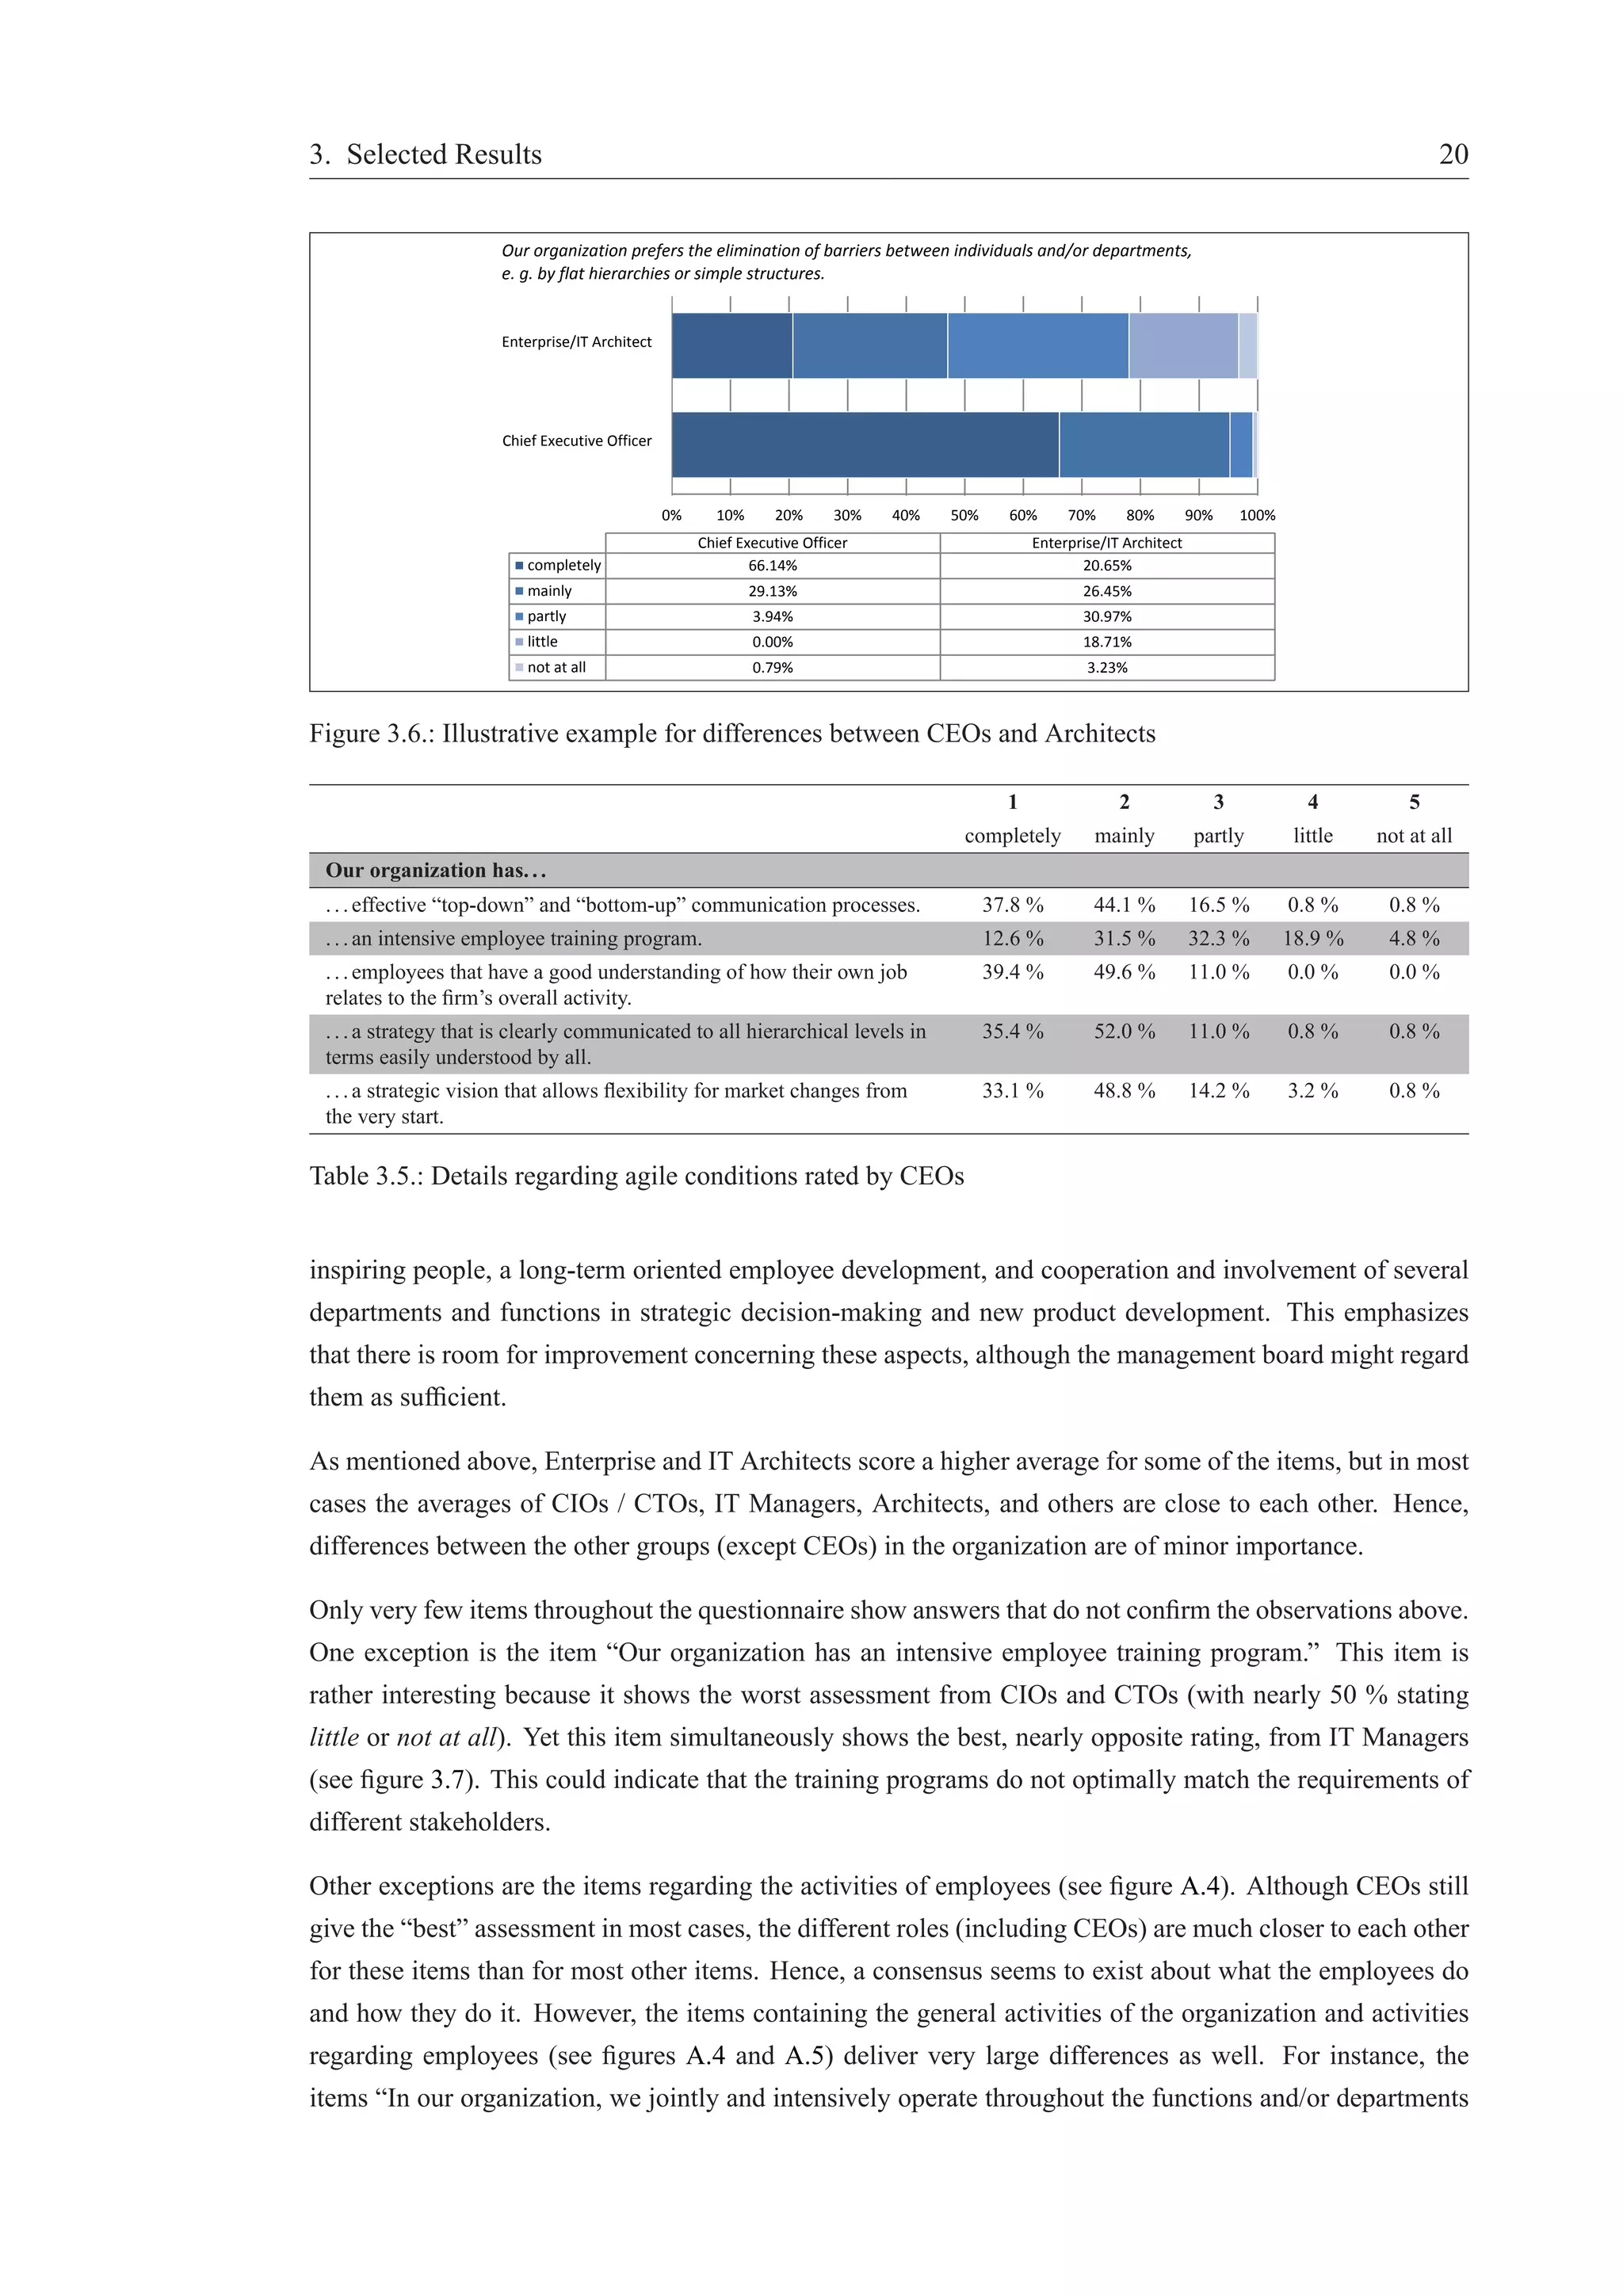
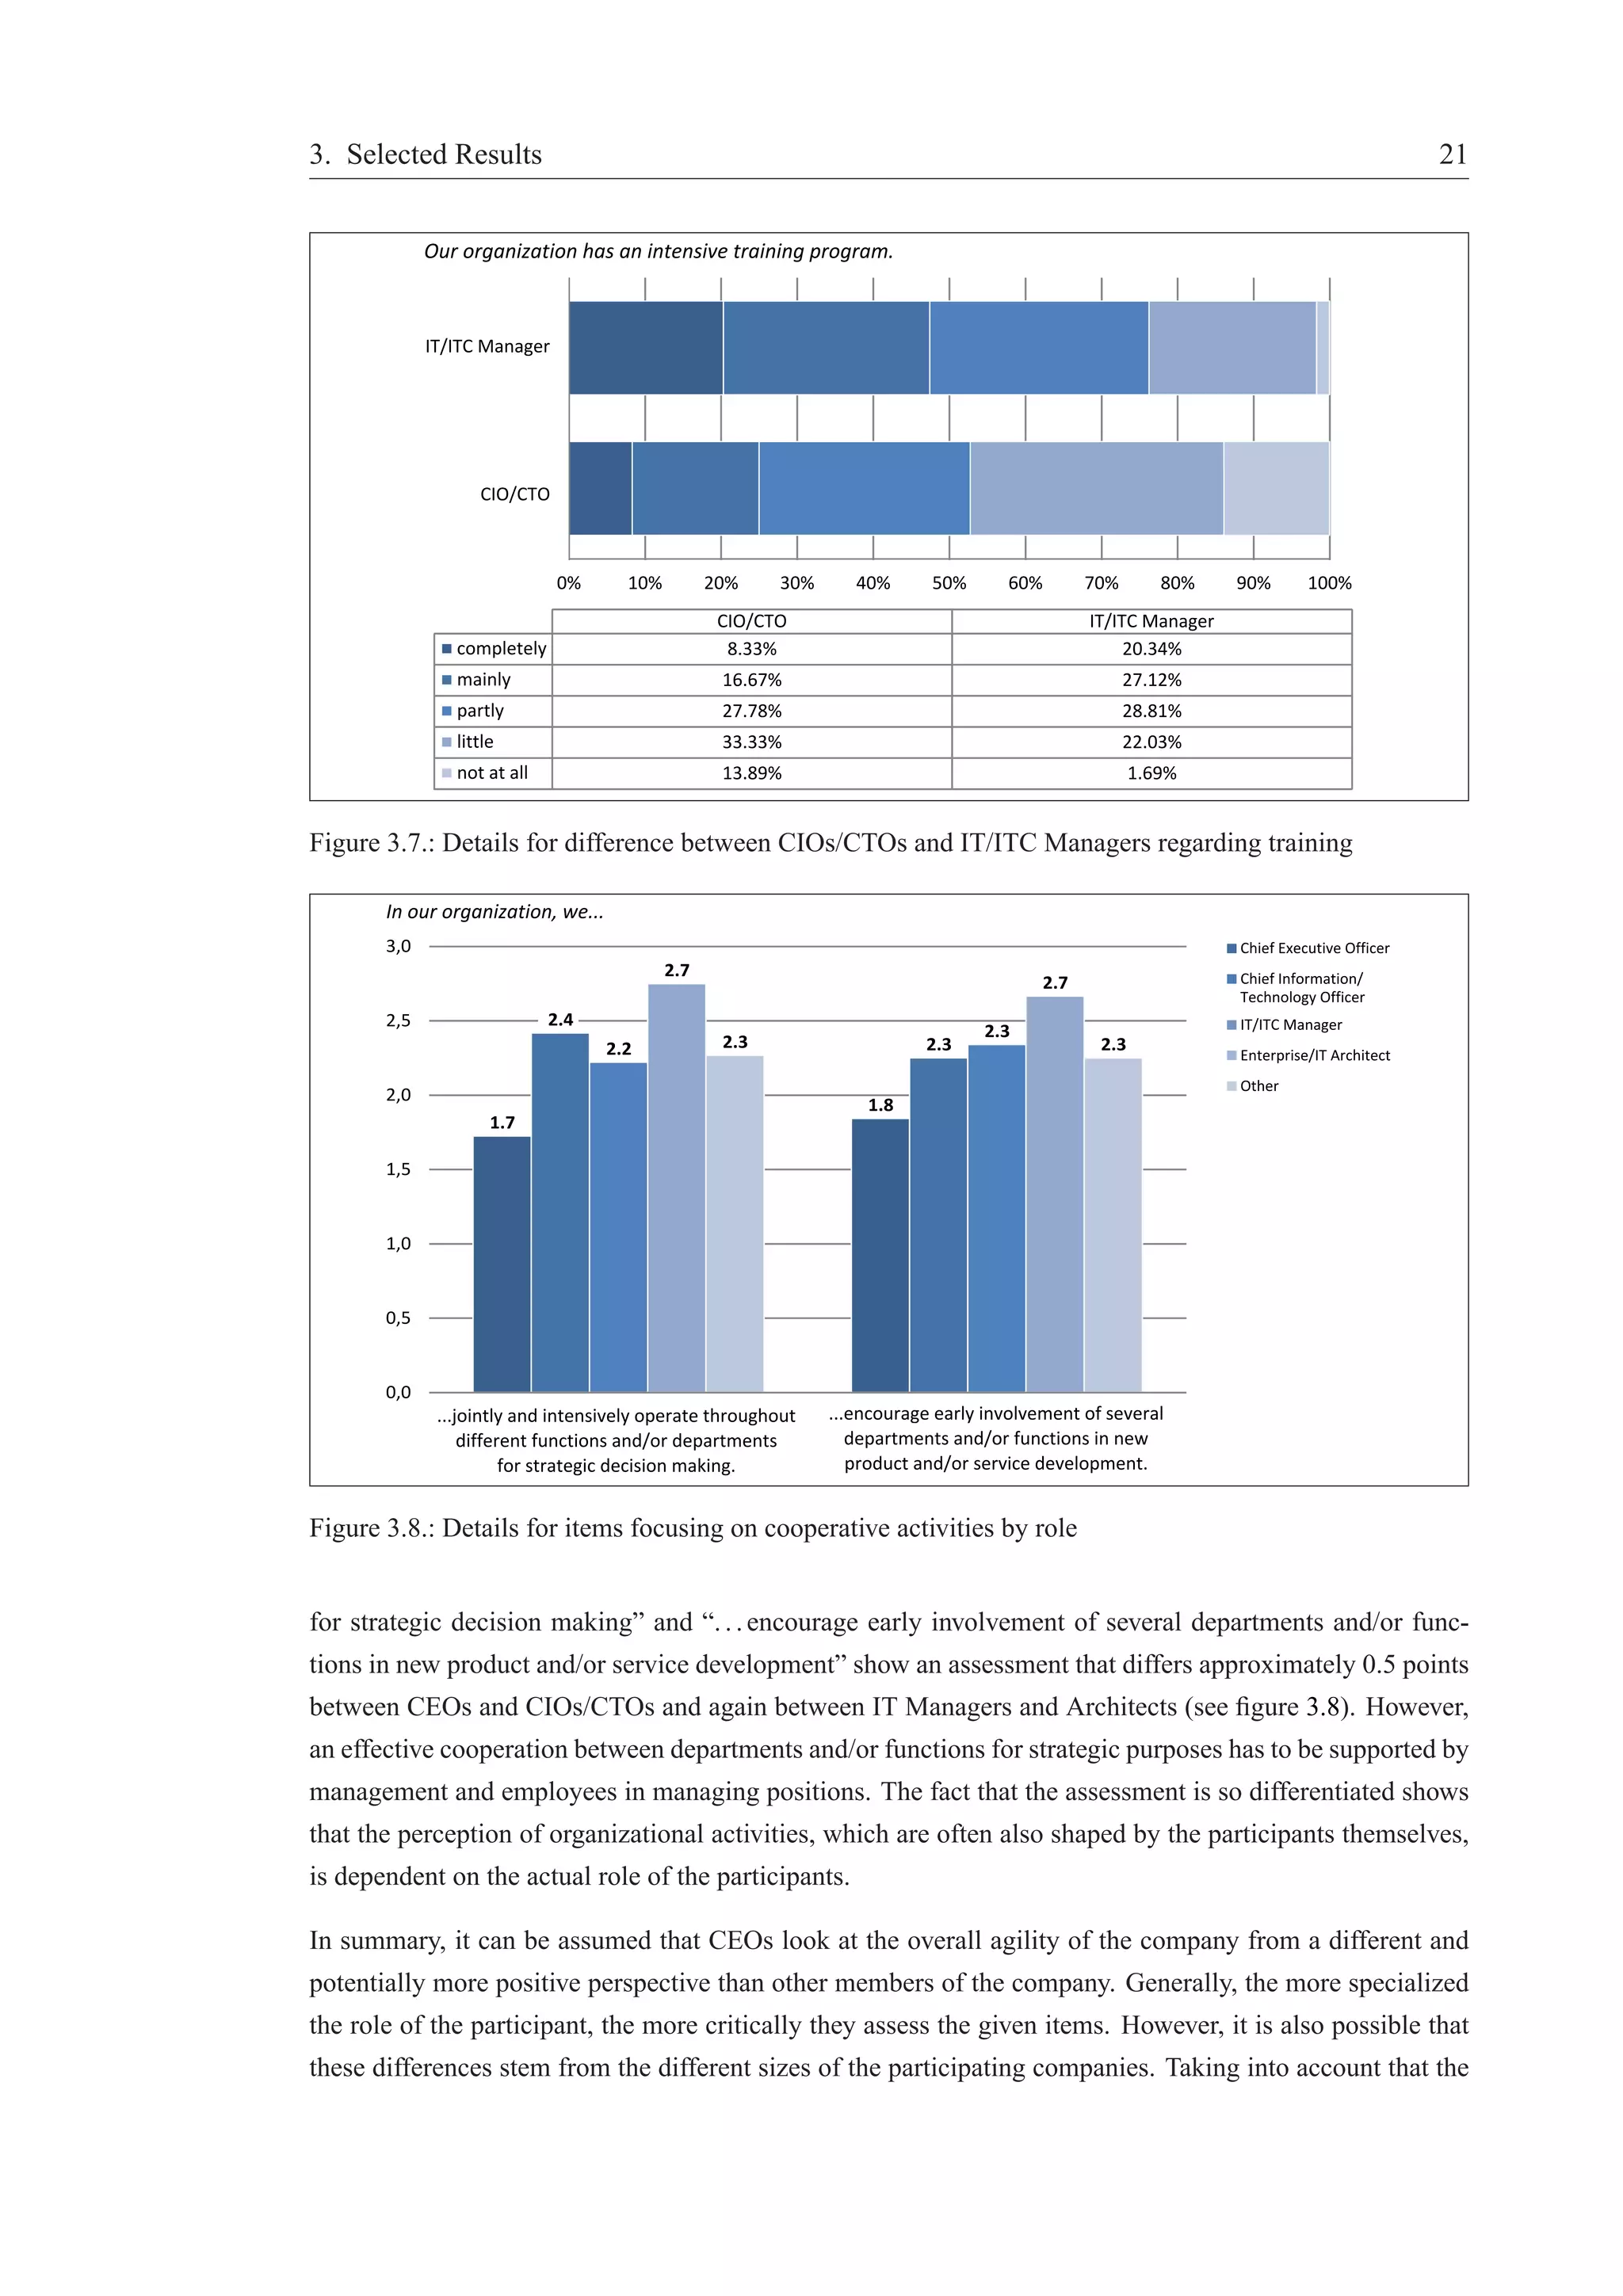
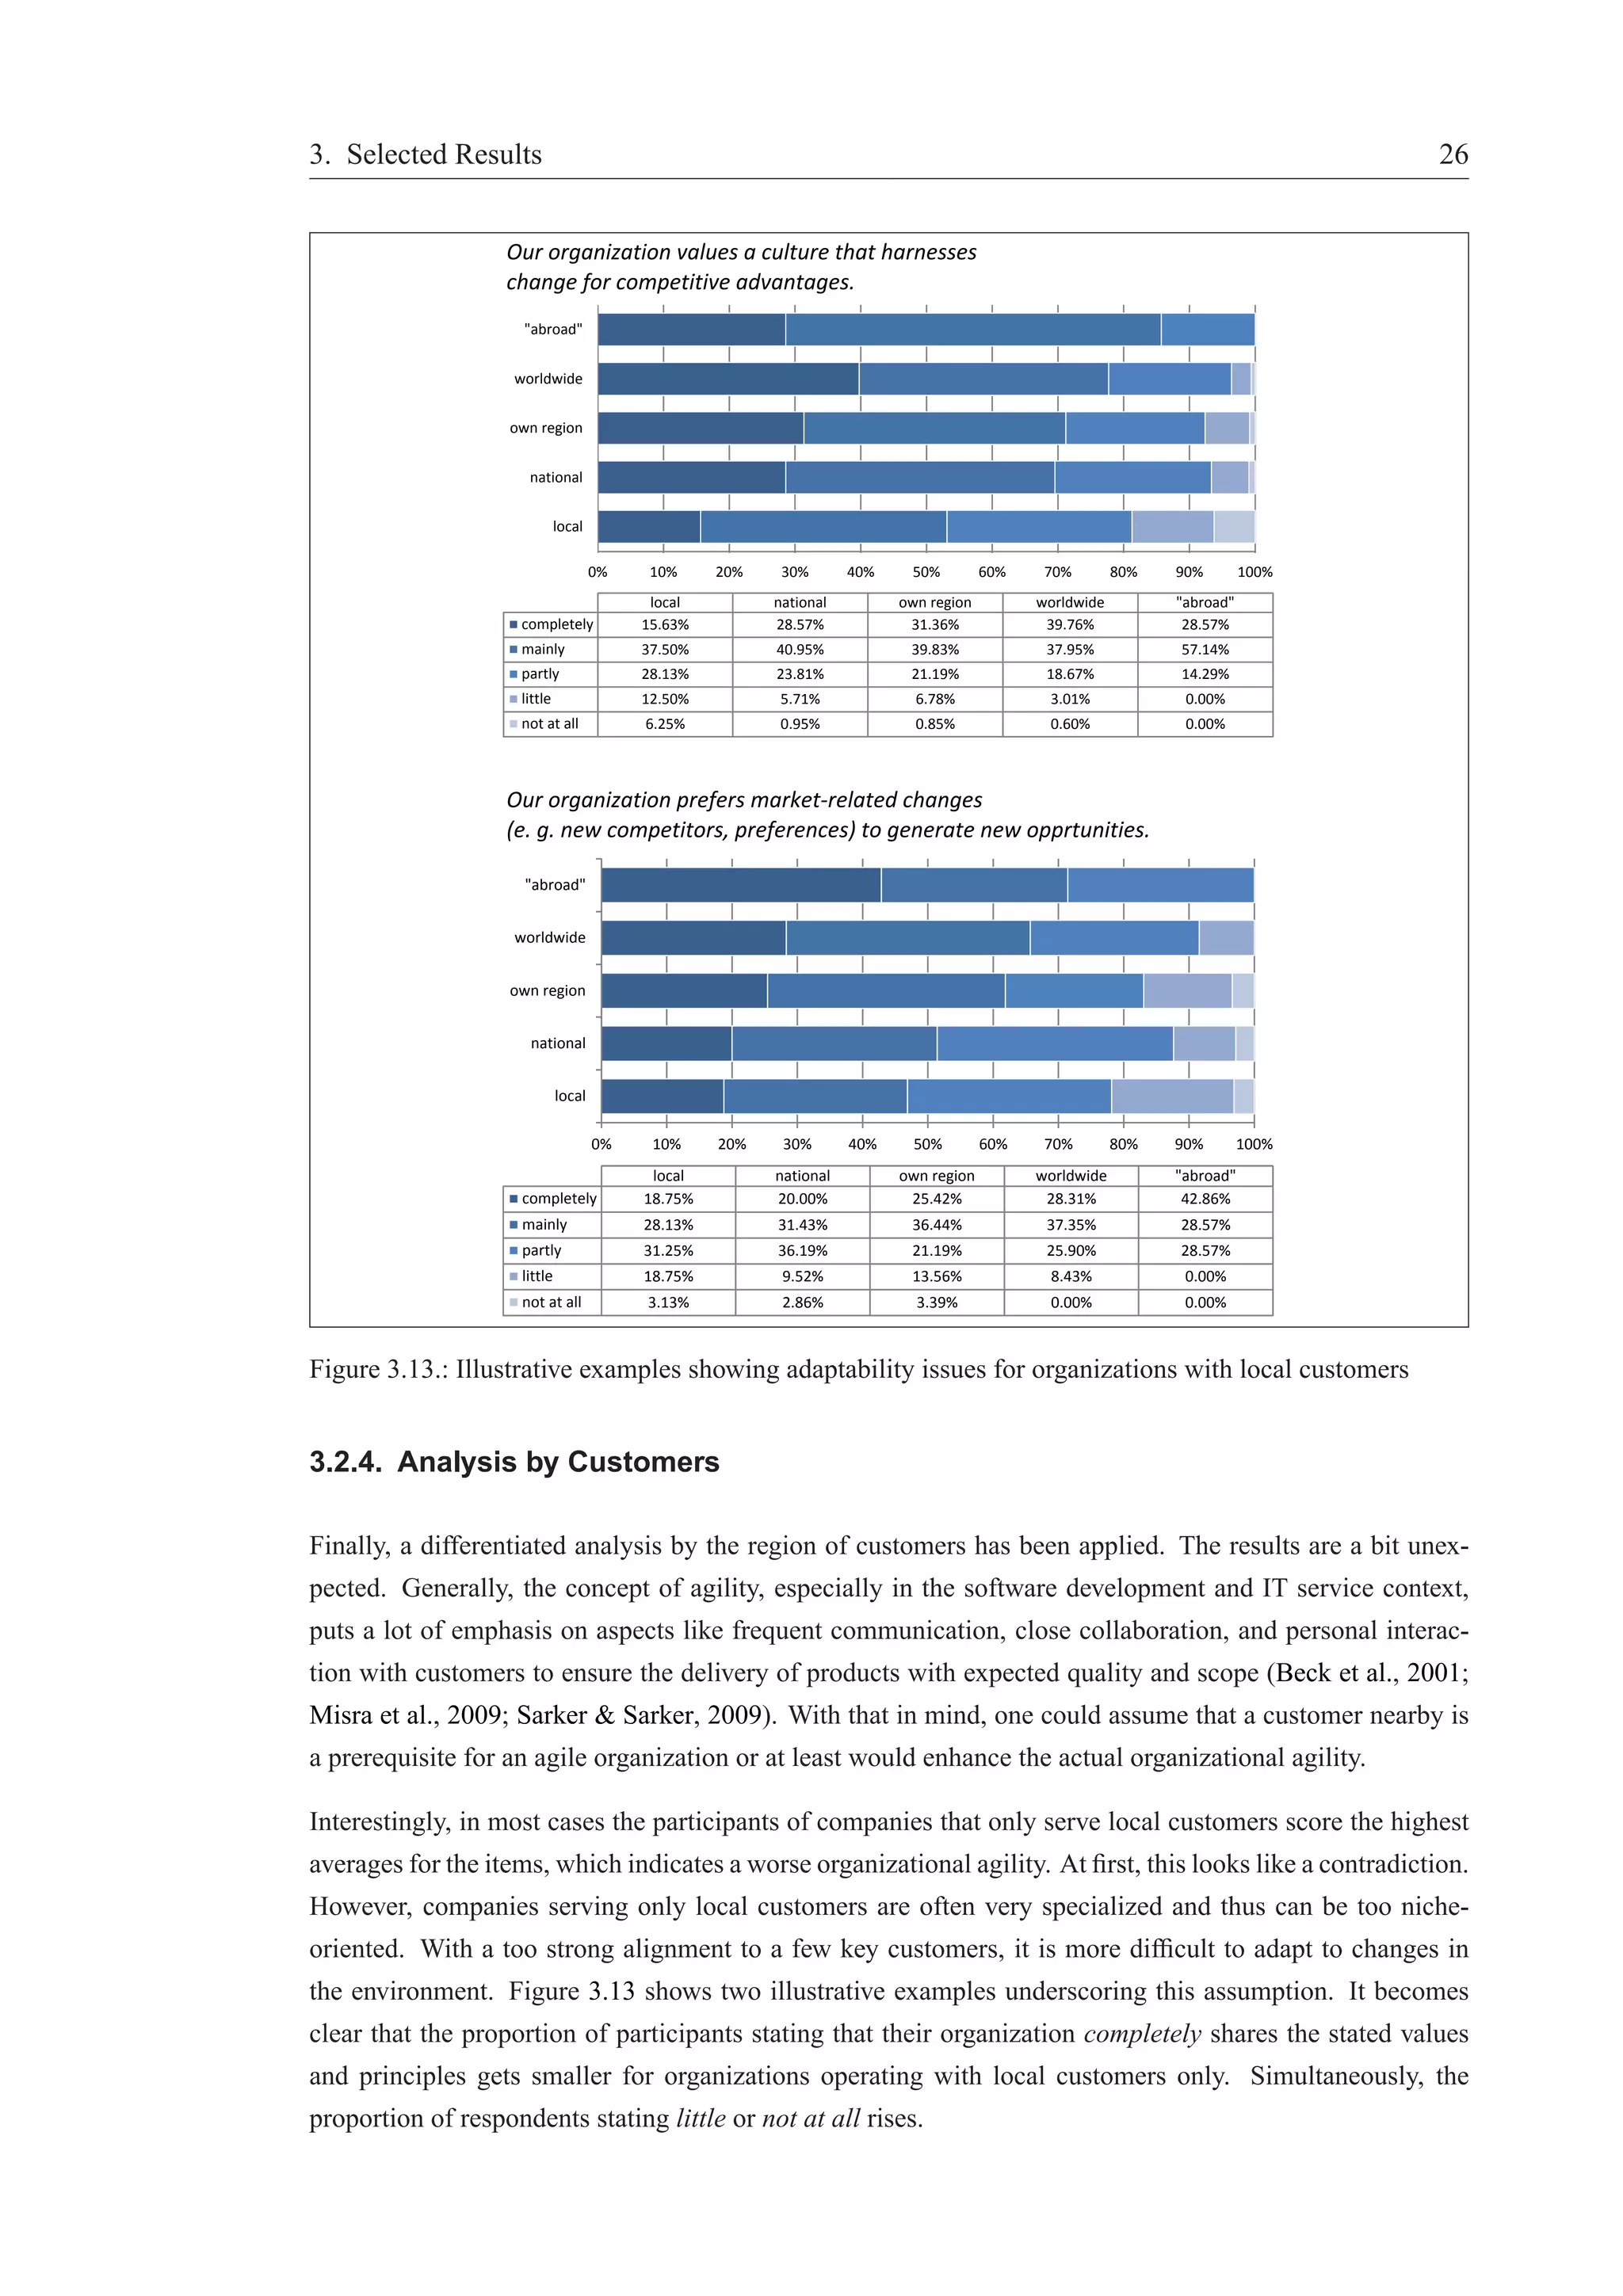
![3. Selected Results
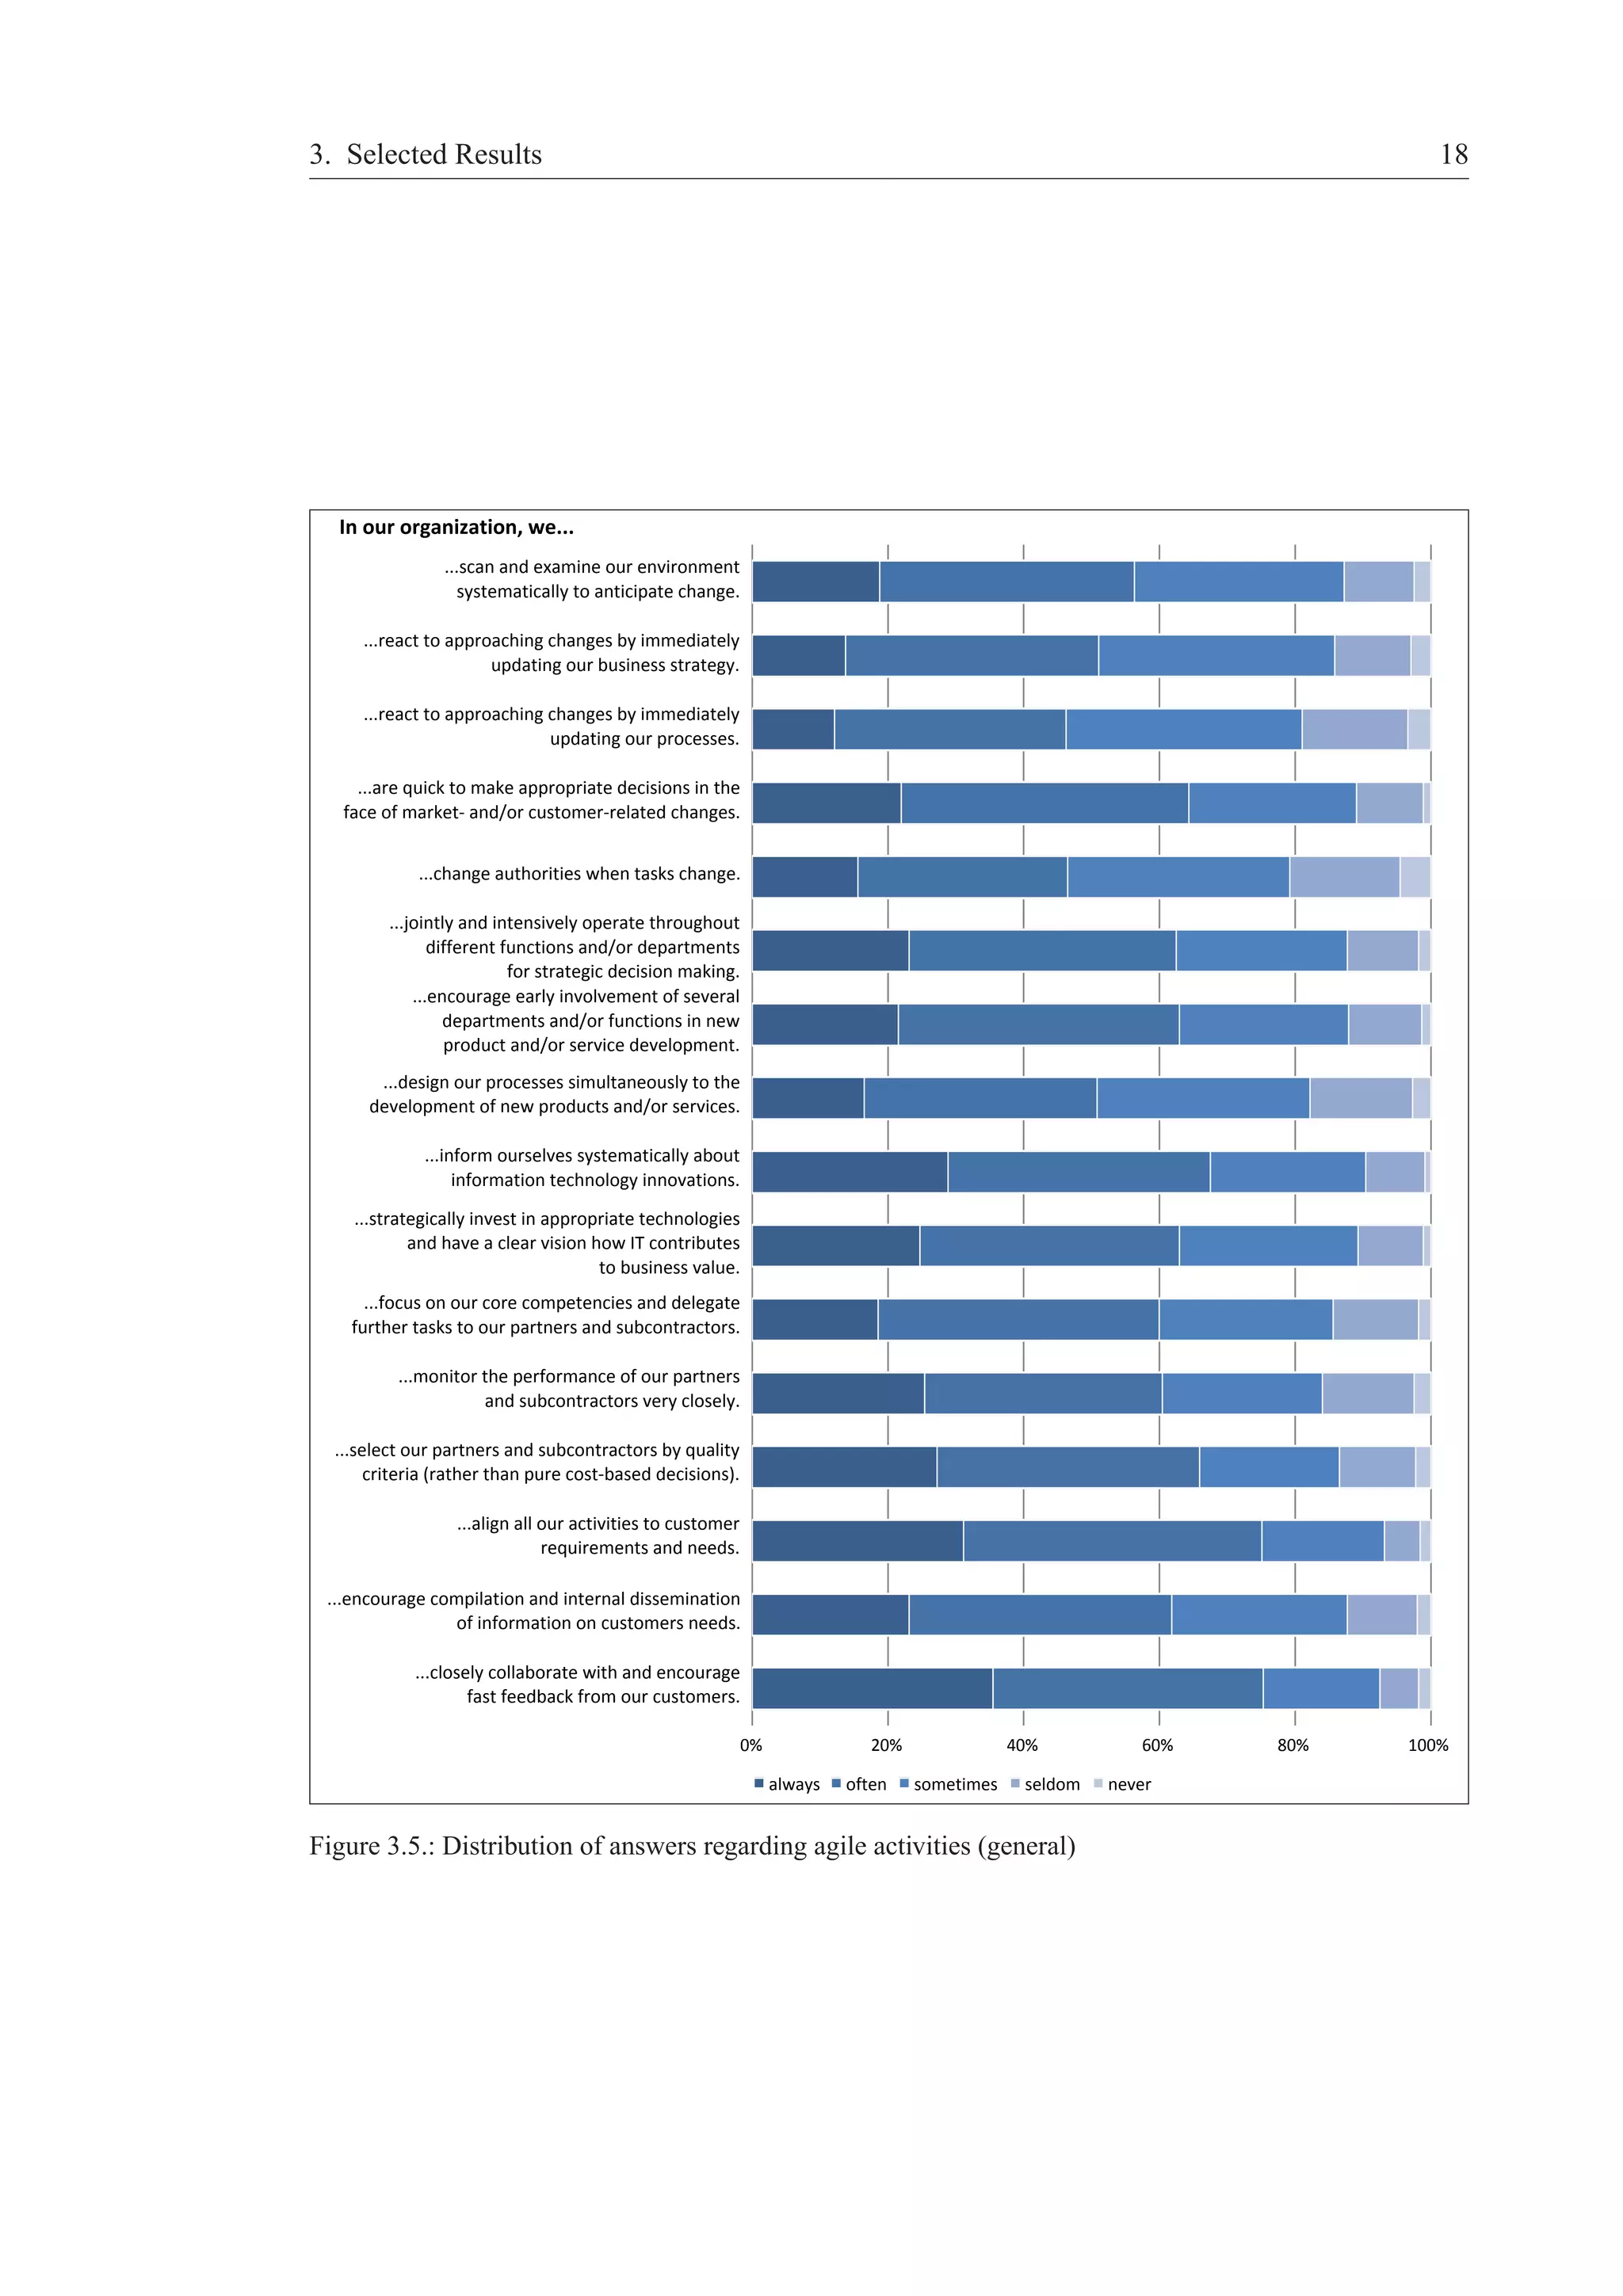
Selected descriptive results of the survey are presented and discussed in this chapter. Section 3.1 gives the
reader a summary of the results of all questions asked. For every part of the questionnaire, the distribution
and ratio of all answers as well as the average value are given in a summarizing table and figure and are
shortly described.
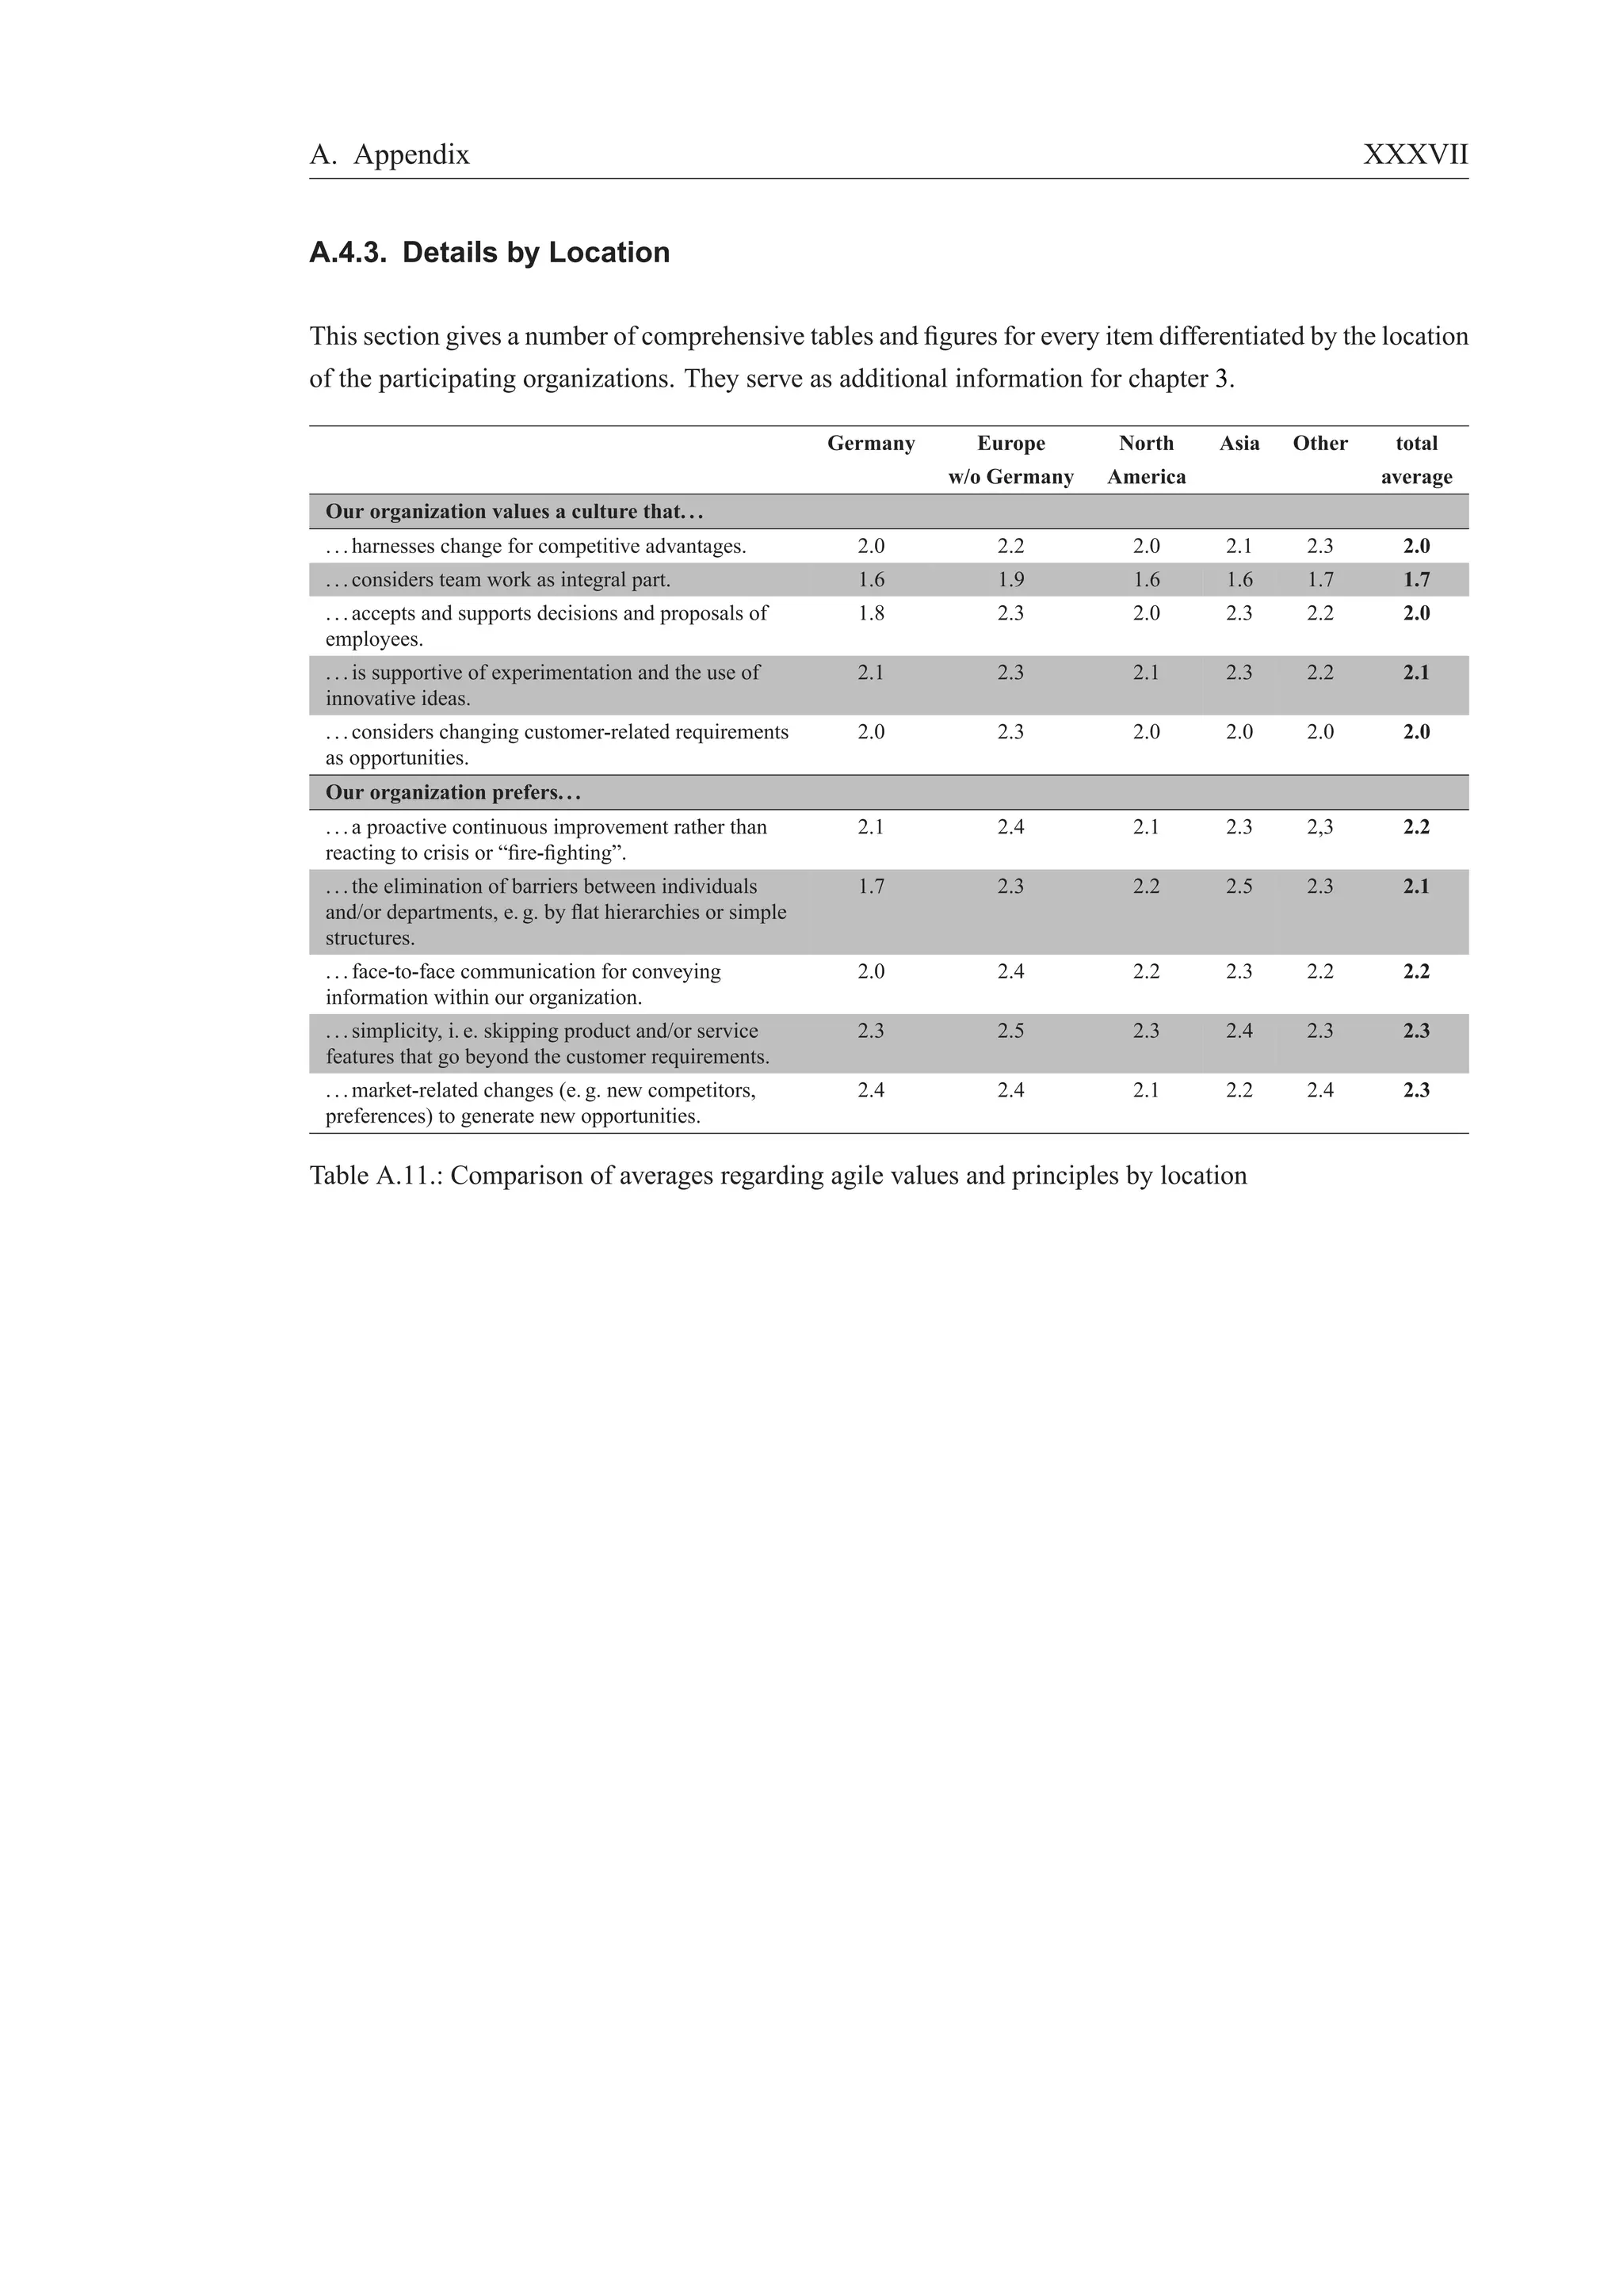
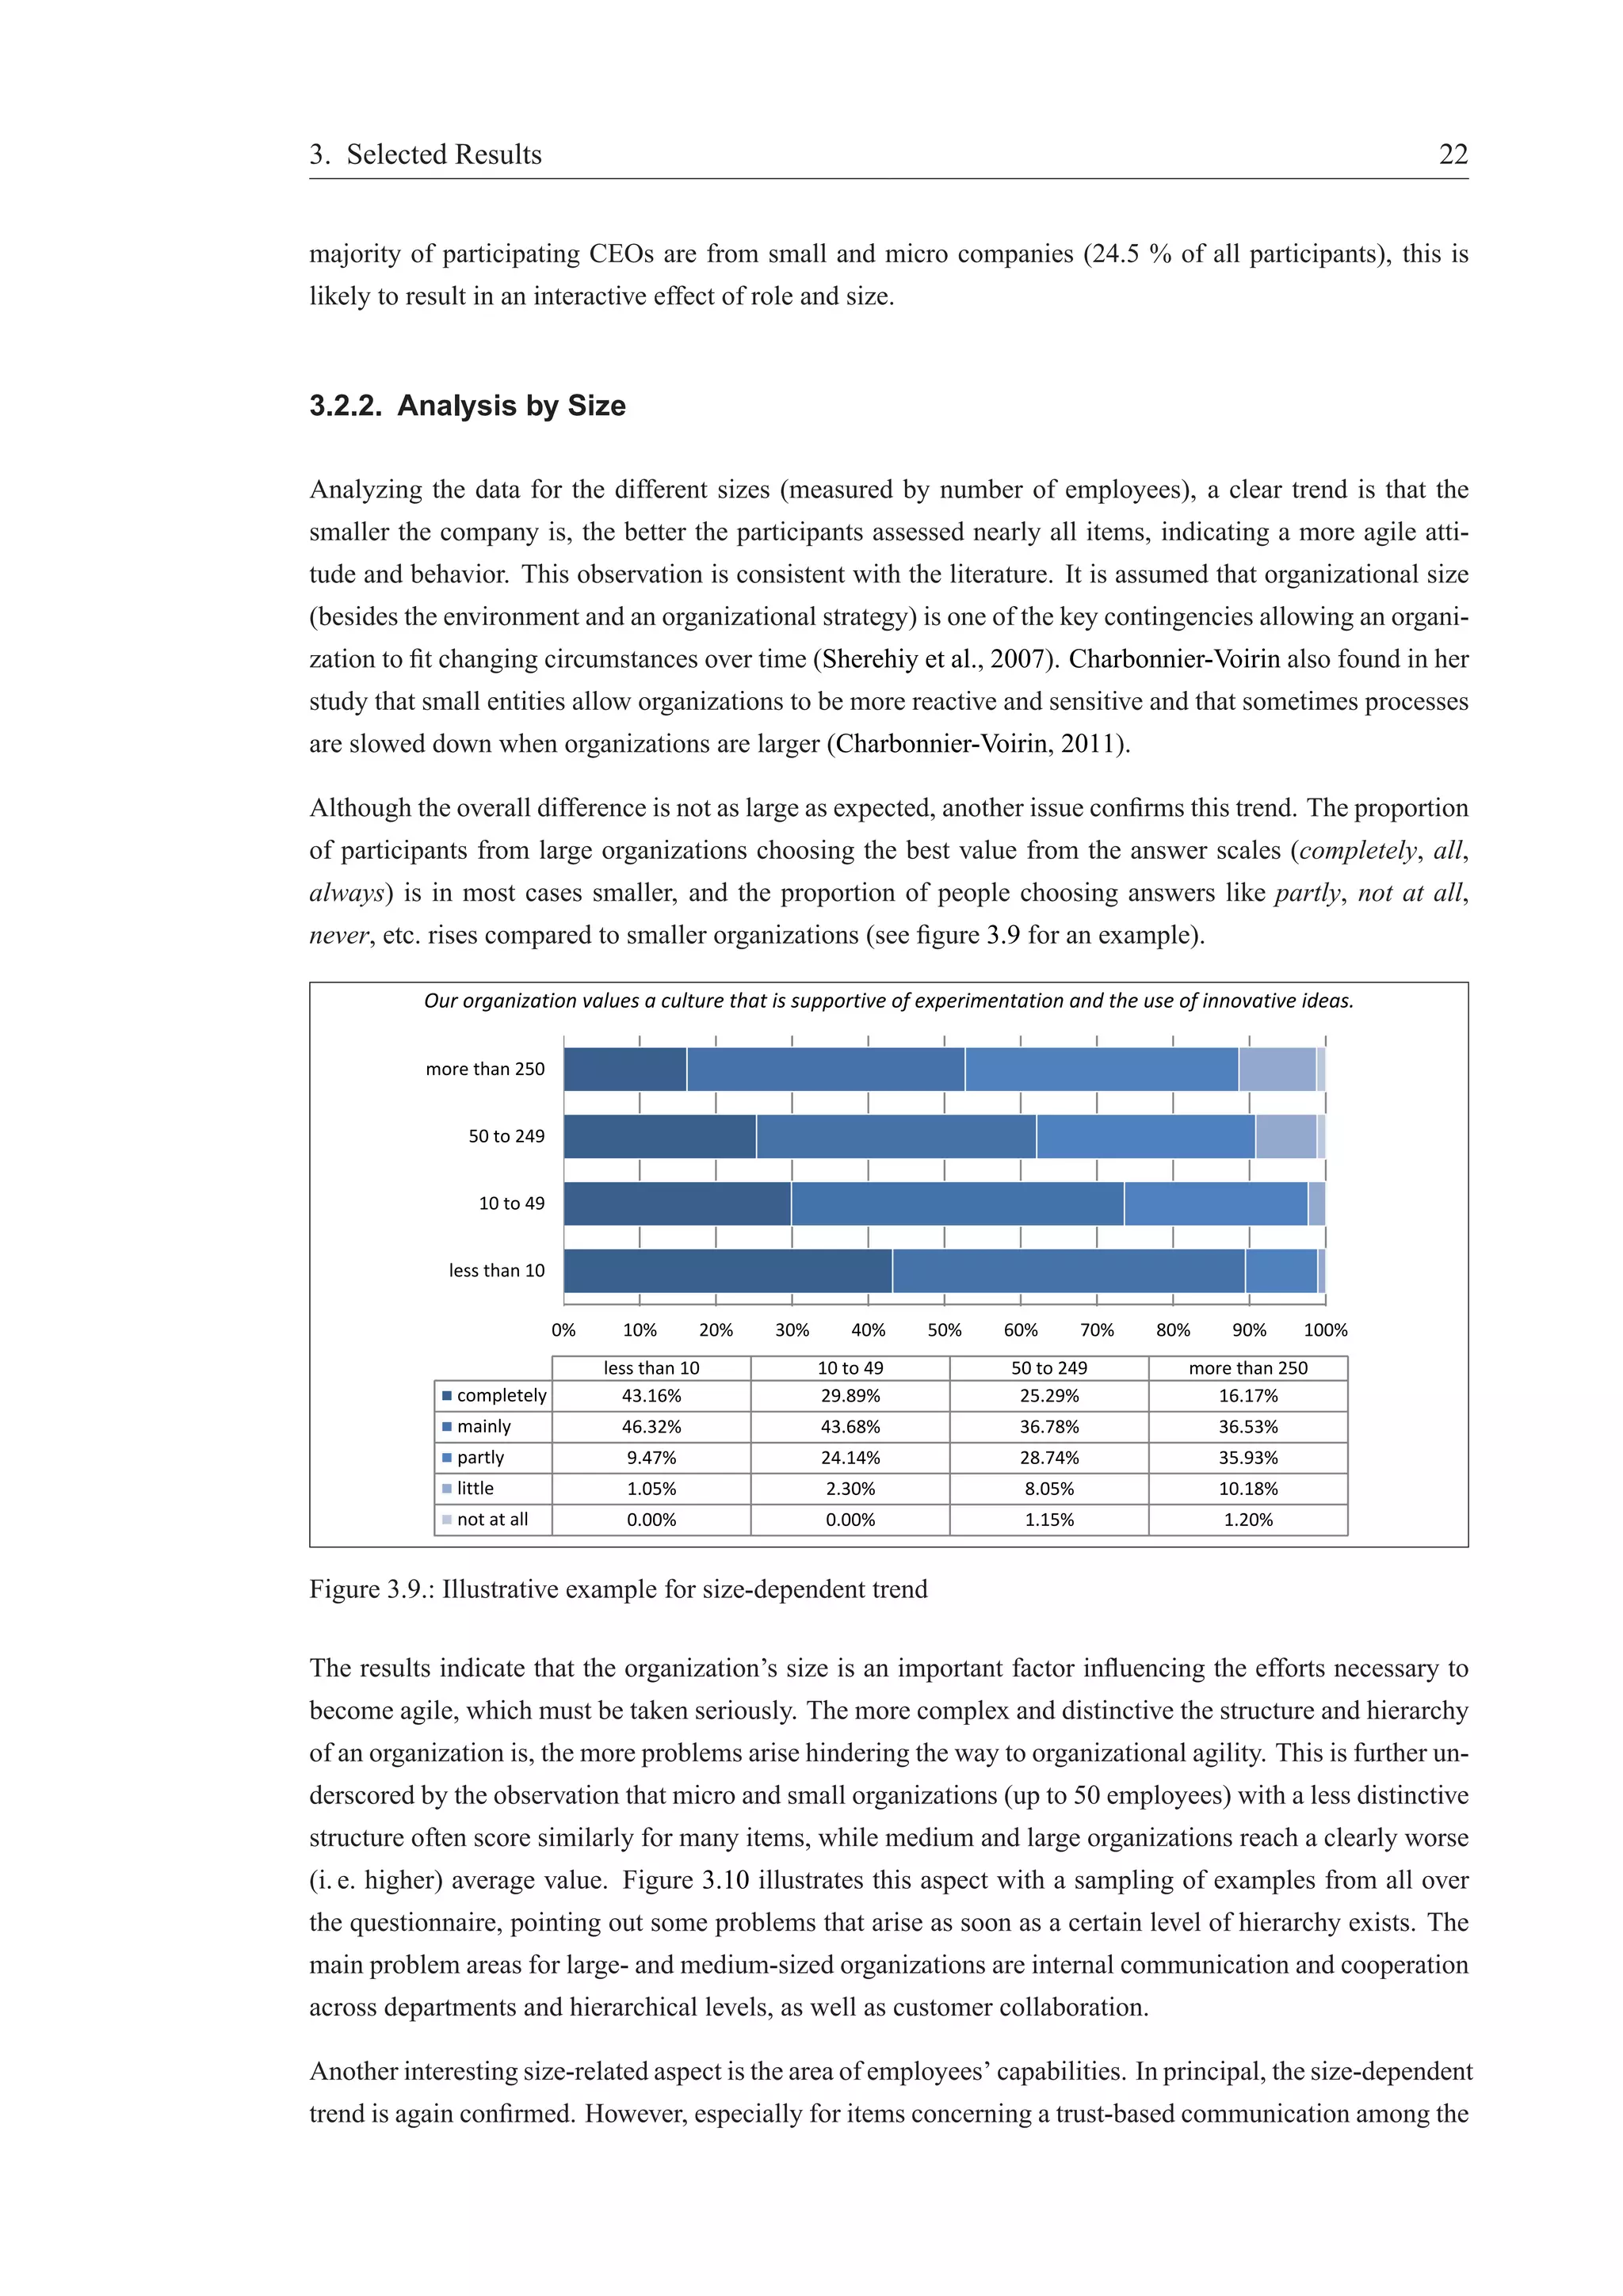
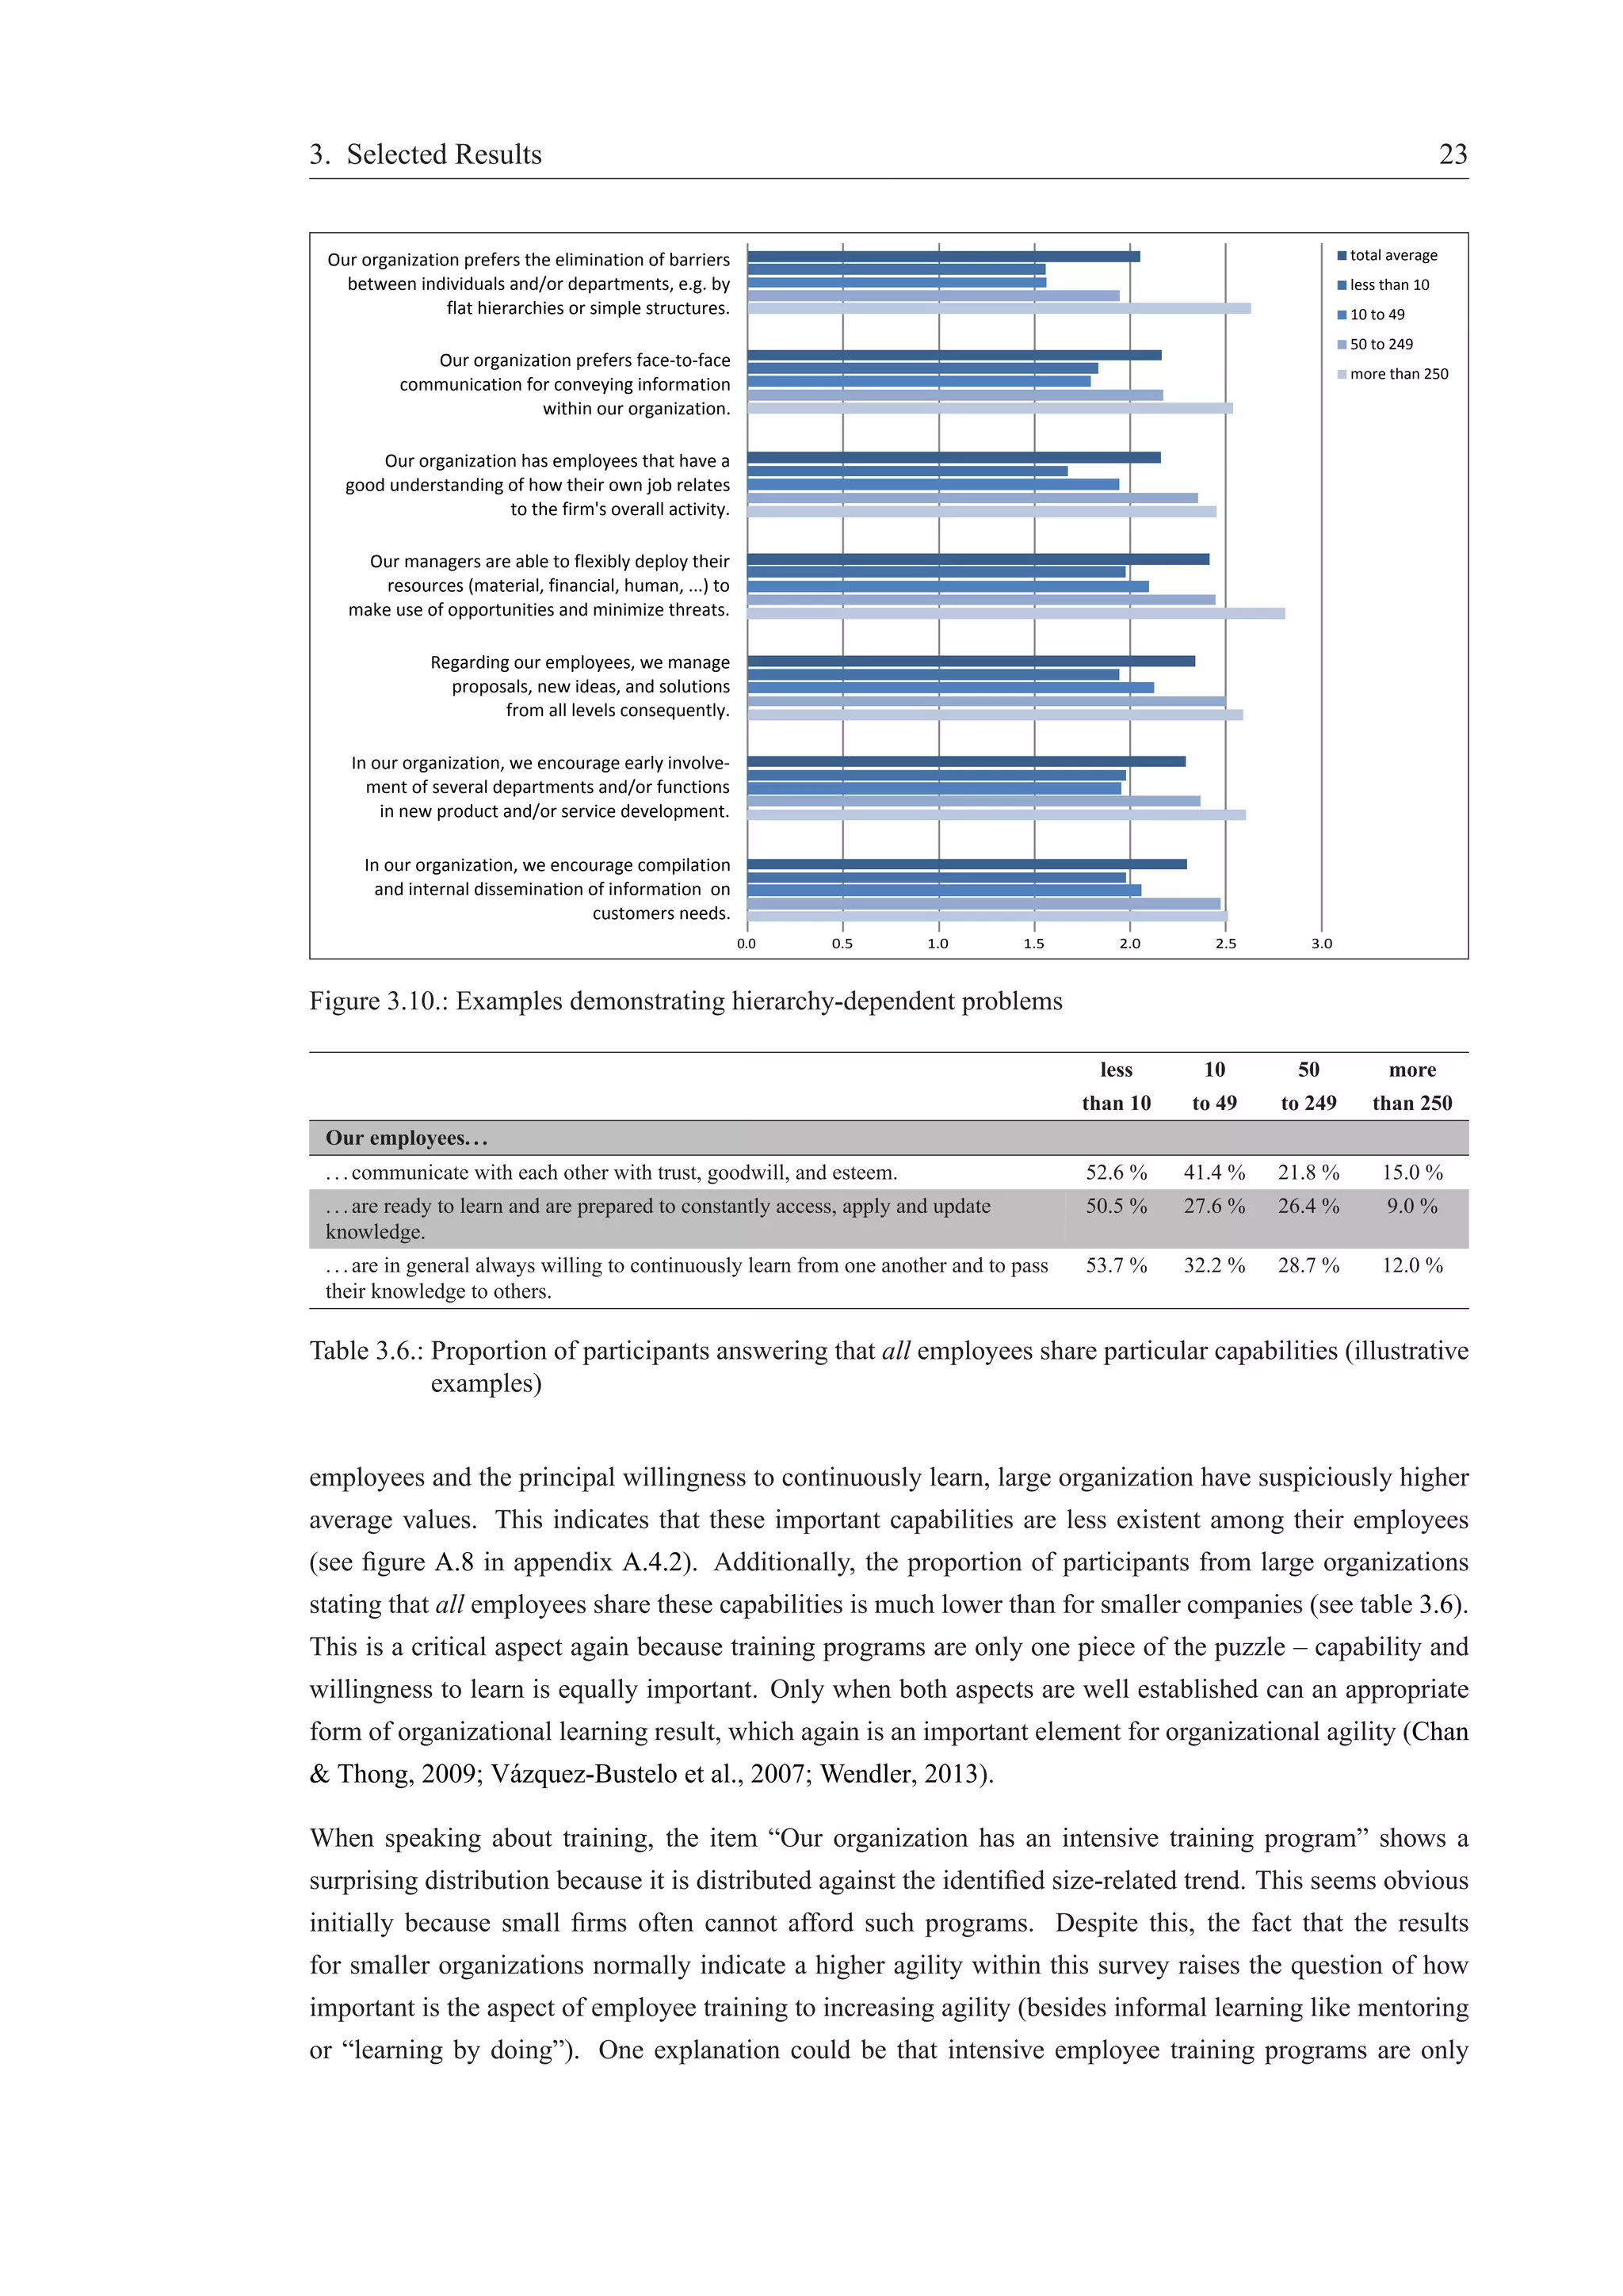
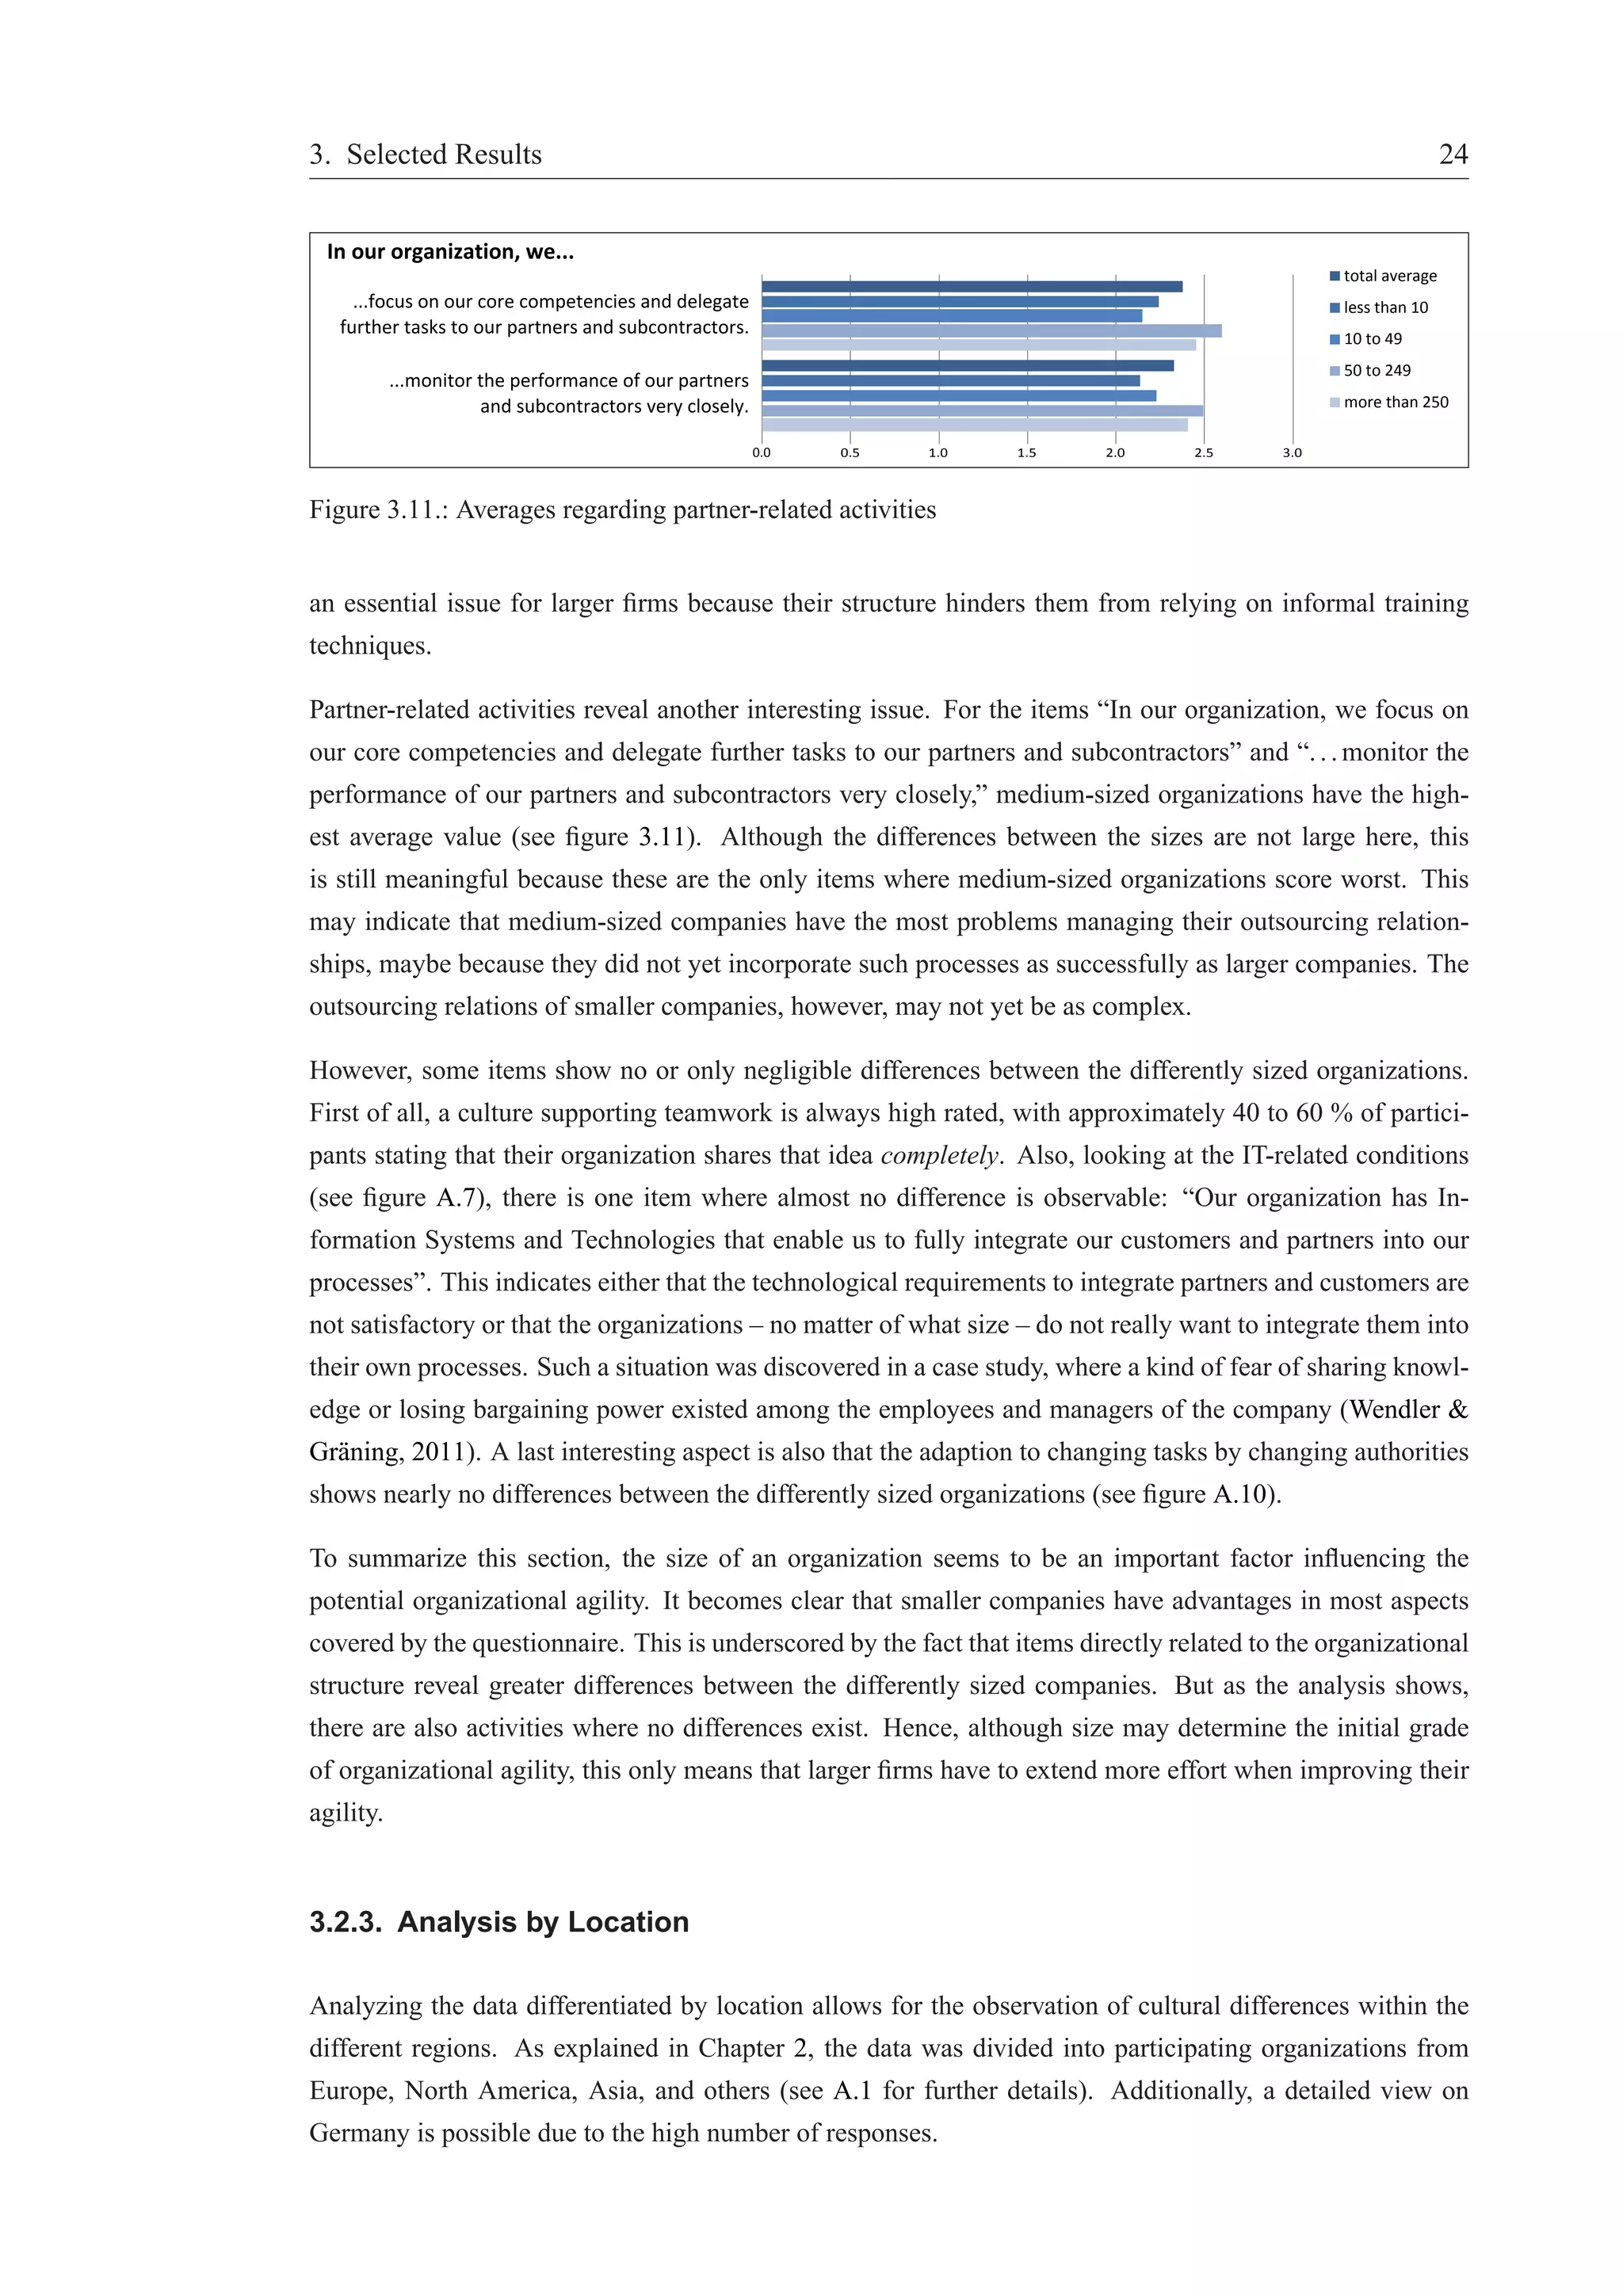
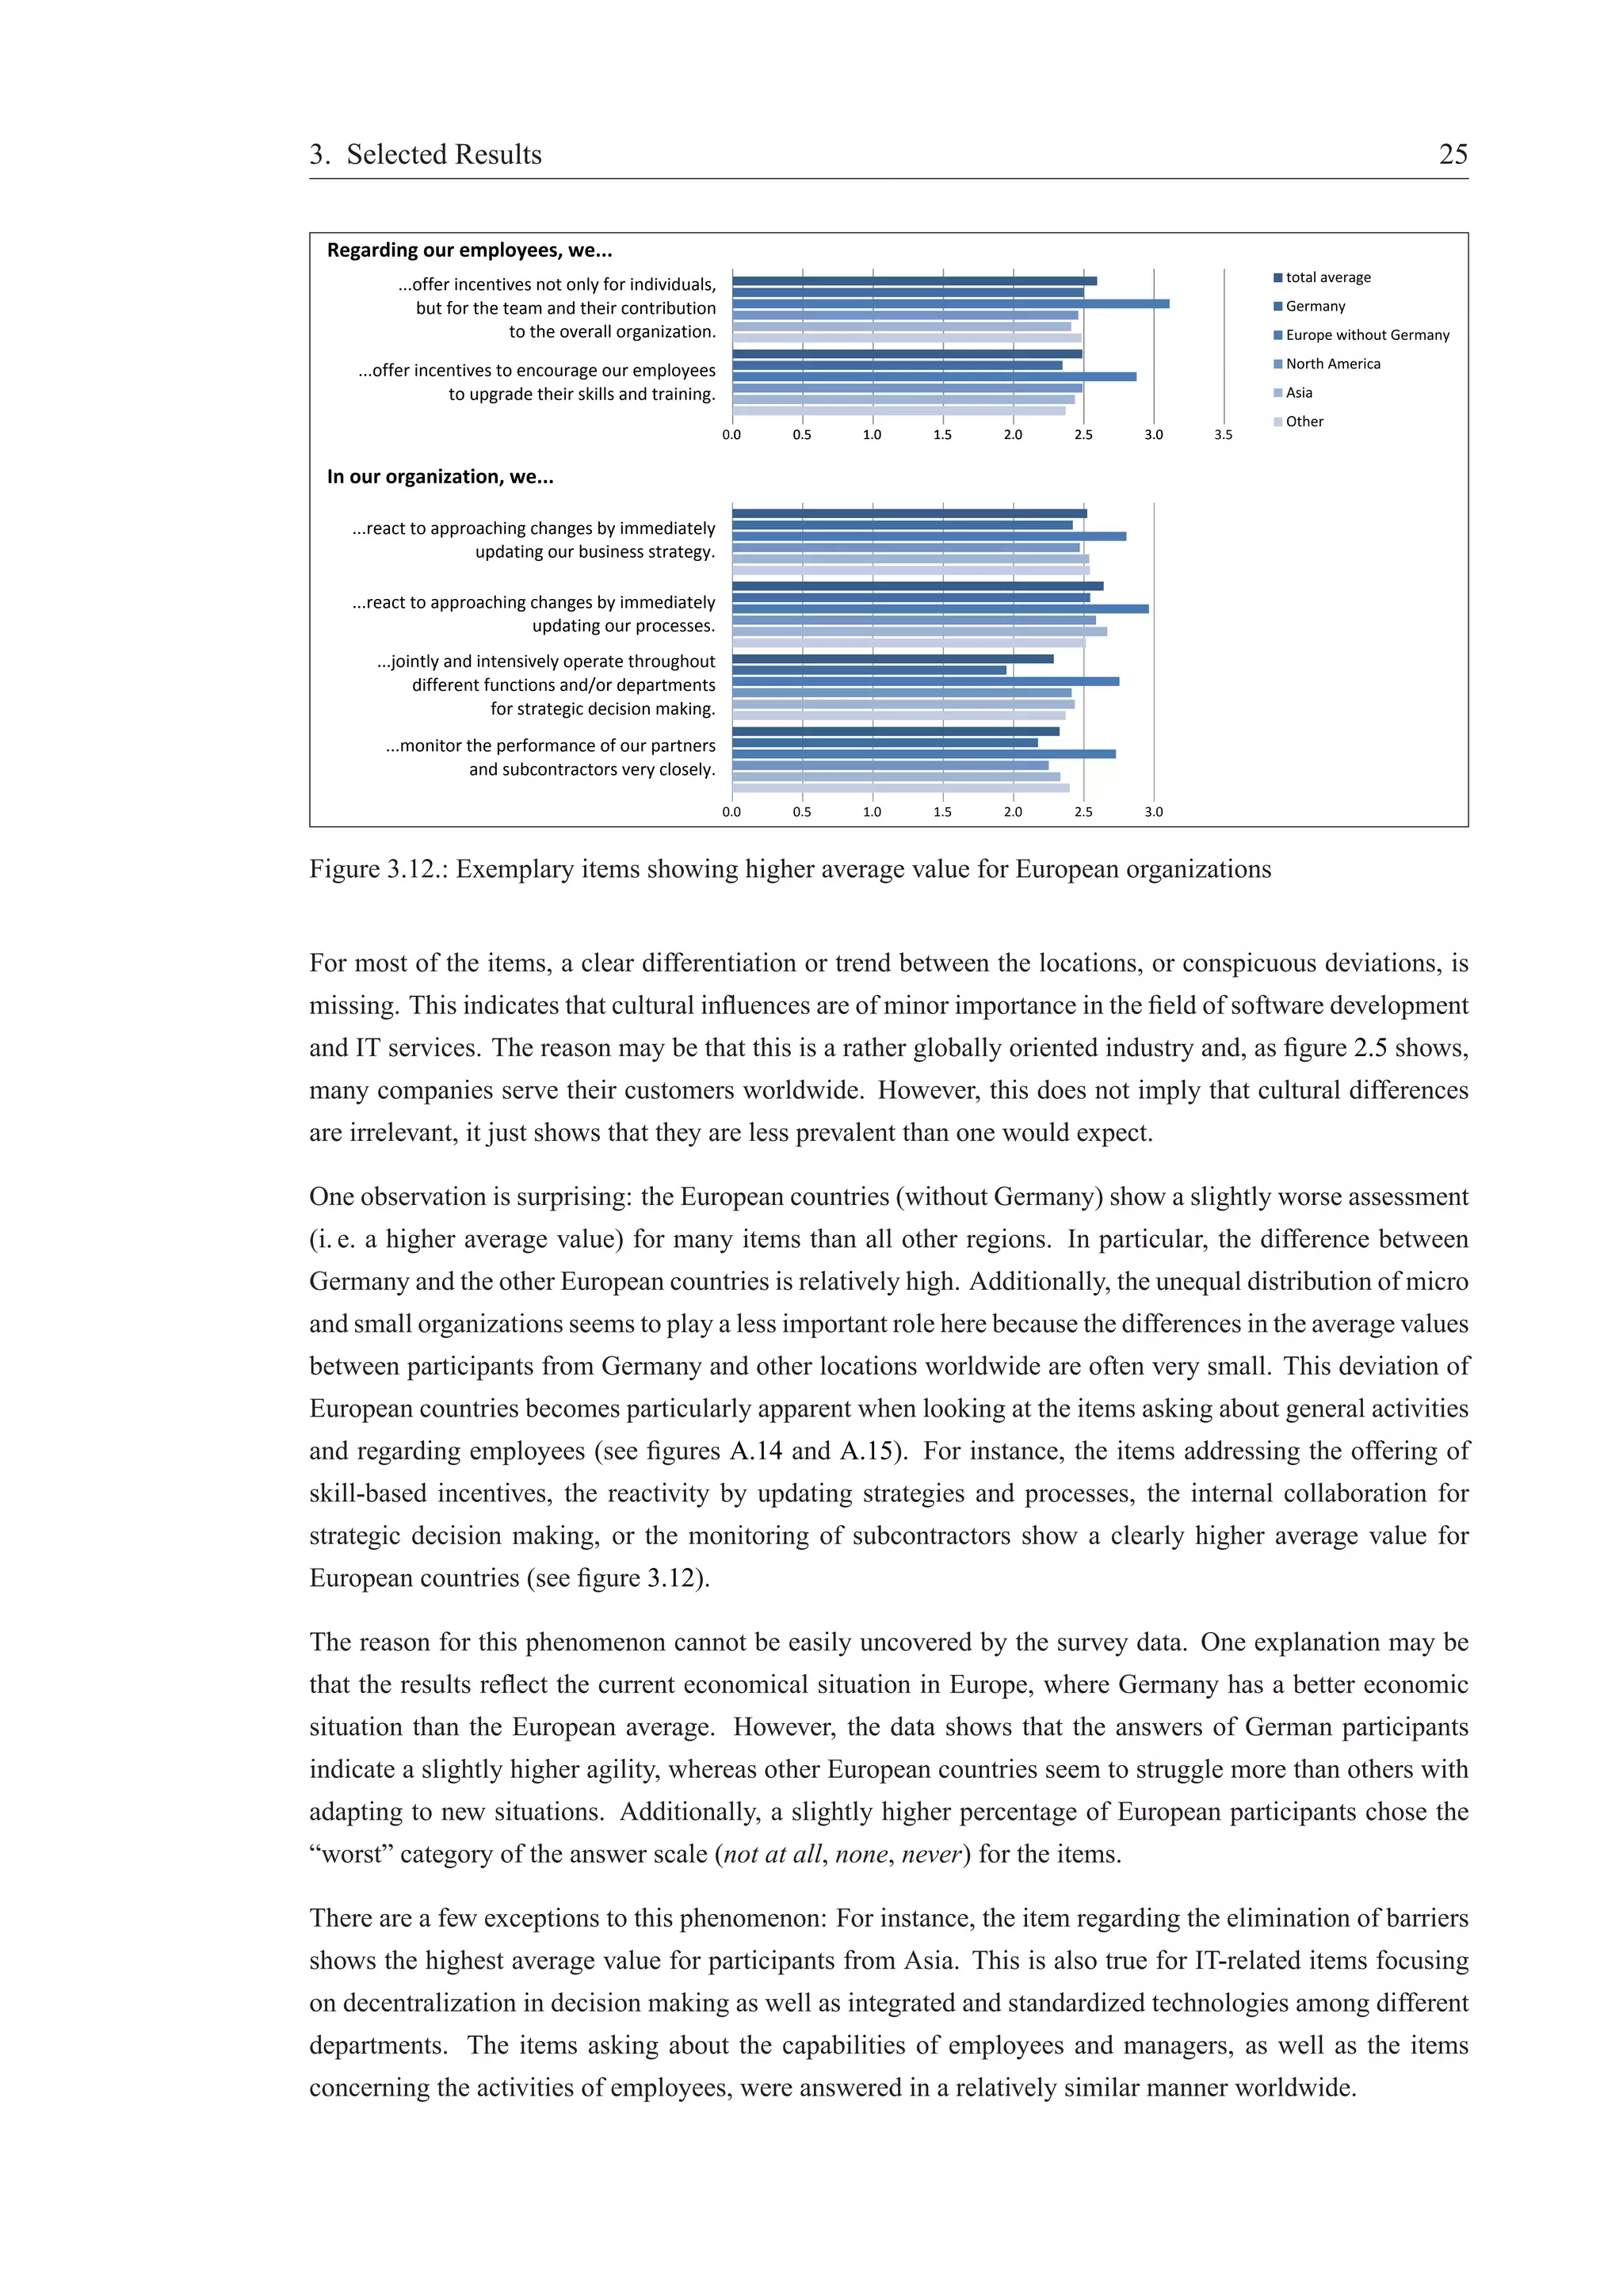
Section 3.2 takes a closer look at various subgroups of participants regarding role, location, company size,
or region of customers. Remarkable and interesting facts are discussed and interpreted. Furthermore,
additional statistics and figures are given in appendix A.4.
3.1. Overview
3.1.1. Agile Values and Principles
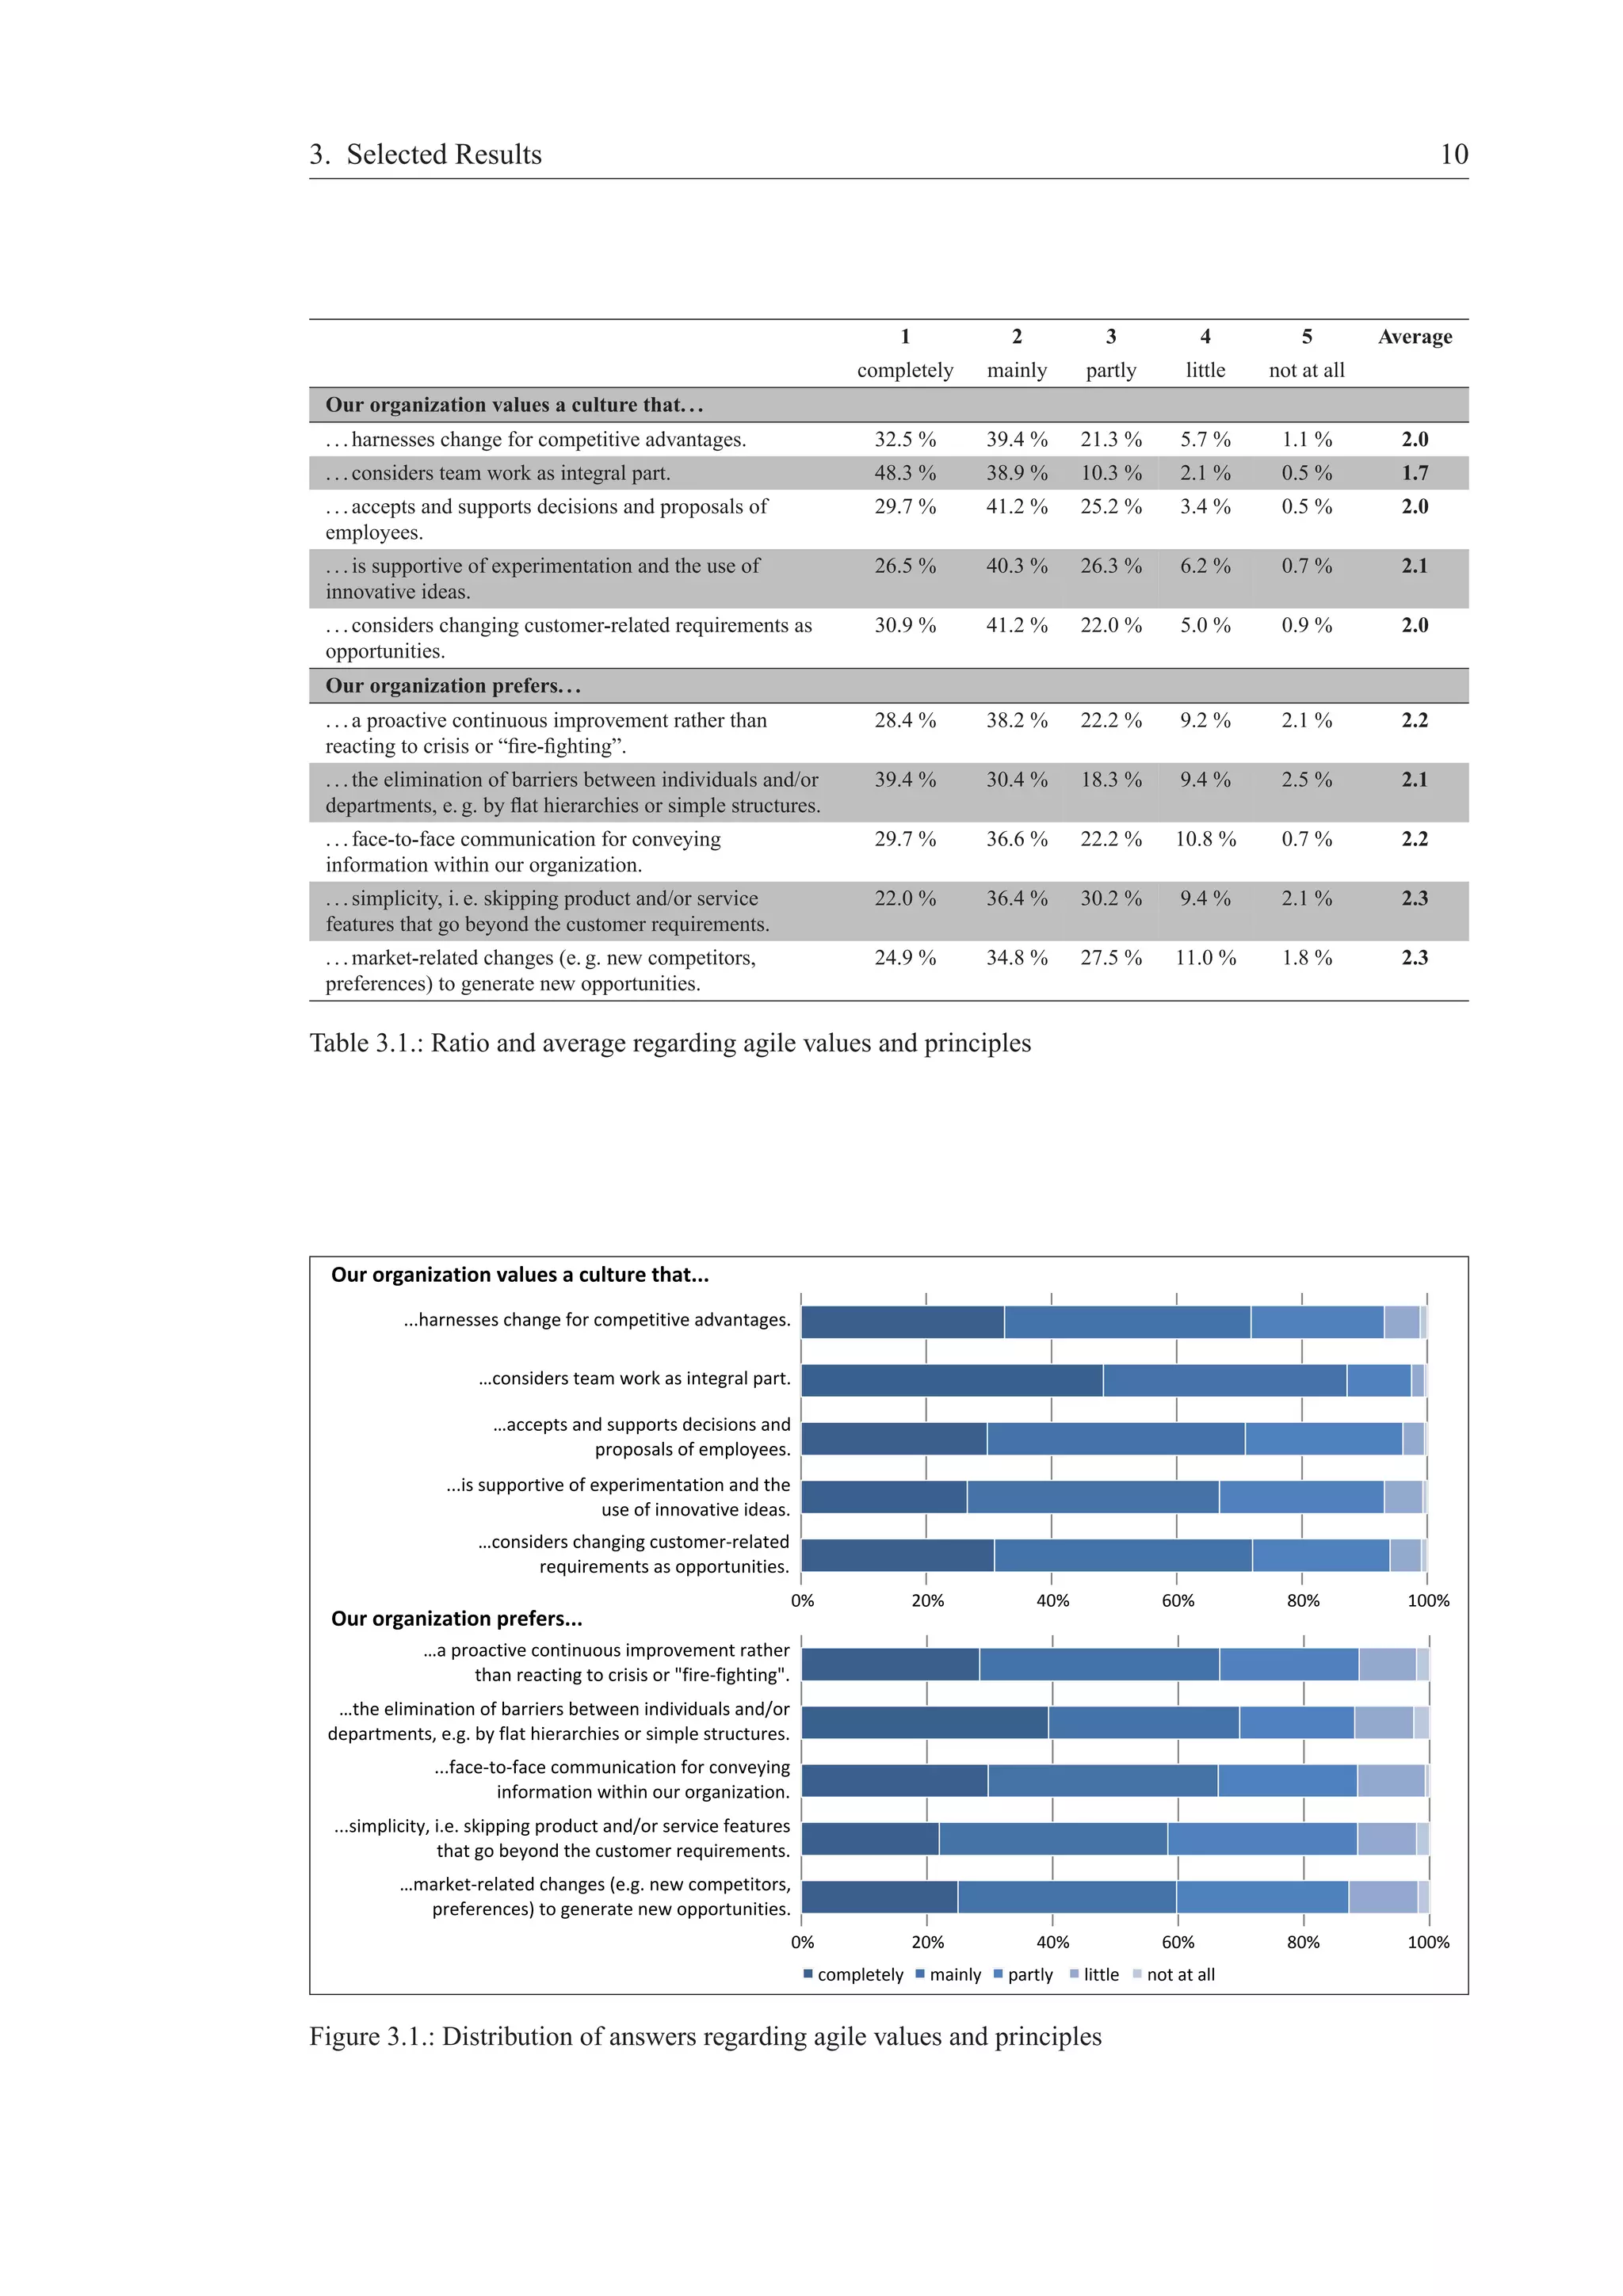
The first section of the questionnaire dealt with values and principles that are prevalent within the organi-zations.
These questions help to determine the overall culture and the way of thinking of the company’s
managers and employees. Table 3.1 summarizes the answers of all participants and averages each item. The
table reveals that all items have an average around 2 (mainly). However, the given percentages for every
item show that there are a variety of answers across the complete scale.
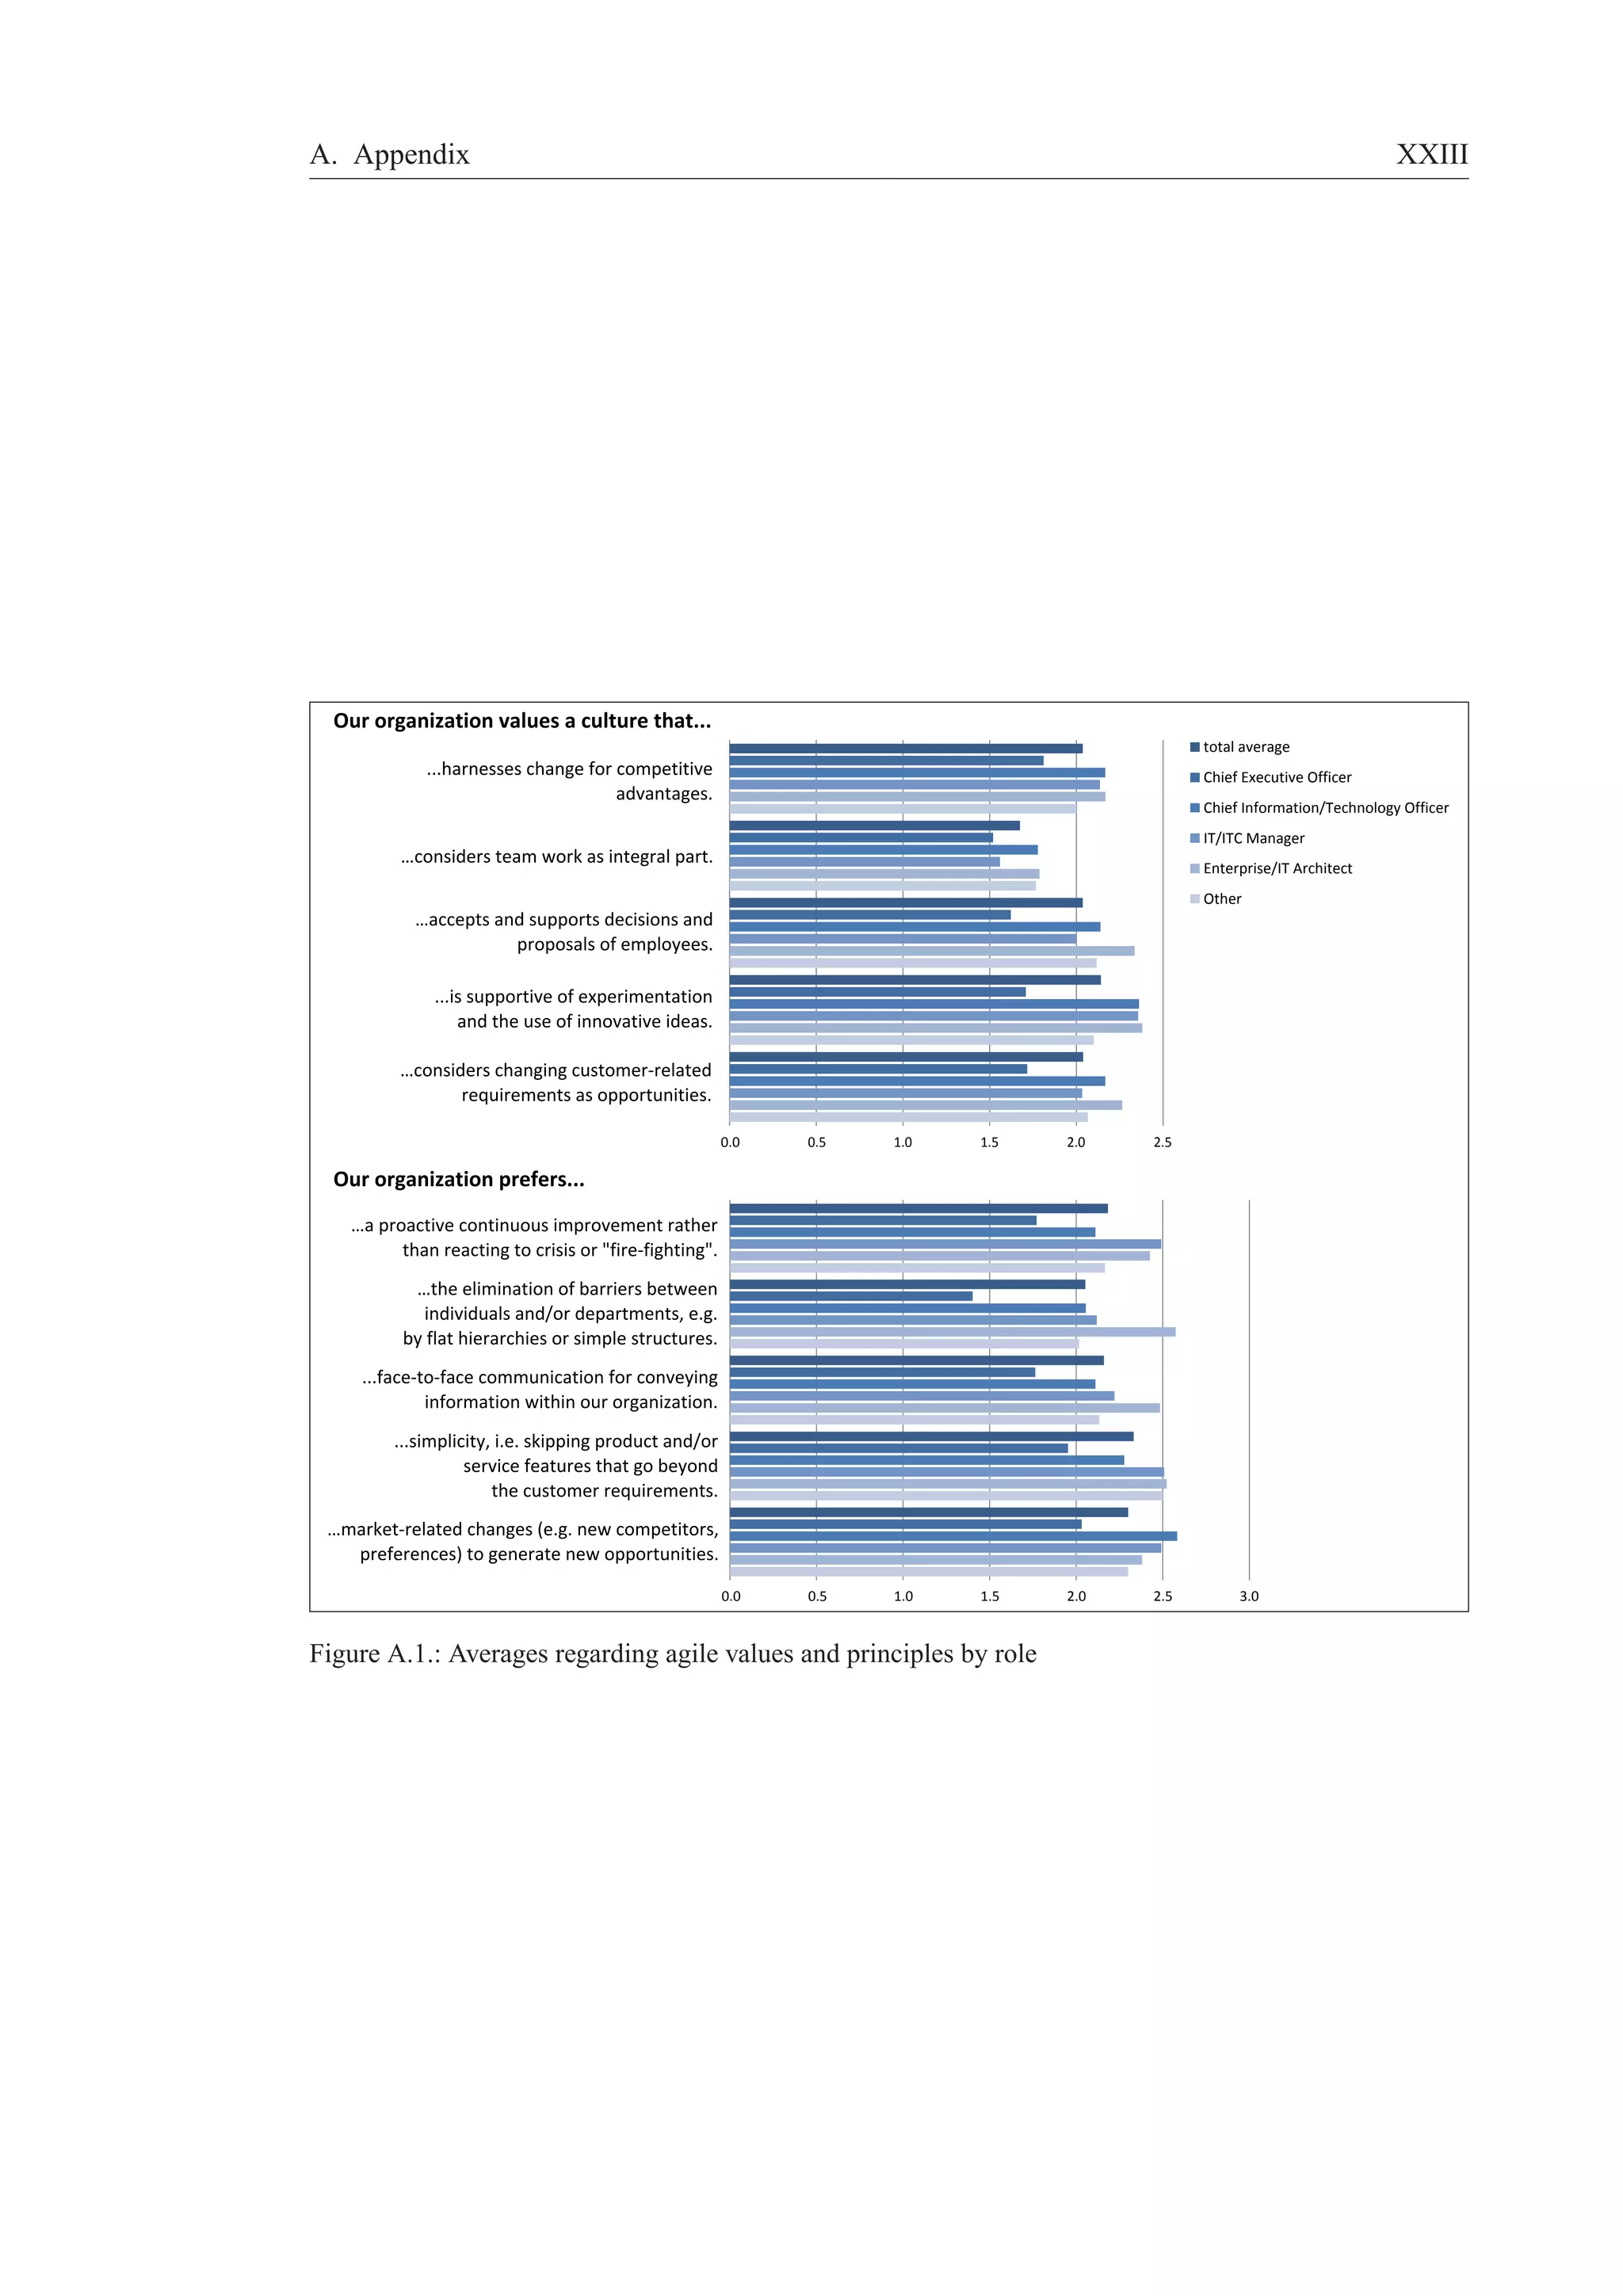
This picture is further illustrated by figure 3.1. It shows that huge parts of the respondents answered the
items with mainly or completely. This indicates a rather agile attitude in most of the participating organi-zations.
Nevertheless, a proportion of approximately 20 to 30 % of the respondents state that they see the
given values and principles only partly fulfilled. Finally, around 10 % say that their company shares these
values and principles little or even not at all.
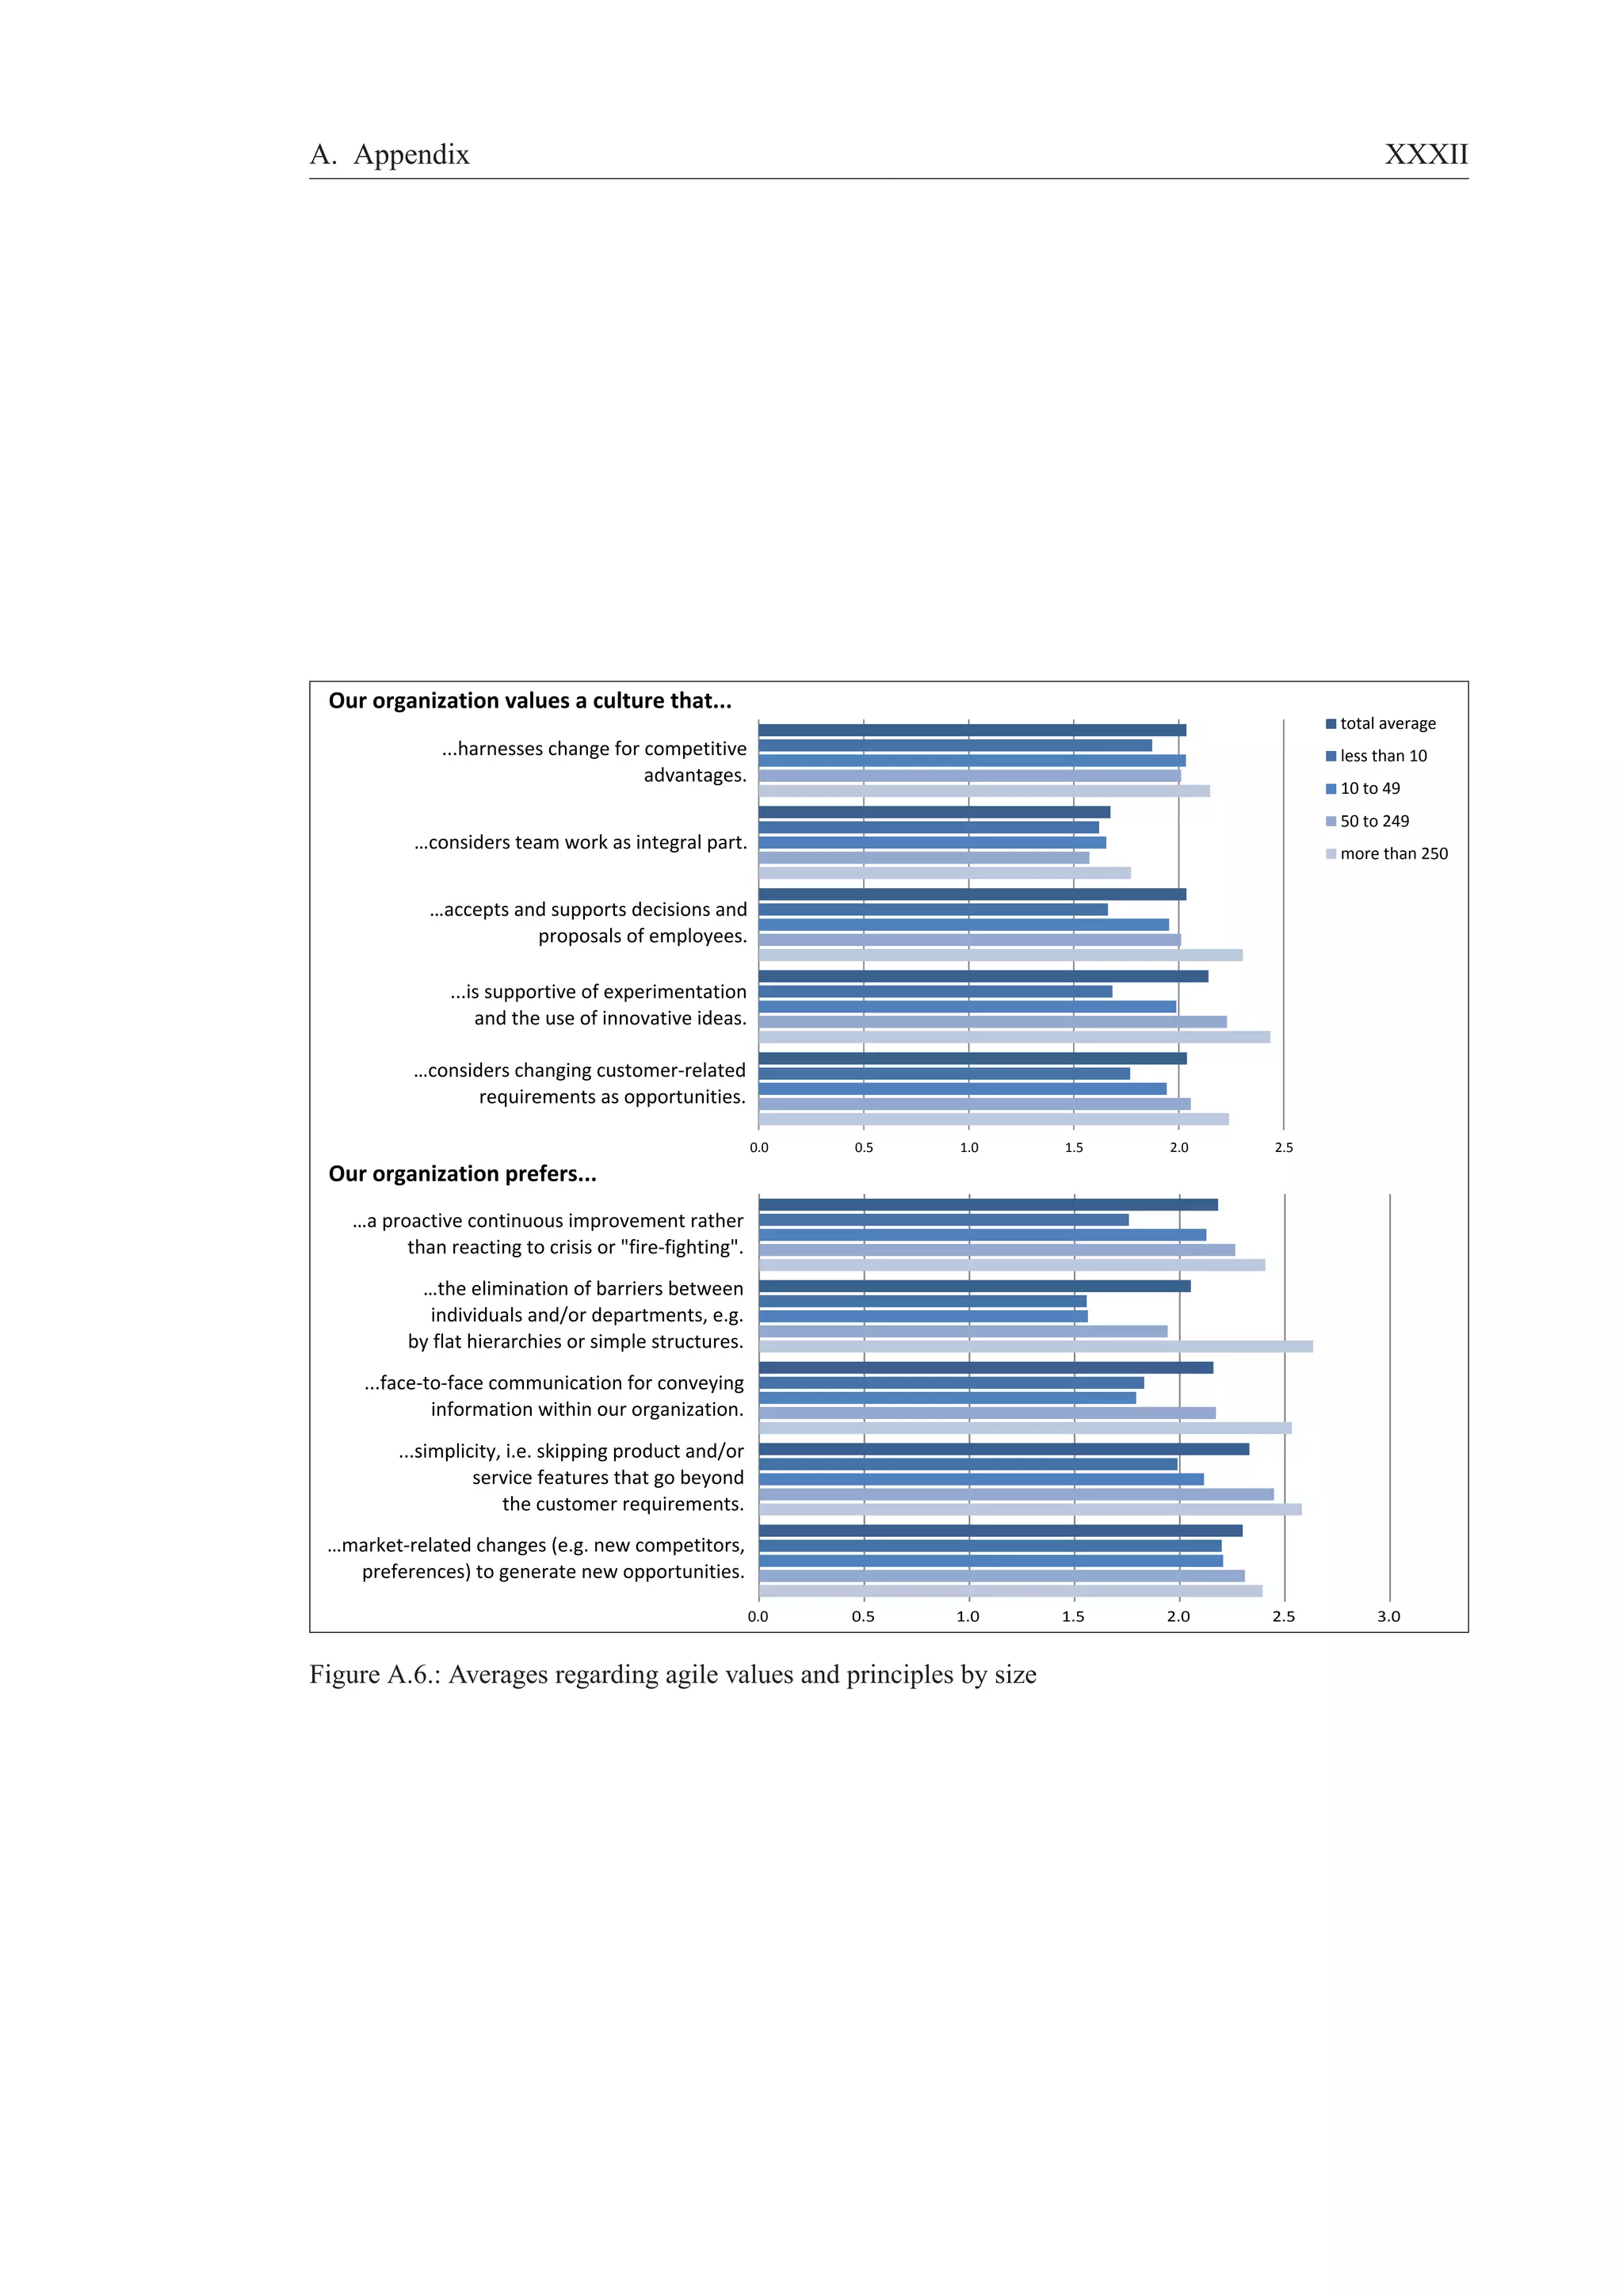
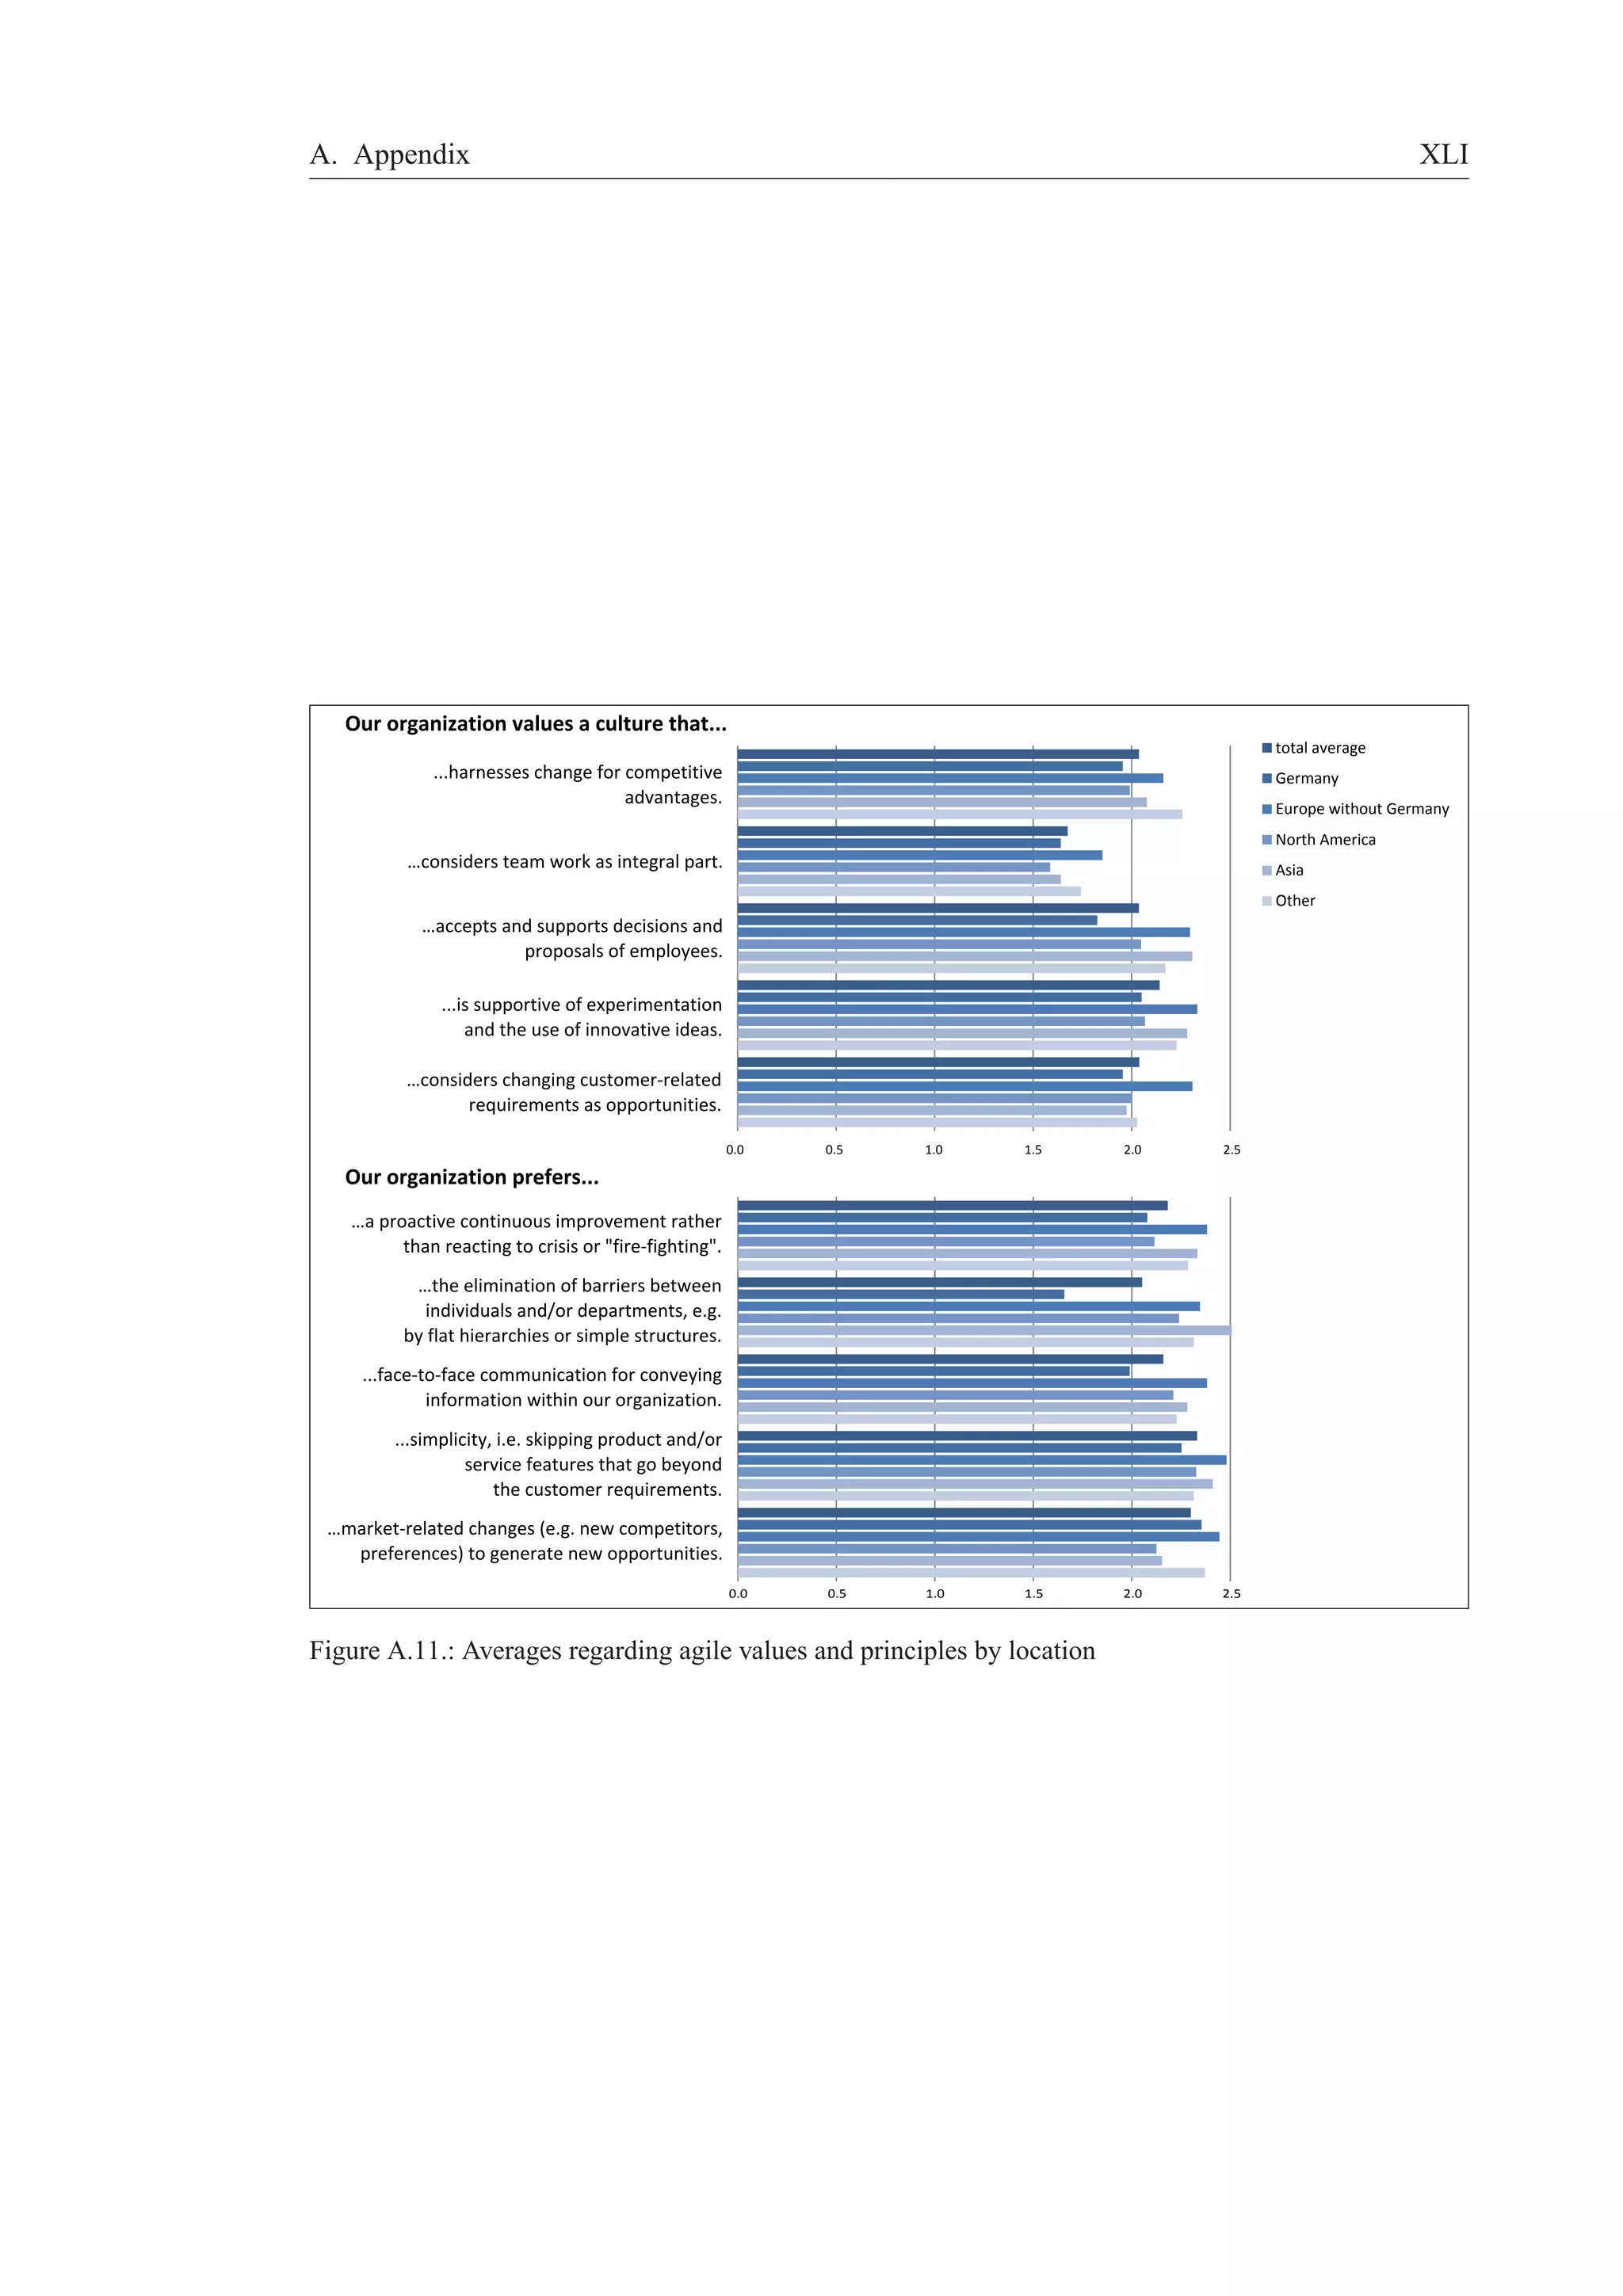
Furthermore, one can recognize that the average values for the first five items, representing the general
values of an organization (“. . . values a culture. . . ”), are slightly lower than for the second group of items,
representing concrete aspects of implementations of such a culture (“. . . prefer. . . ”). Hence, one may con-clude
that the majority of respondents states that their organization shares agile values but cannot put them
into practice accordingly.
The following is an illustrative example: nearly three quarters state that their company values a culture
that “considers changing customer-related requirements as opportunities” completely or mainly. But at the
same time, more than 40 % stated that their company prefers “simplicity, i. e. skipping [...] features that go
beyond the customer requirements” and “market-related changes [...] to generate new opportunities” partly
at best. This indicates that there may be room for improvements regarding customer-related behavior.](https://image.slidesharecdn.com/gelbe-reiheagility-survey-140826135420-phpapp02/75/WHAT-CONSTITUTES-AN-AGILE-ORGANIZATION-DESCRIPTIVE-RESULTS-OF-AN-EMPIRICAL-INVESTIGATION-16-2048.jpg)
![3. Selected Results 12
Our organization has...
...effective "top-down" and "bottom-up"
communication processes.
...an intensive employee training program.
...employees that have a good understanding of how
their own job relates to the firm's overall activity.
…a strategy that is clearly communicated to all
hierarchical levels in terms easily understood by all.
...a strategic vision that allows flexibility for
market changes from the very start.
Our organization has Information Systems and Technologies that...
…make organizational information easily
accessible to all employees.
...provide information helping our employees
to quickly respond to changes.
…are appropriate to our needs and allow us
to be competitive in the marketplace.
...enable decentralization in decision making.
...are integrated amongst different
departments and/or business units.
…are standardized or comparable amongst
different departments and/or business units.
...enable us to fully integrate our customers
and partners into our processes.
0% 20% 40% 60% 80% 100%
0% 20% 40% 60% 80% 100%
completely mainly partly little not at all
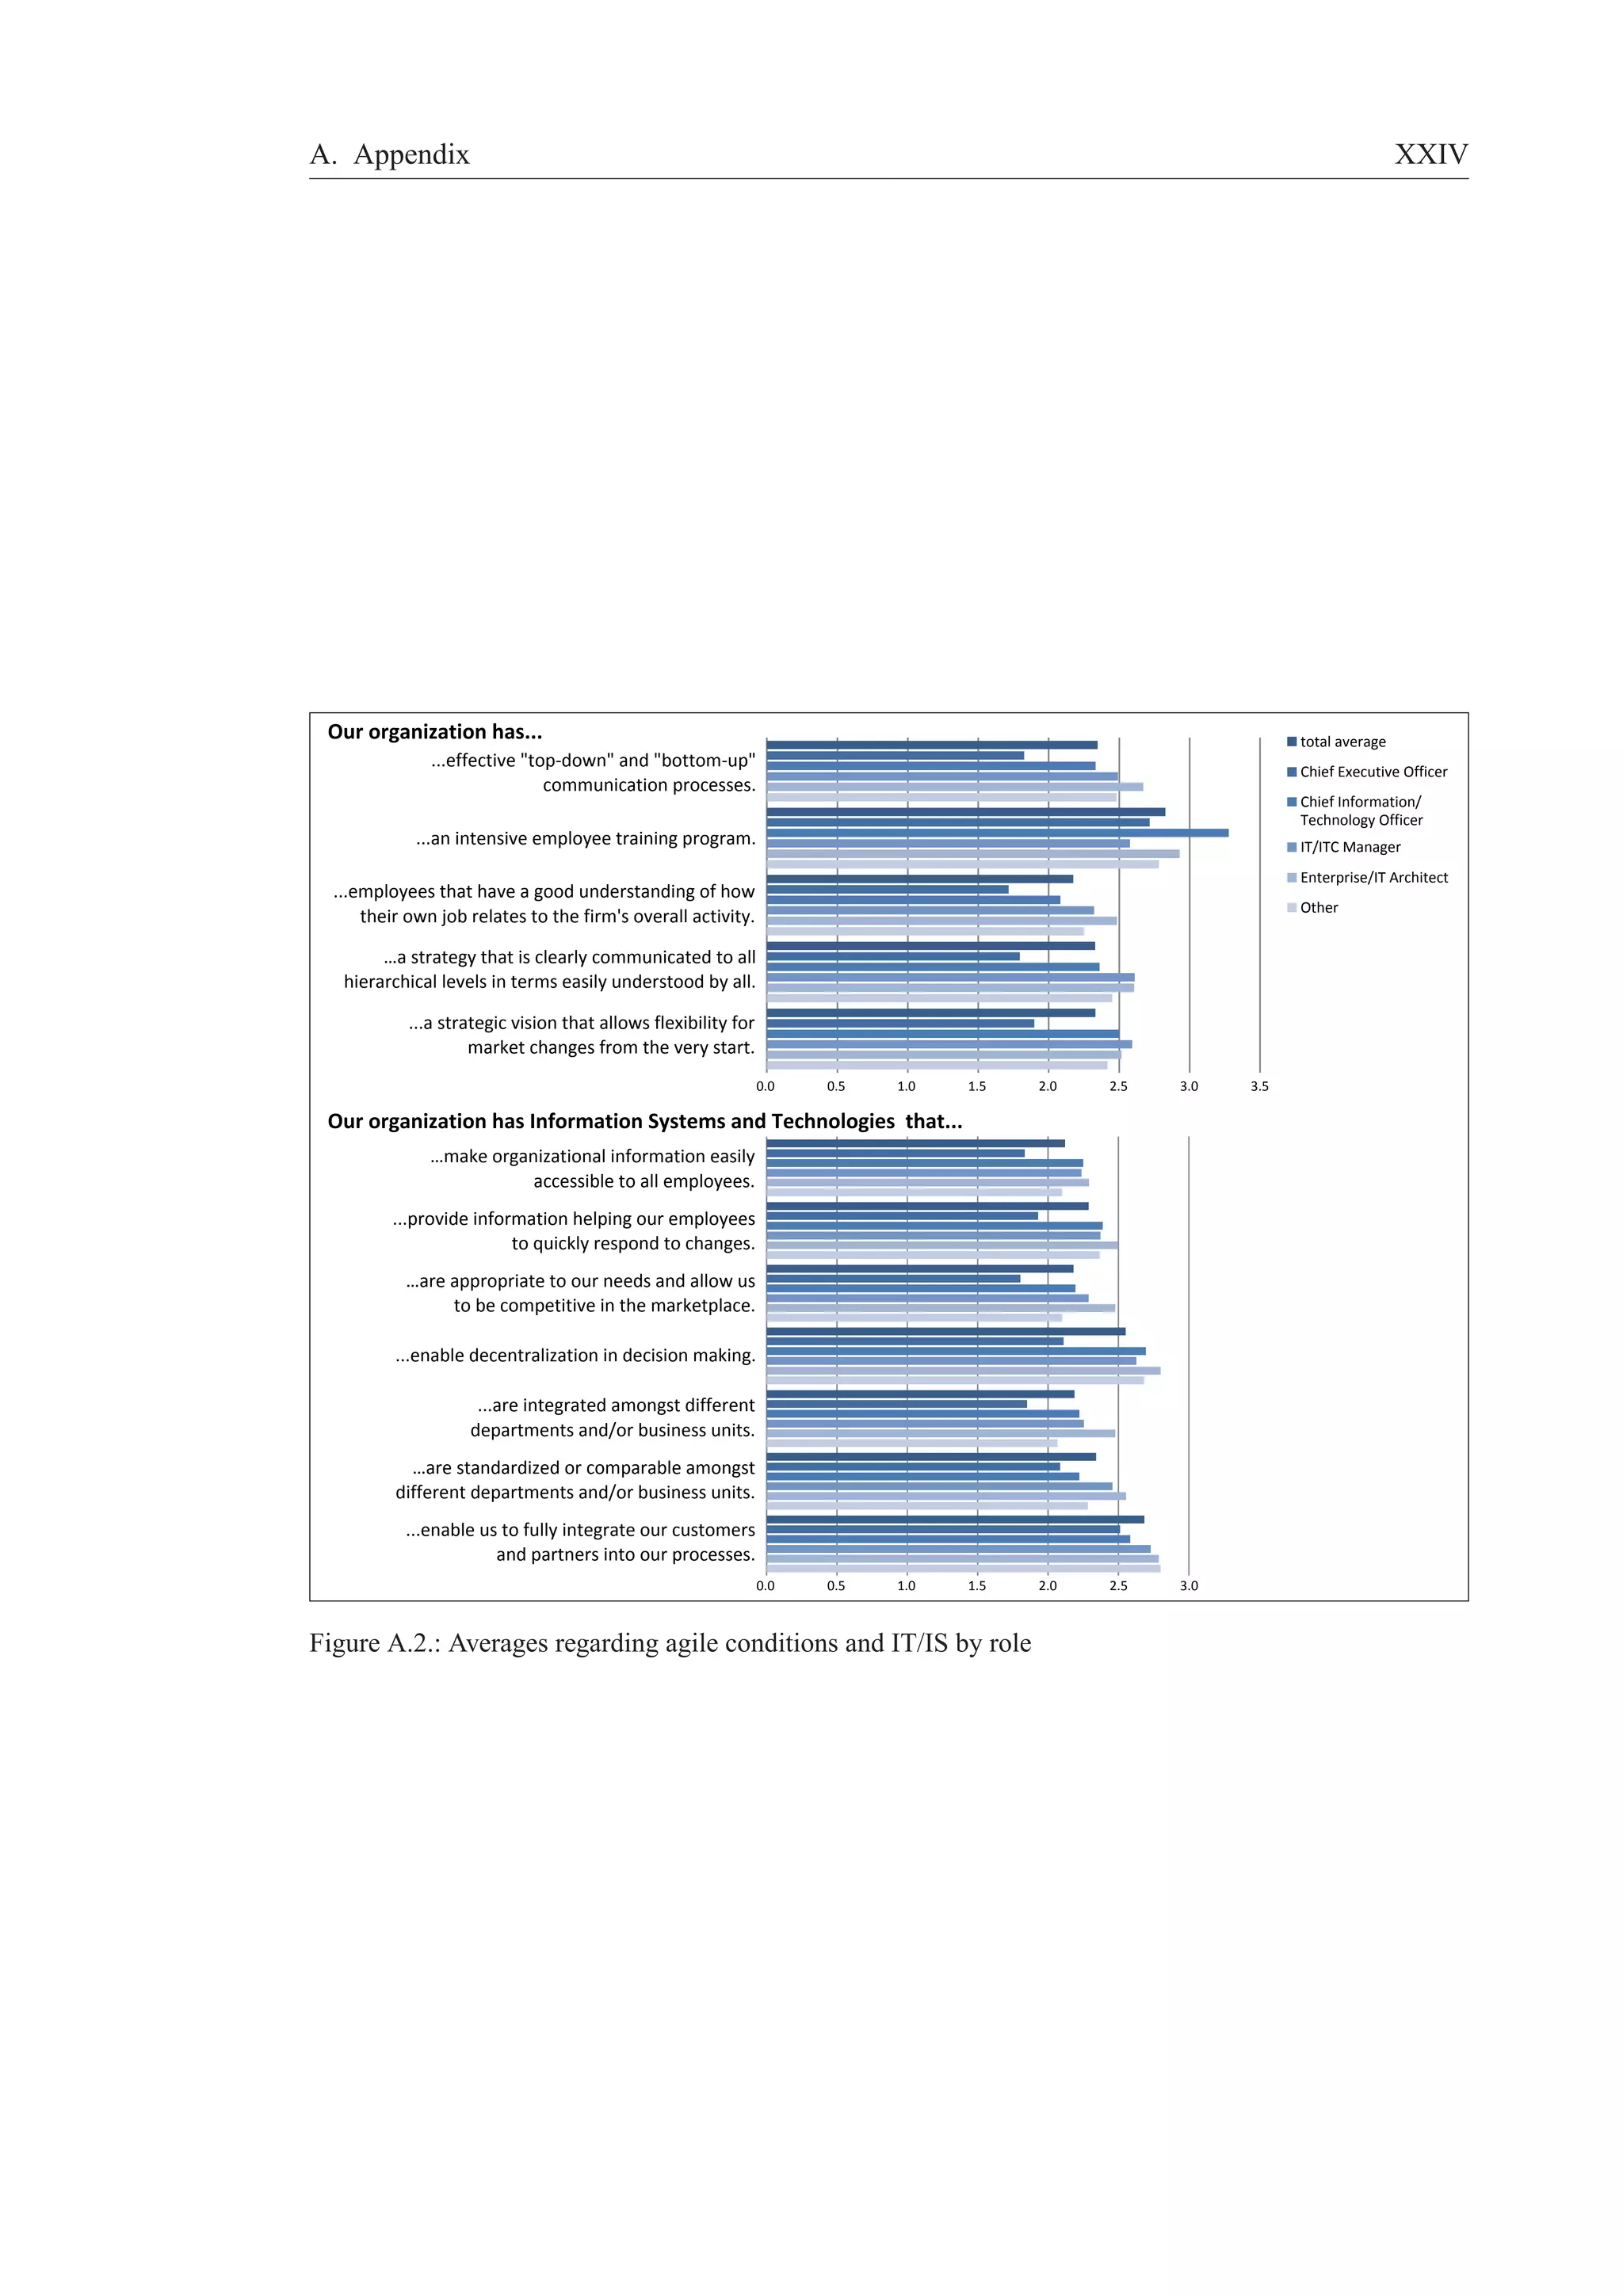
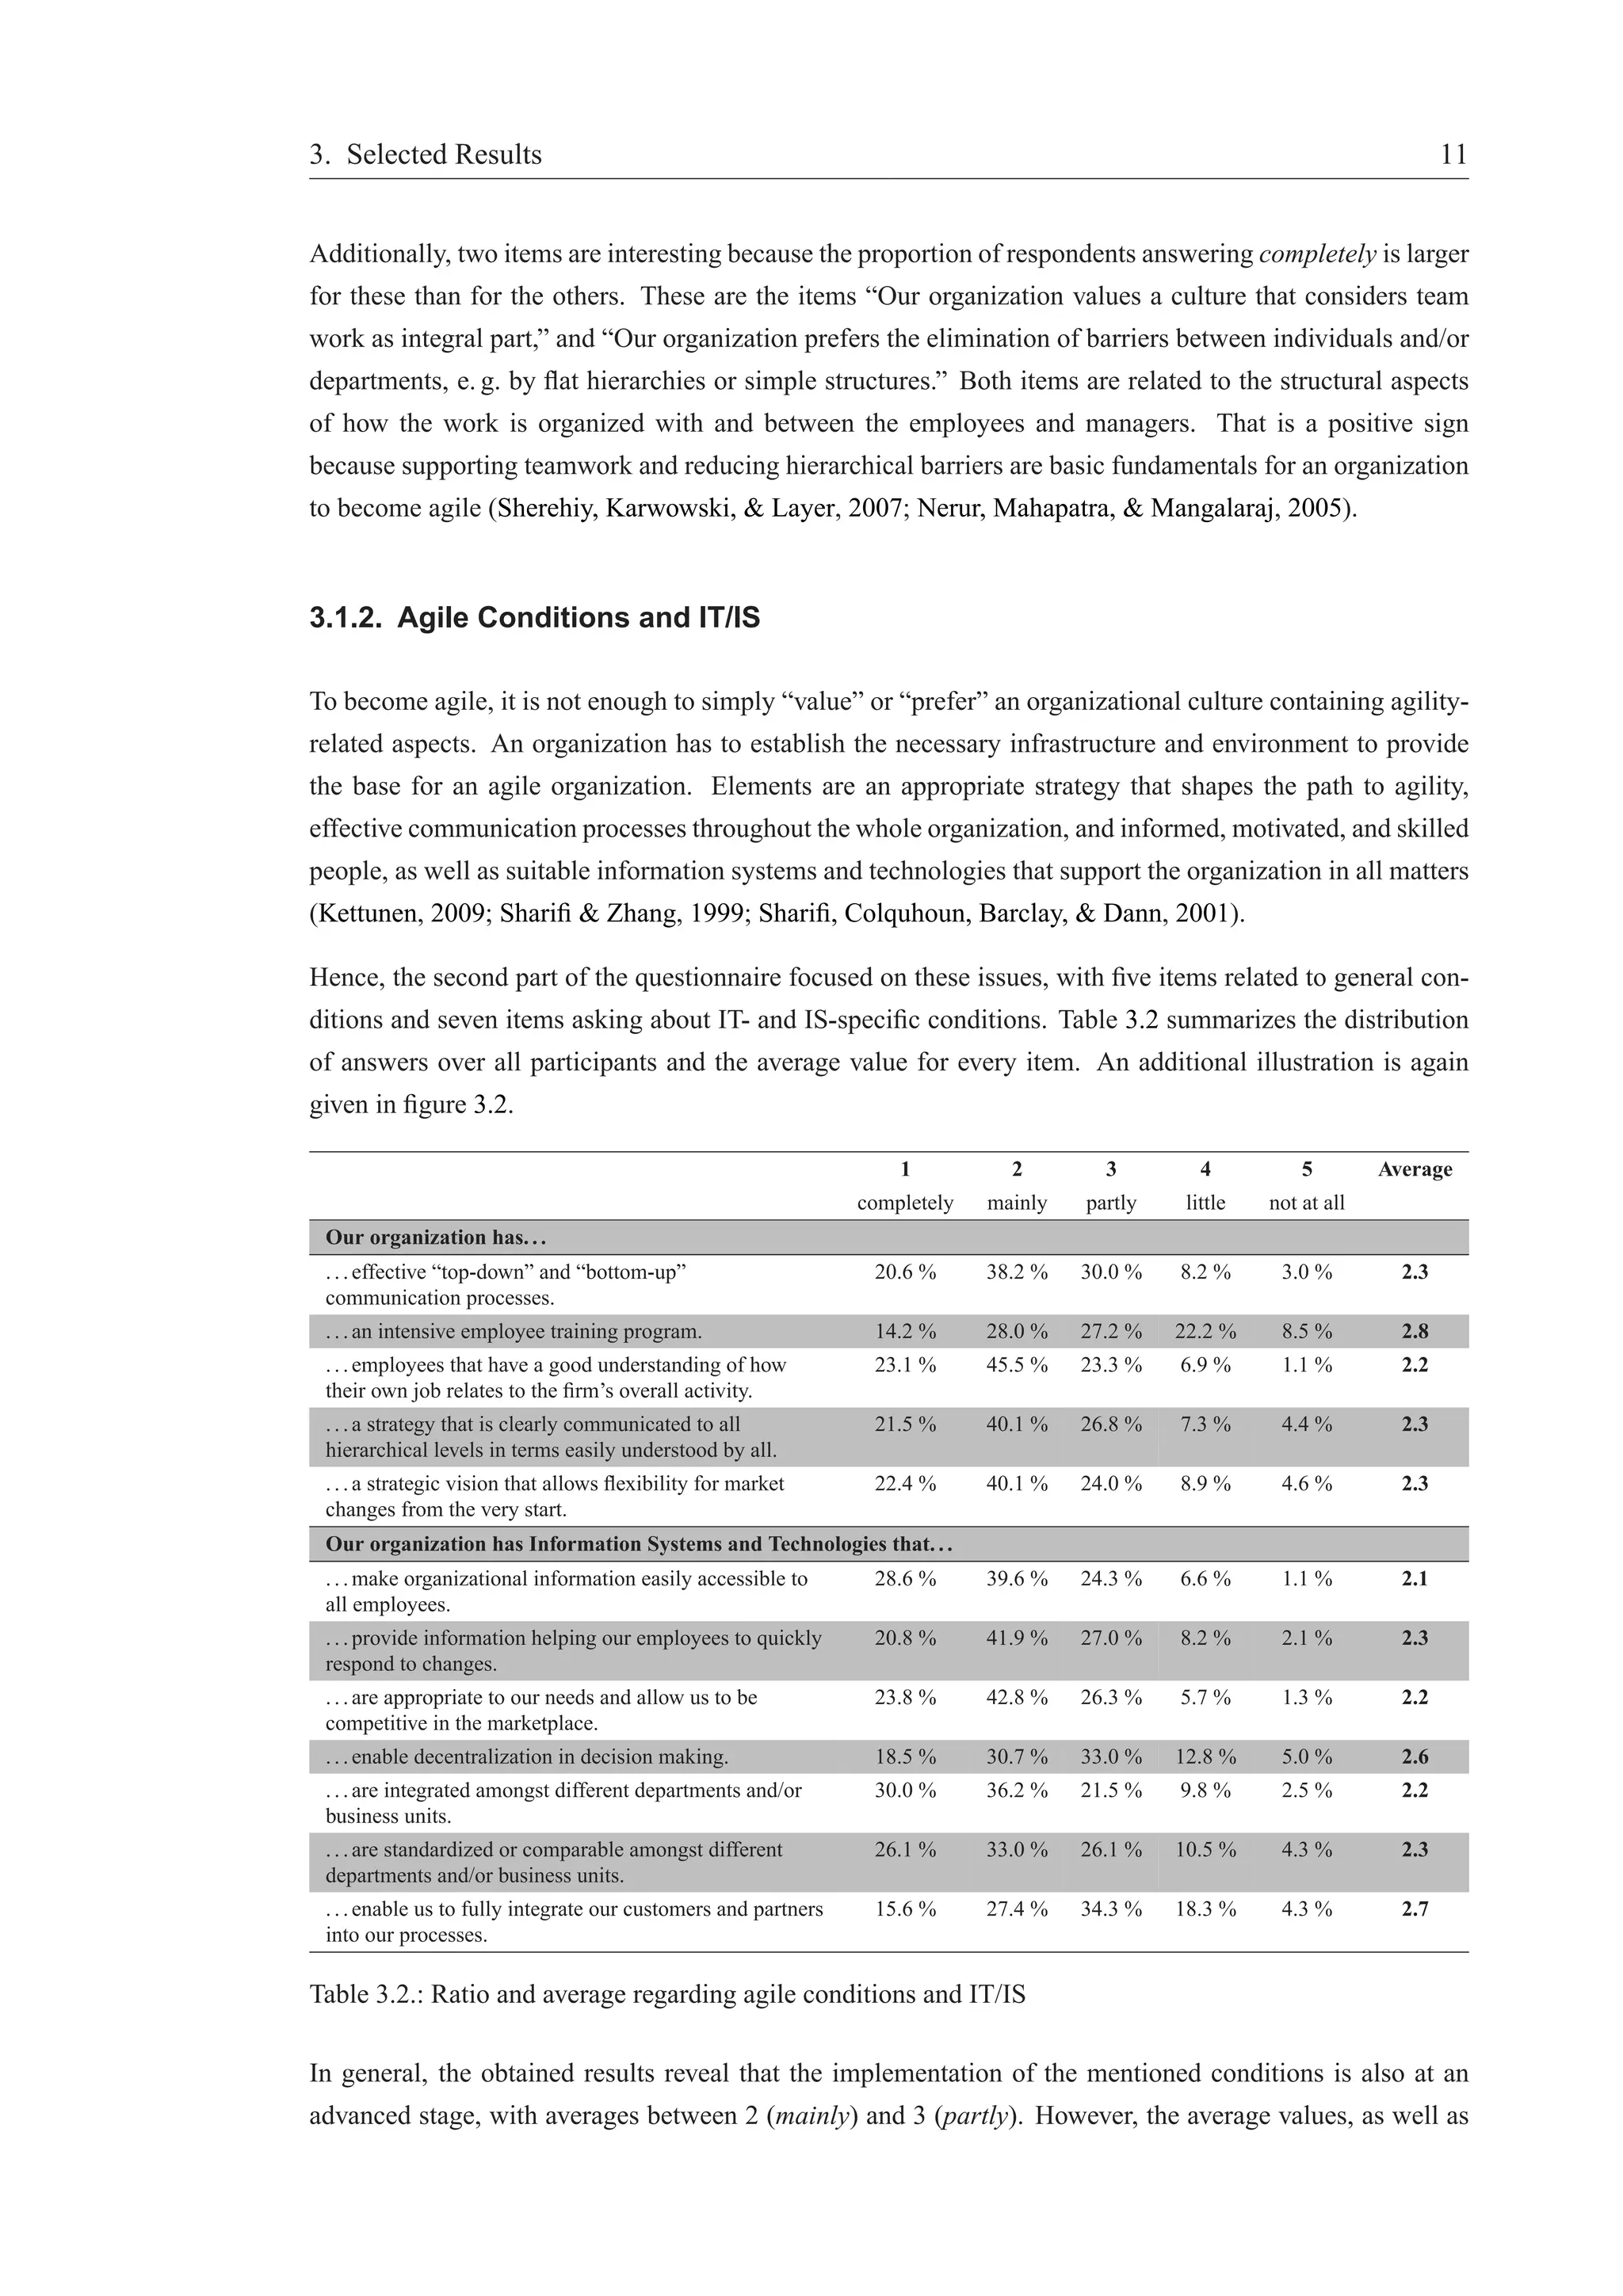
Figure 3.2.: Distribution of answers regarding agile conditions and IT/IS
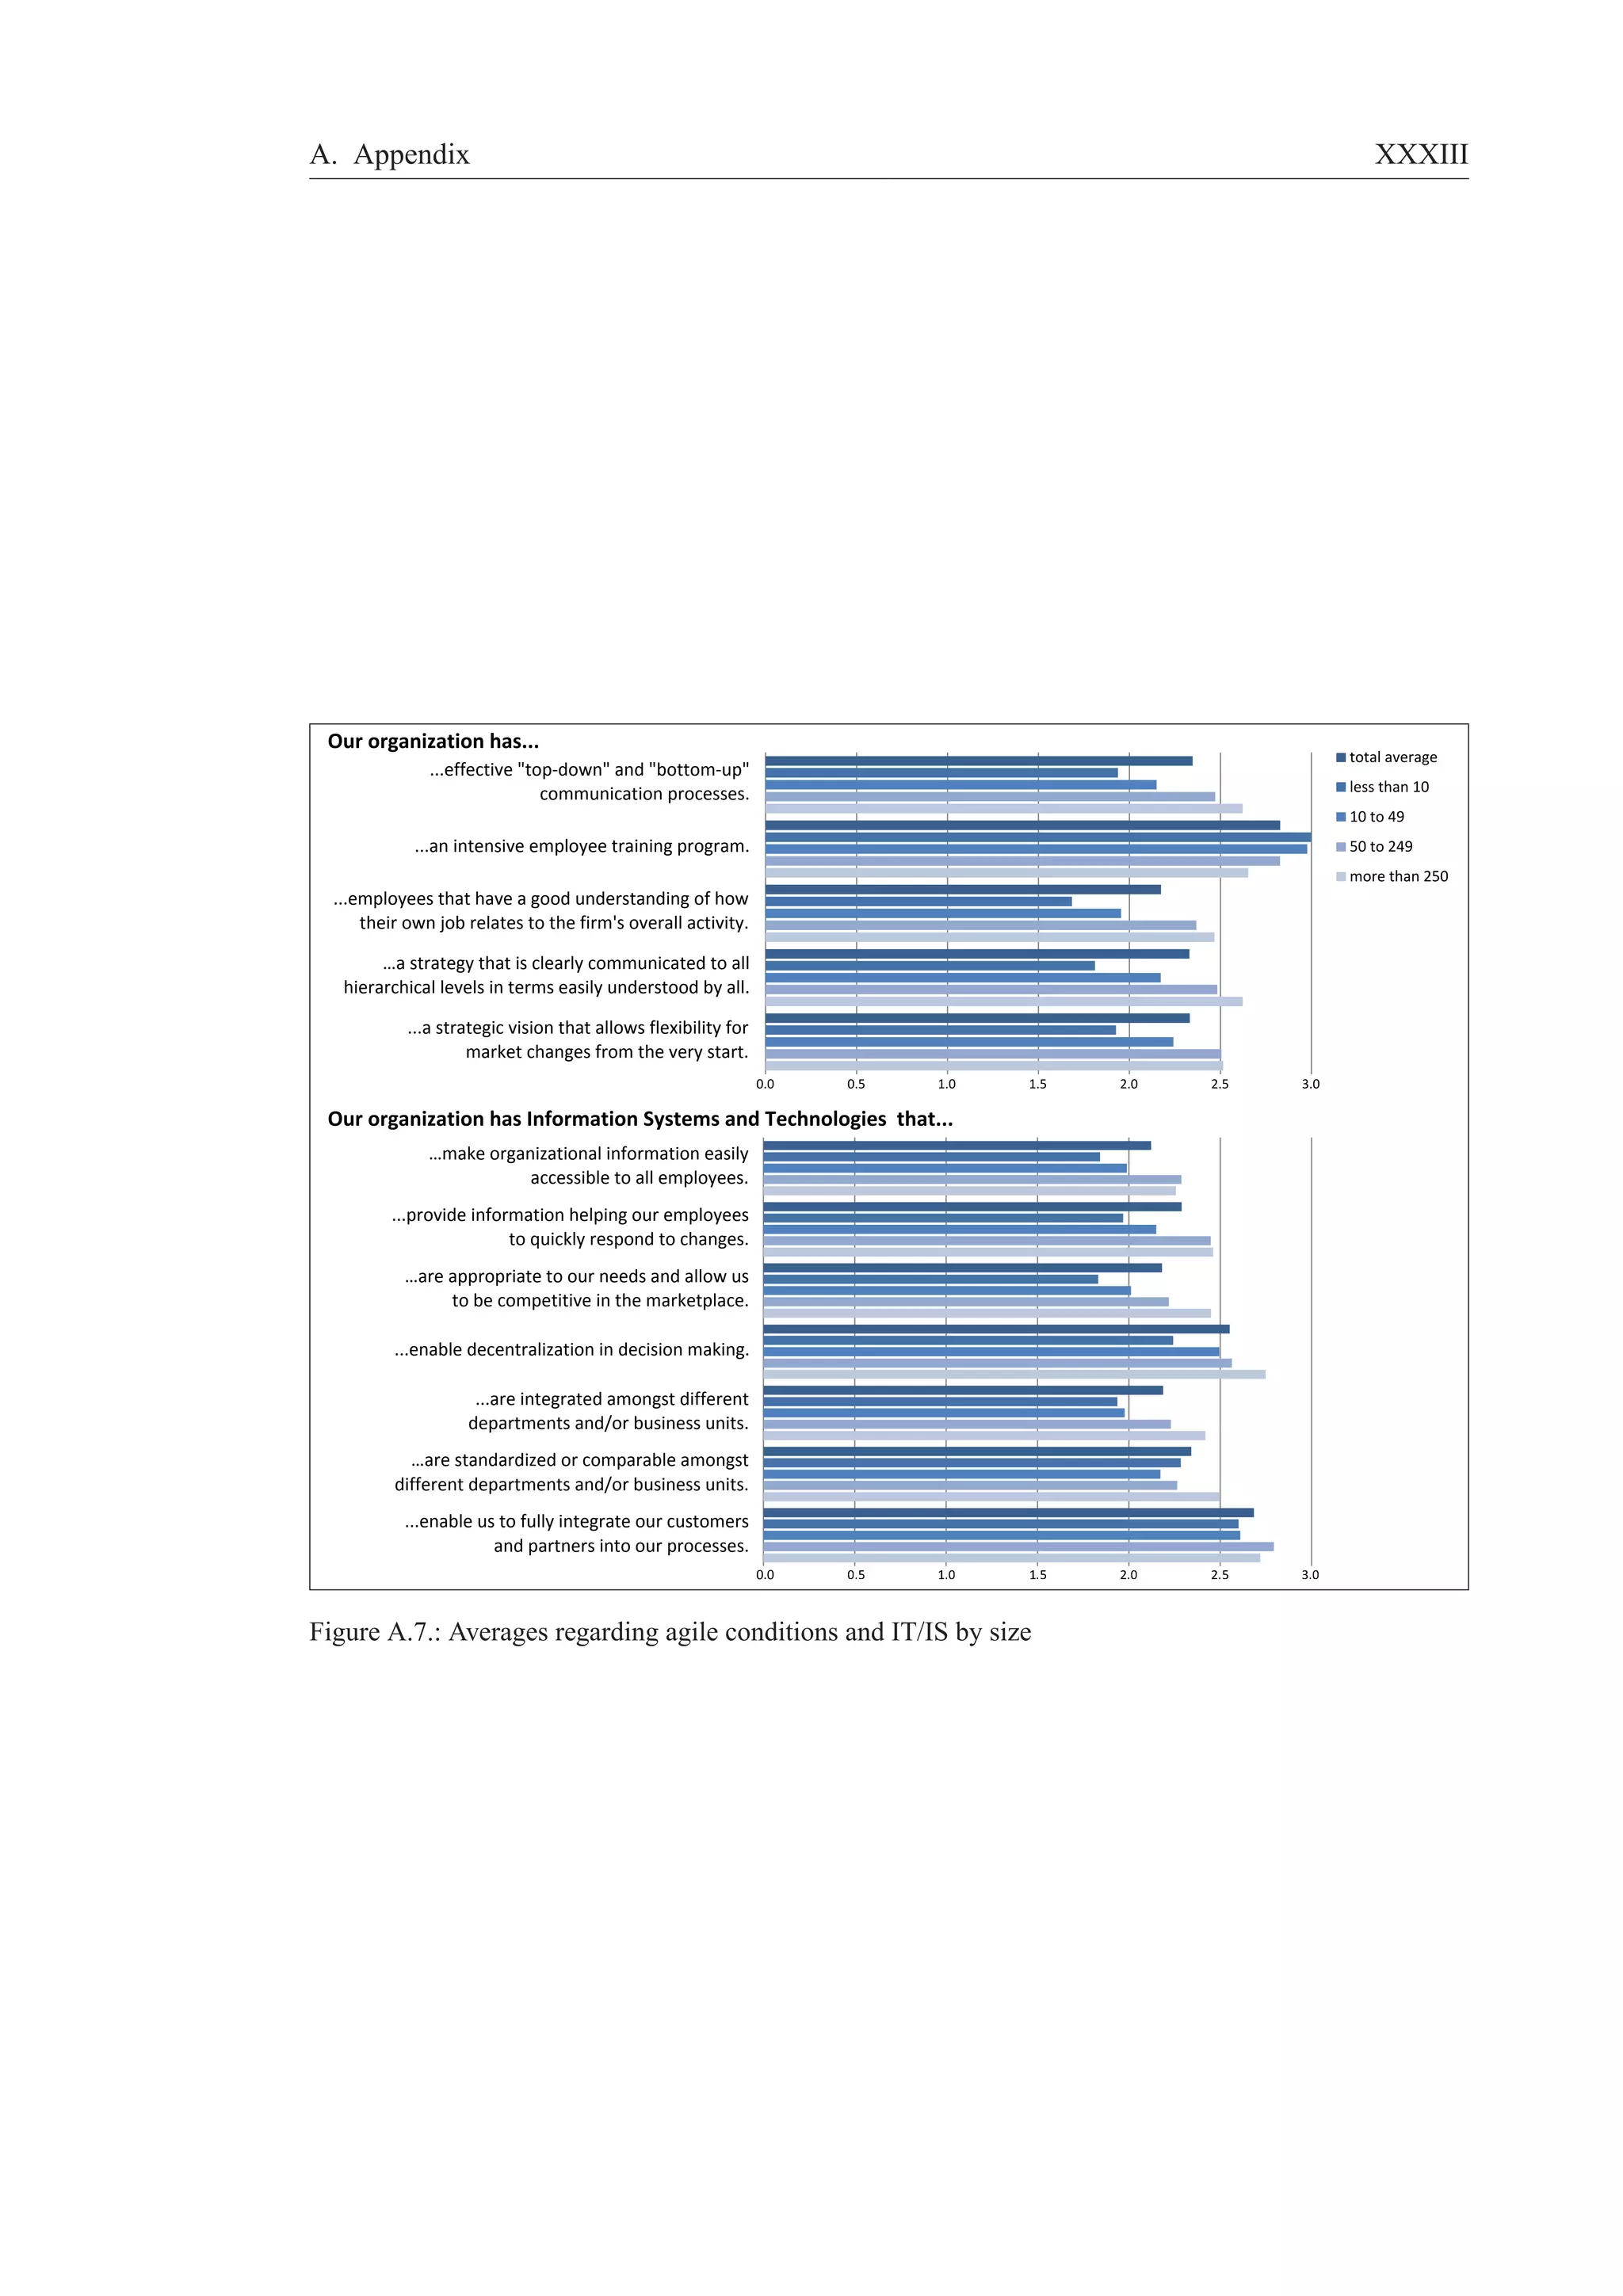
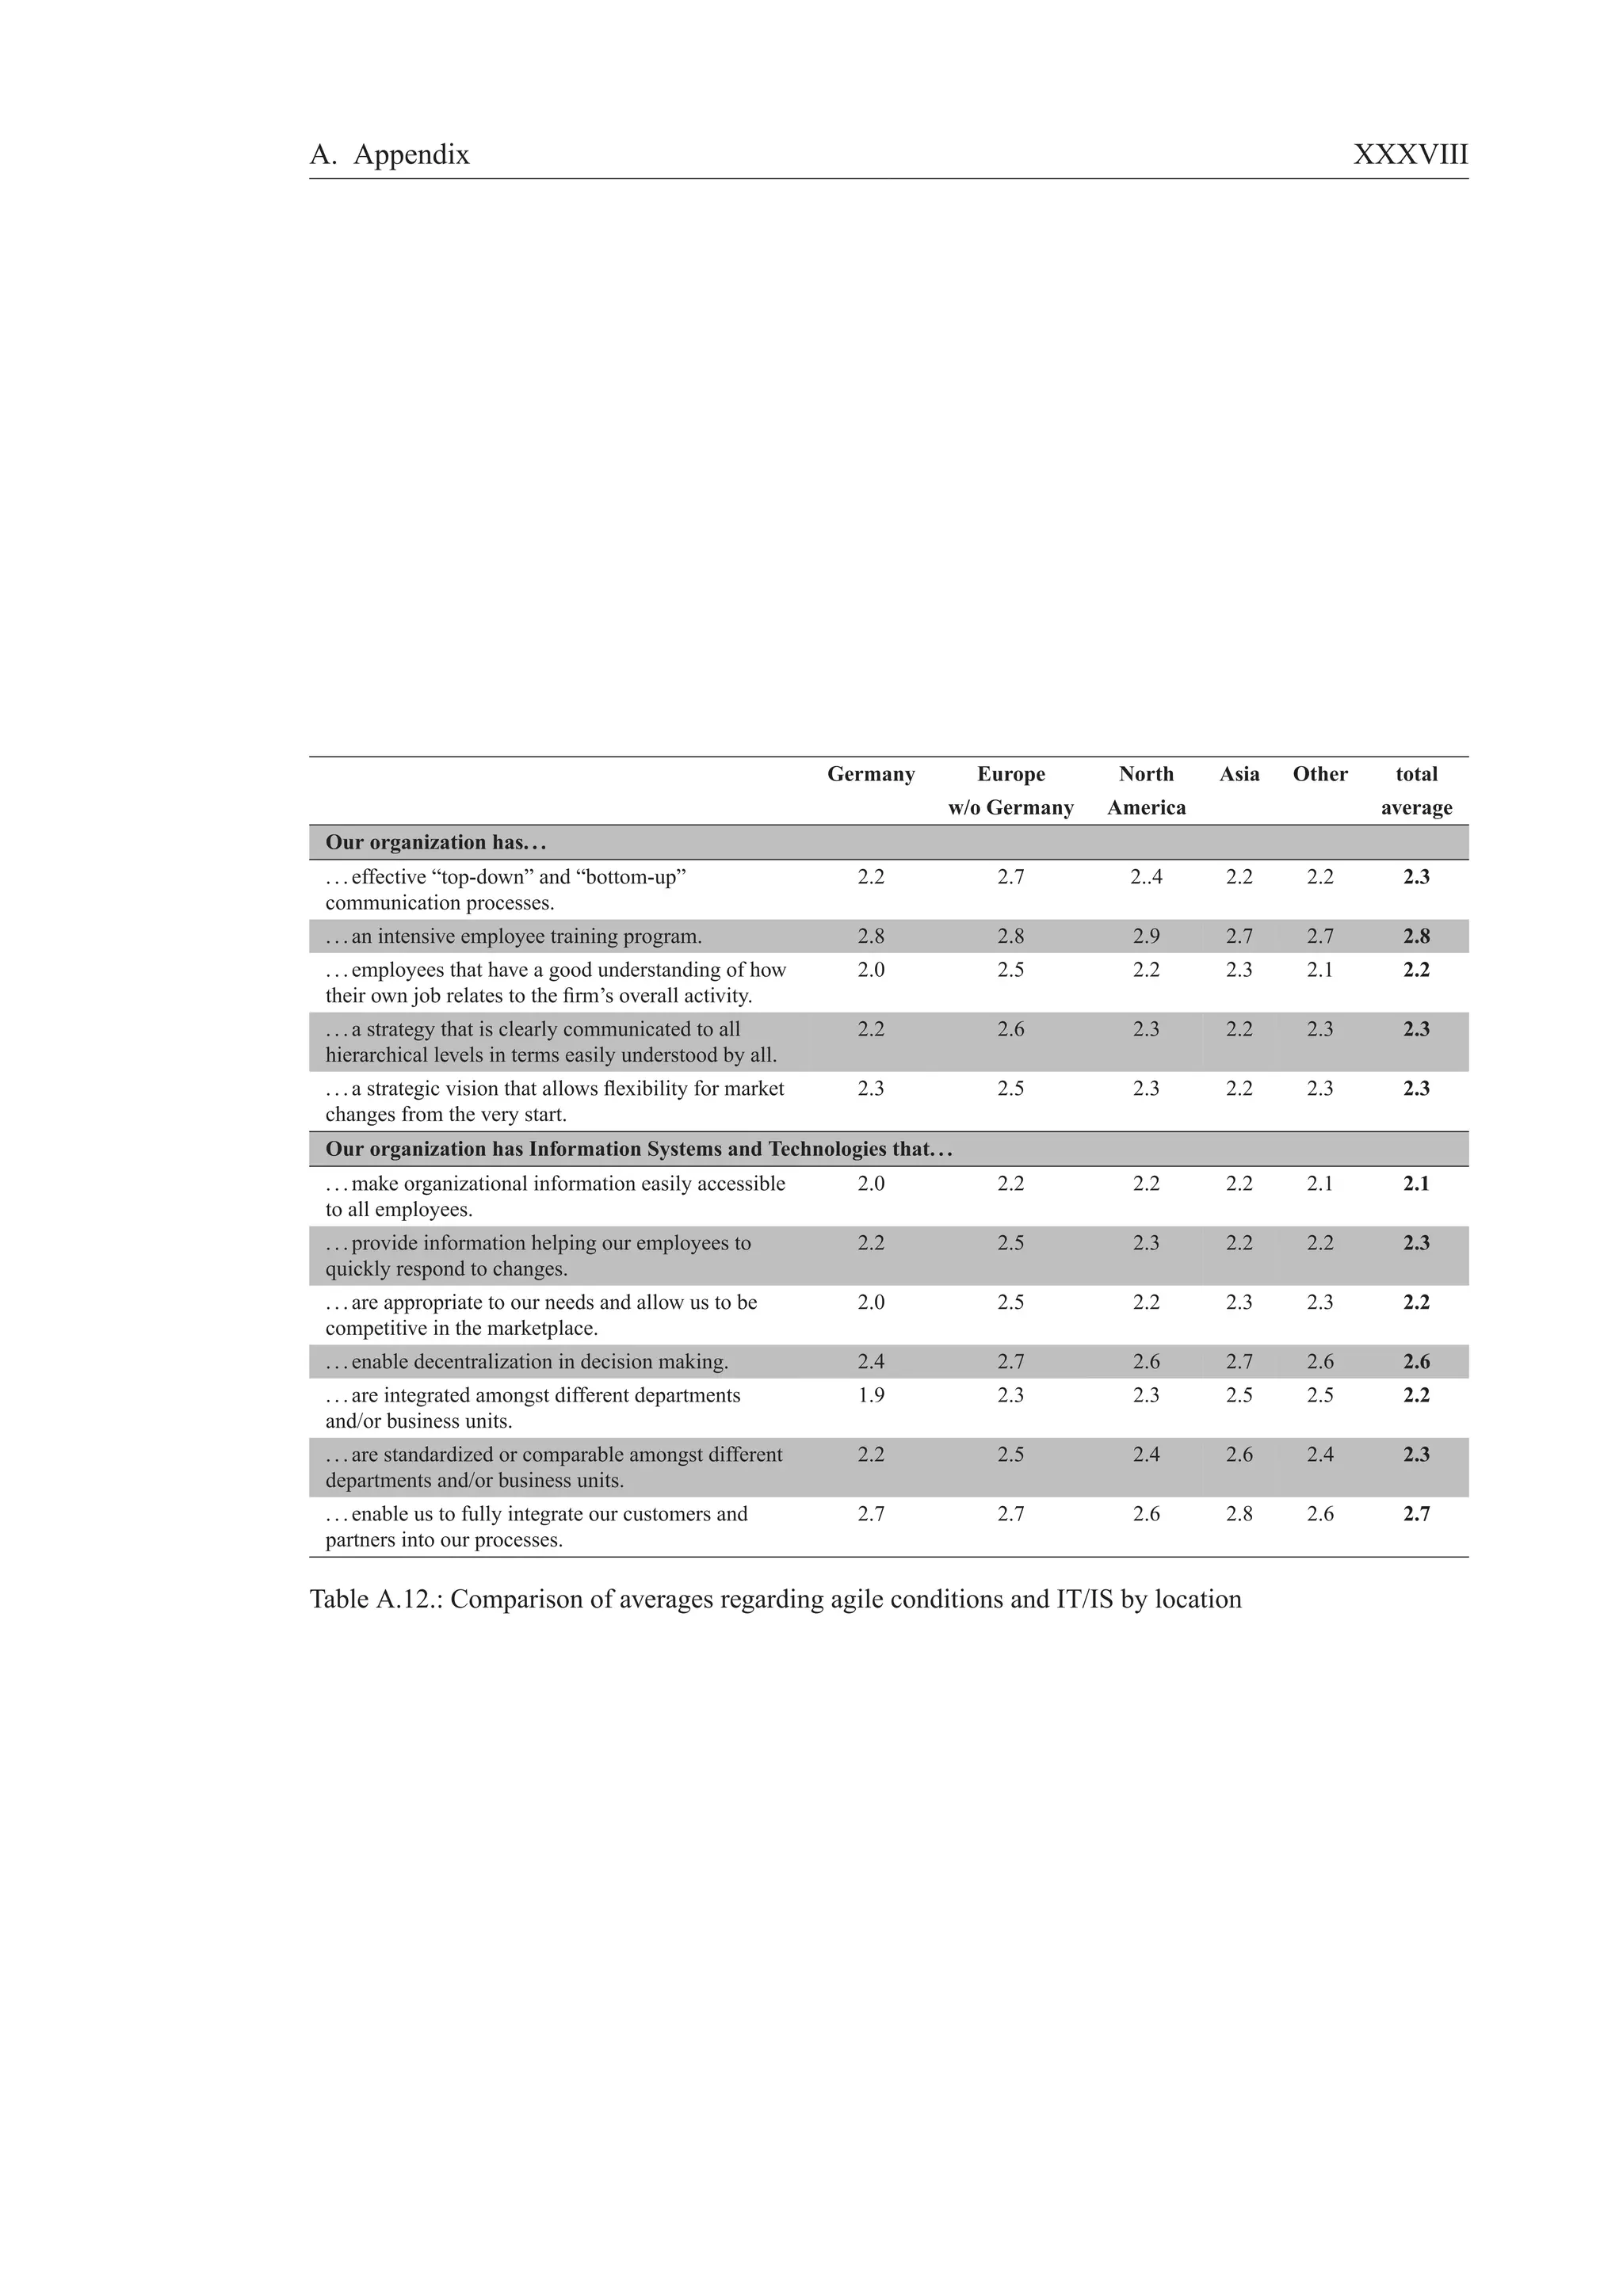
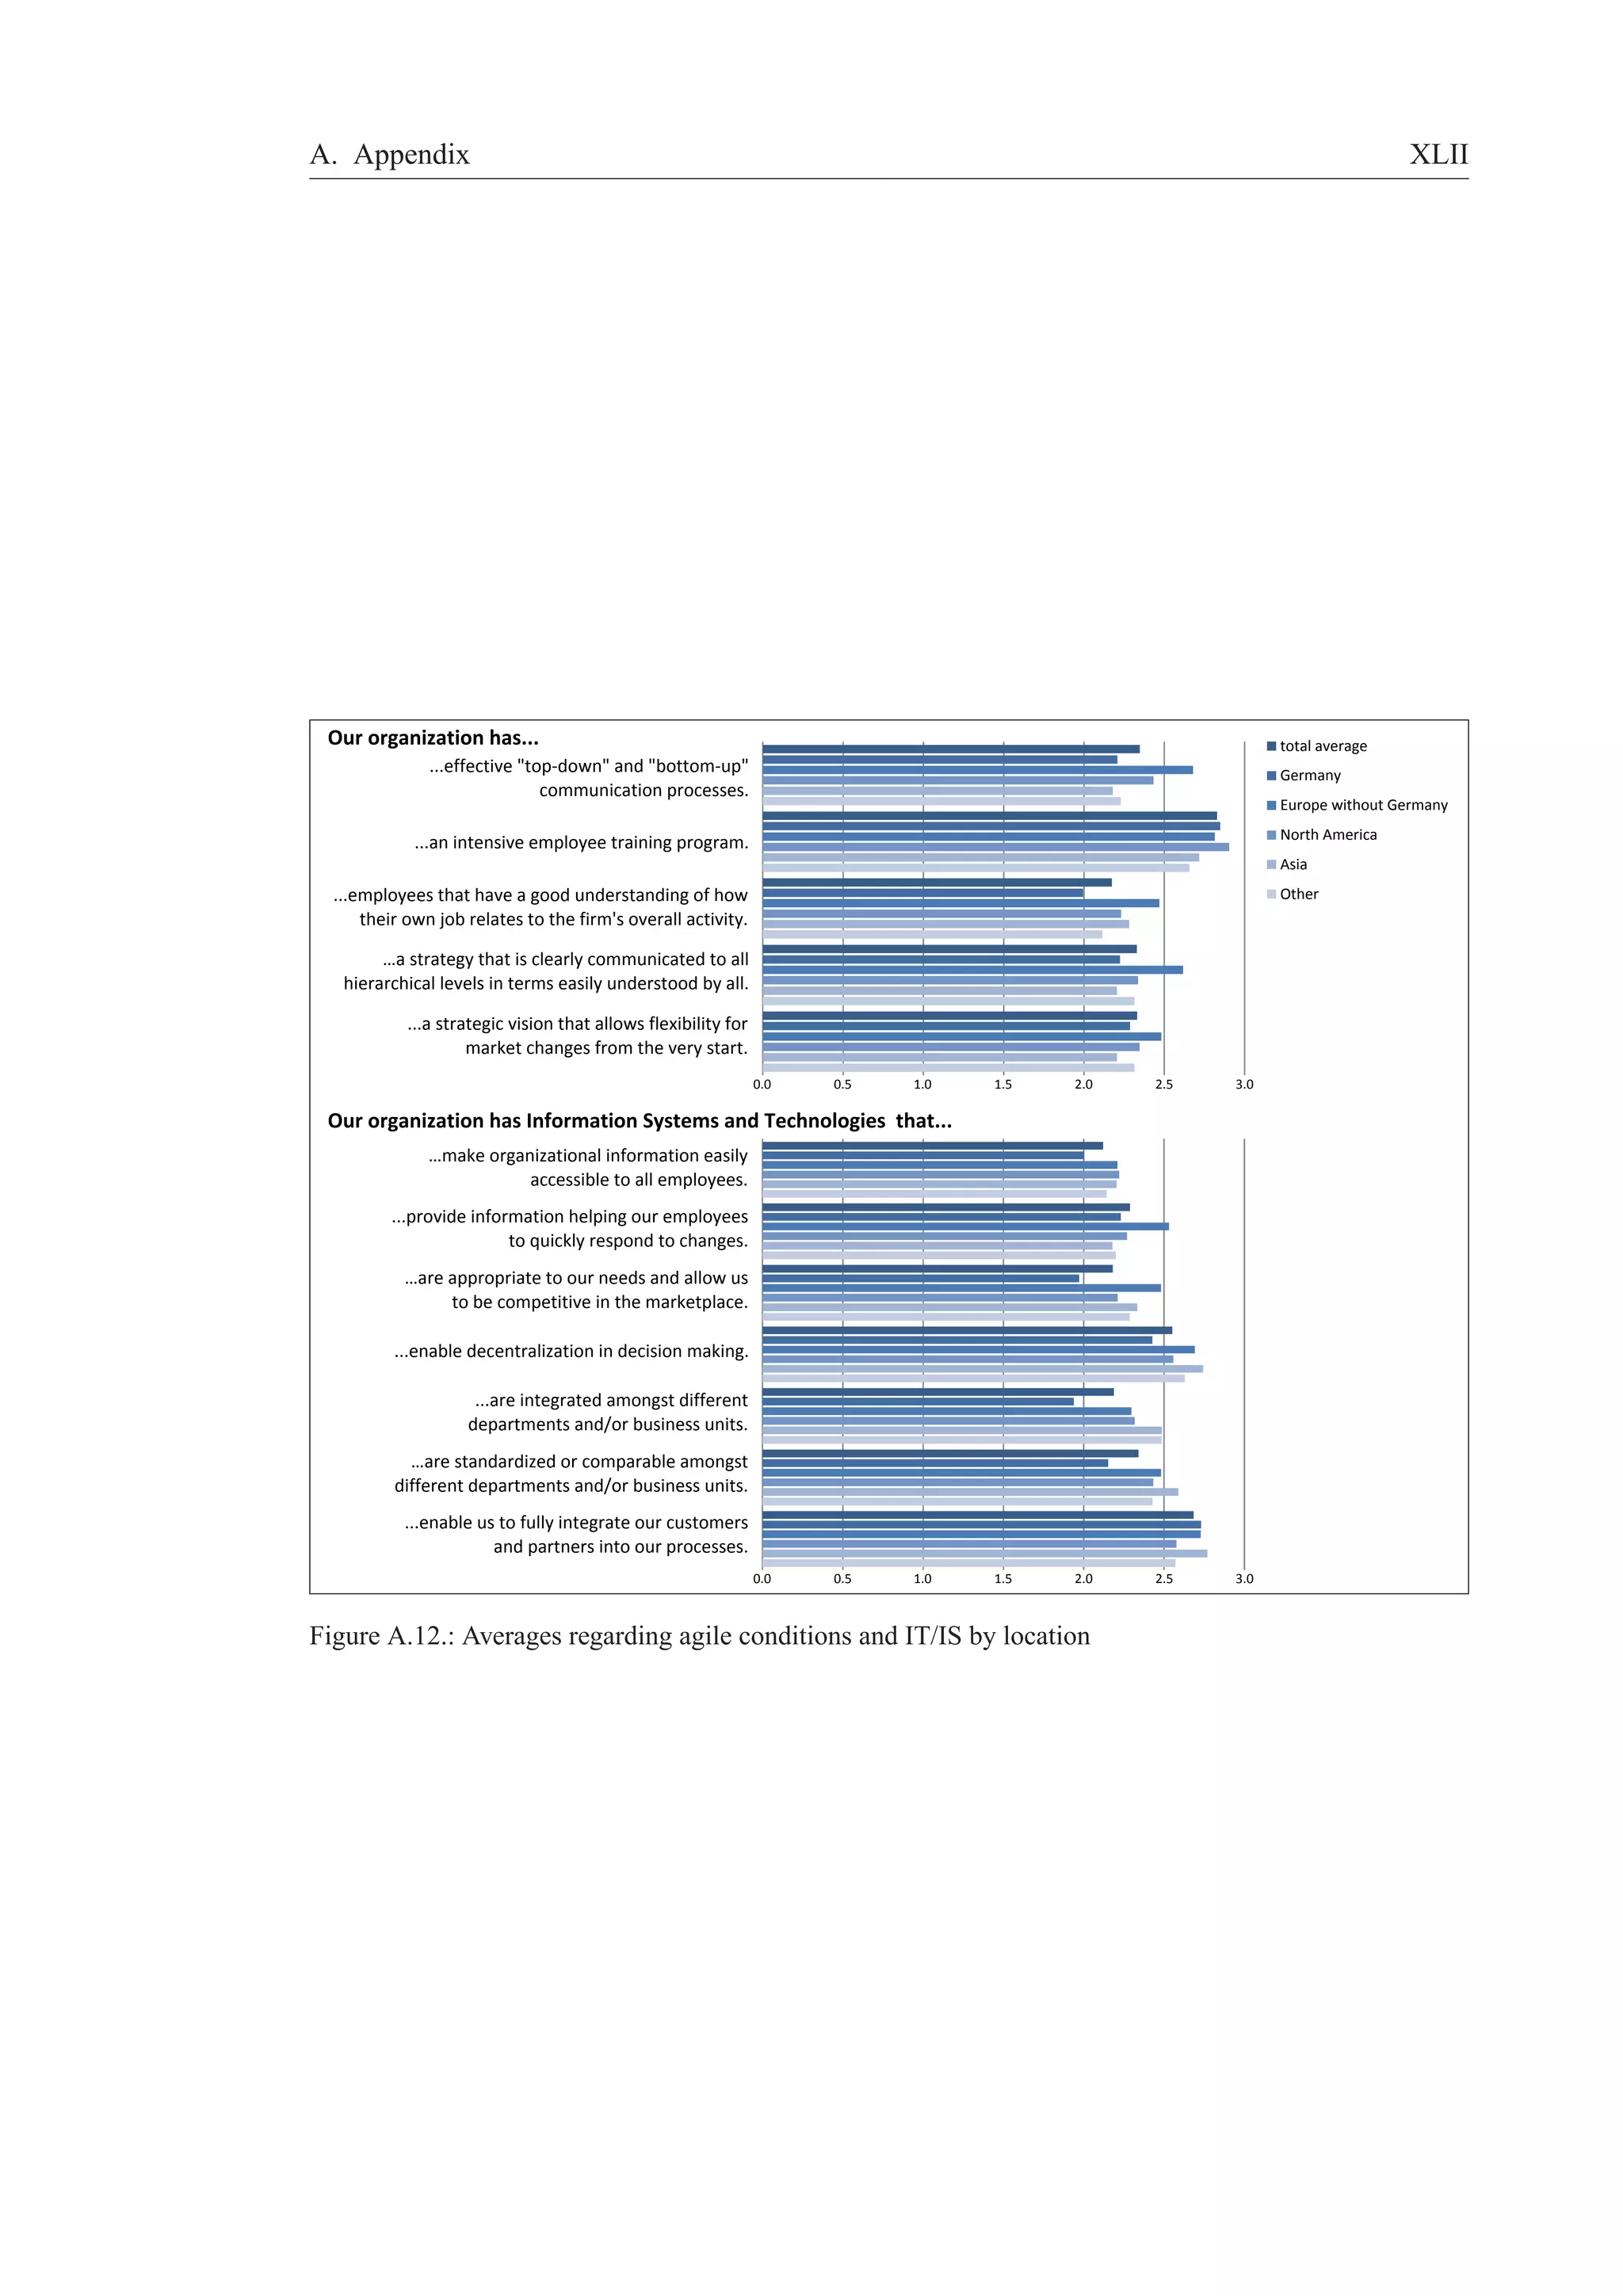
the proportion of people answering with little or not at all (approximately 8 to 15 %), are slightly higher
than the averages of agile values and principles (see section 3.1.1). That supports the assumption that it
takes some effort from valuing an agile culture to take the actions needed.
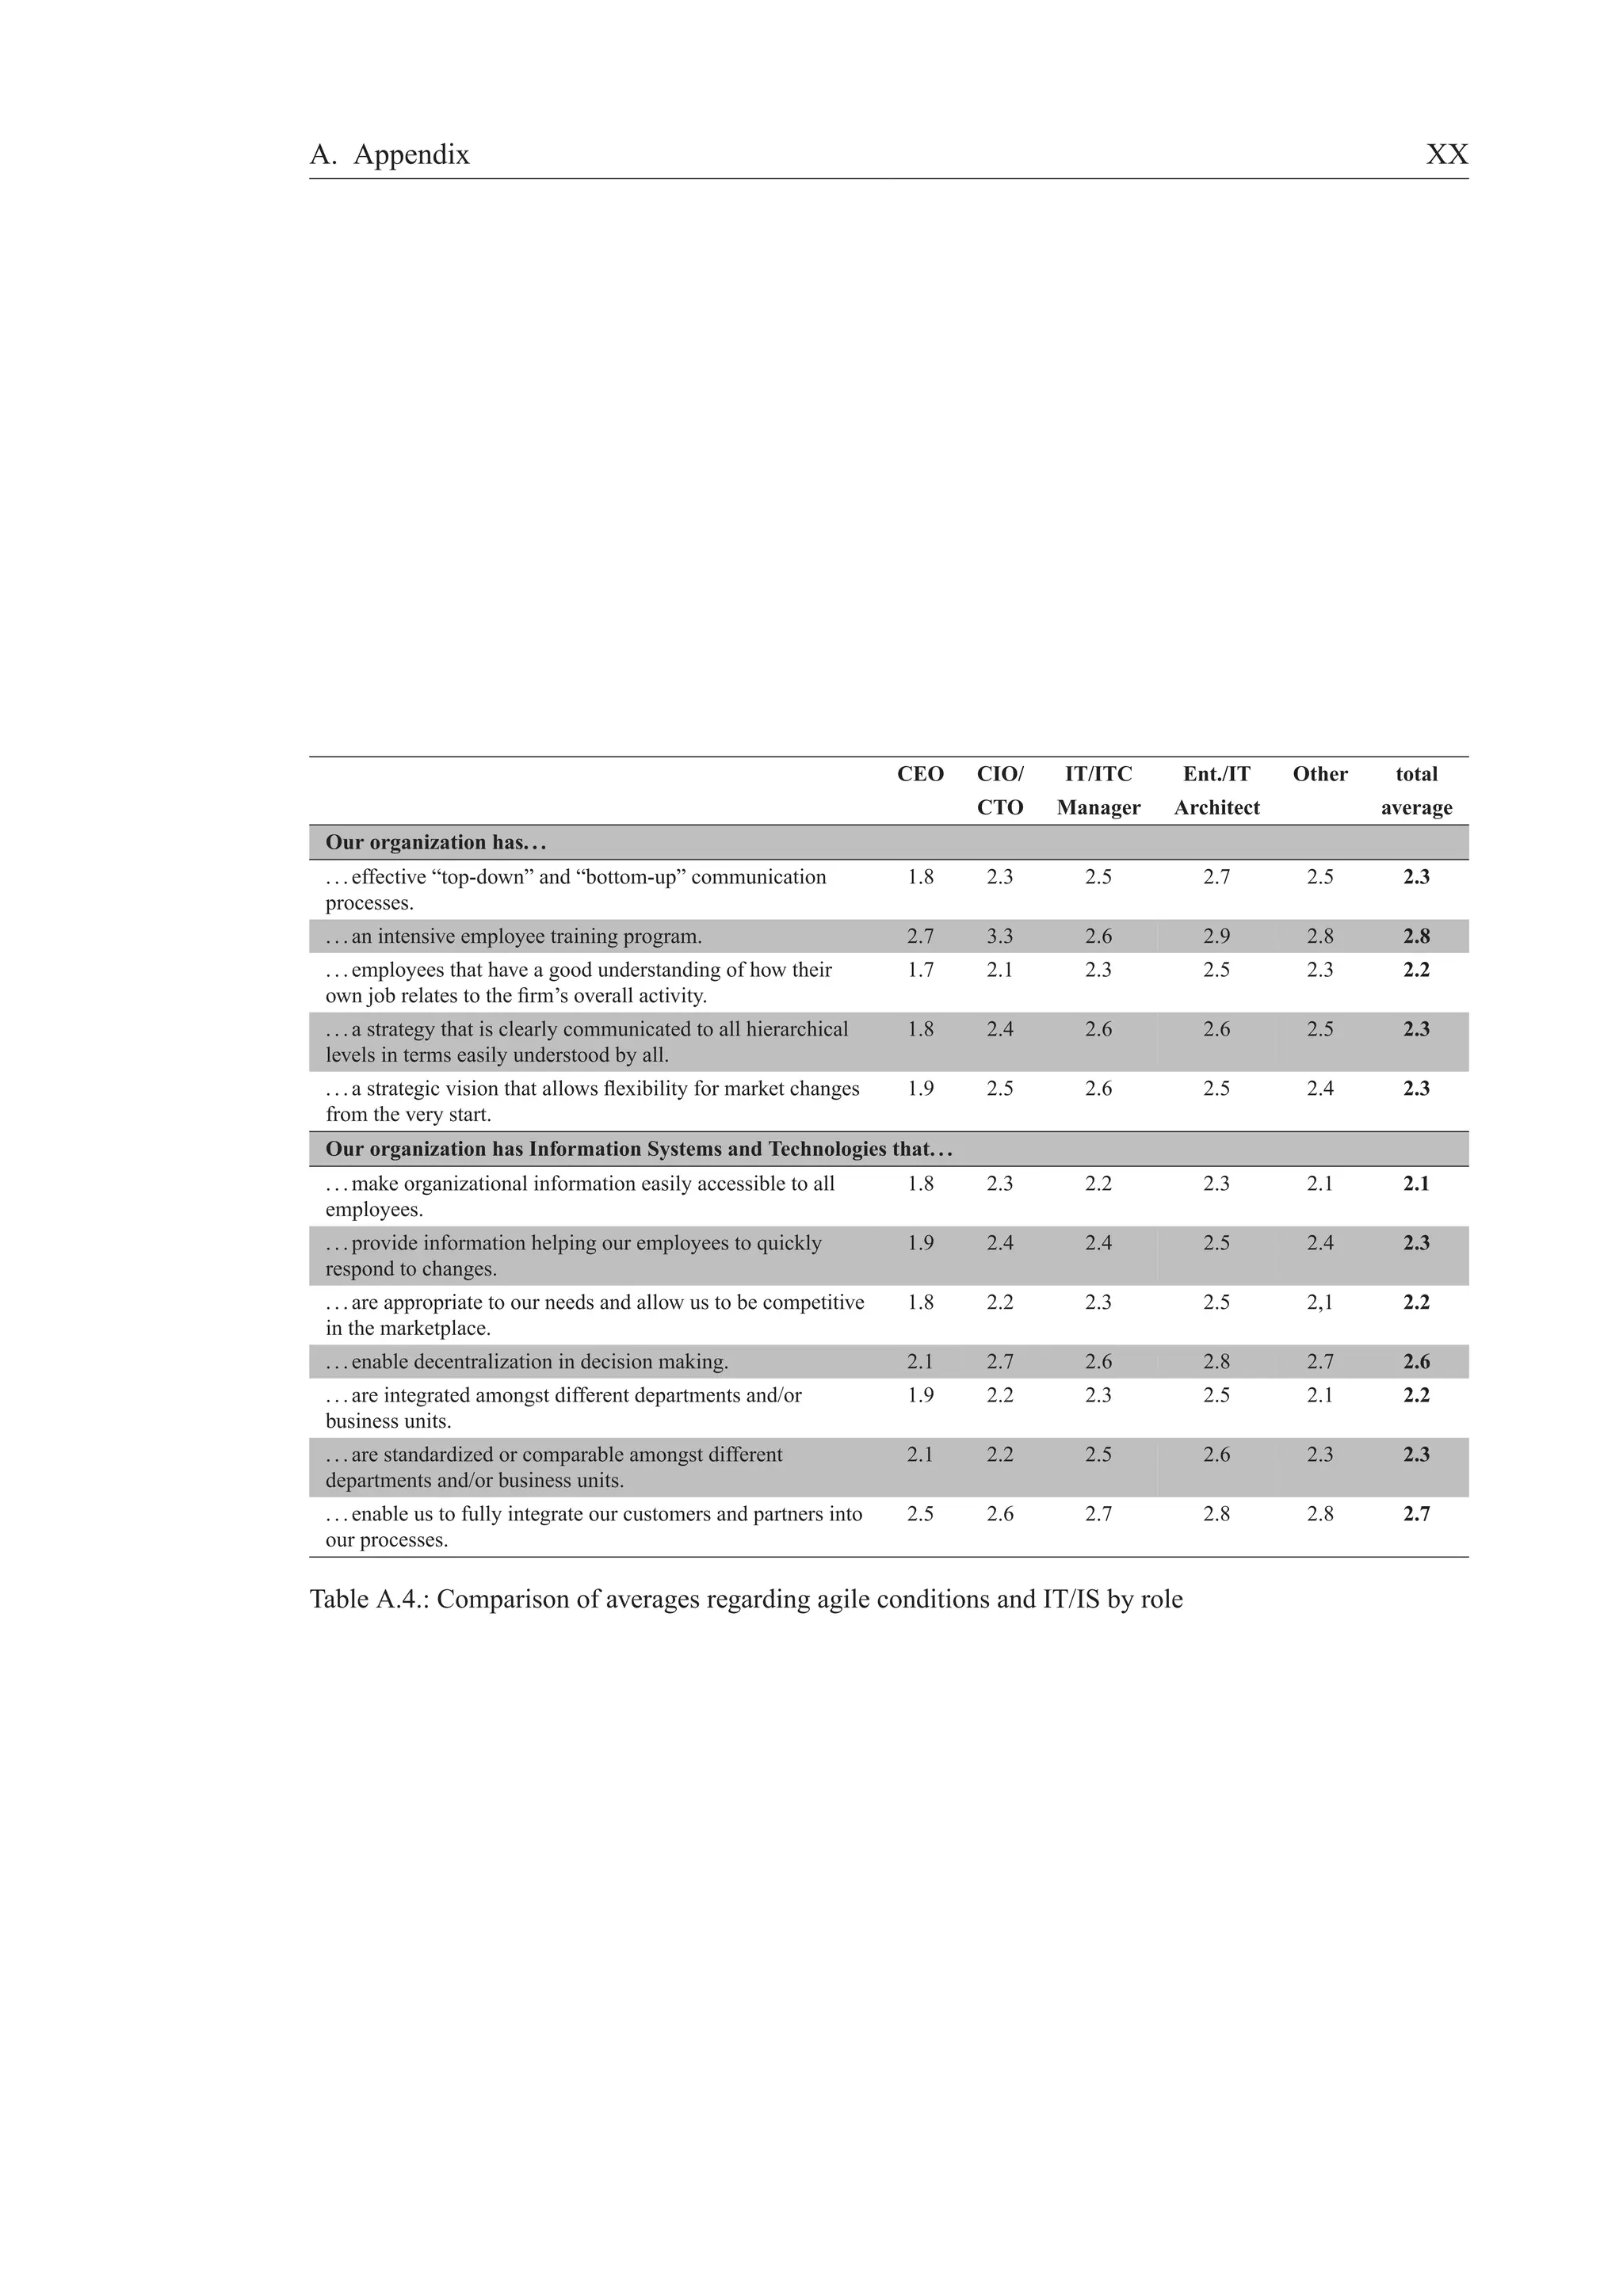
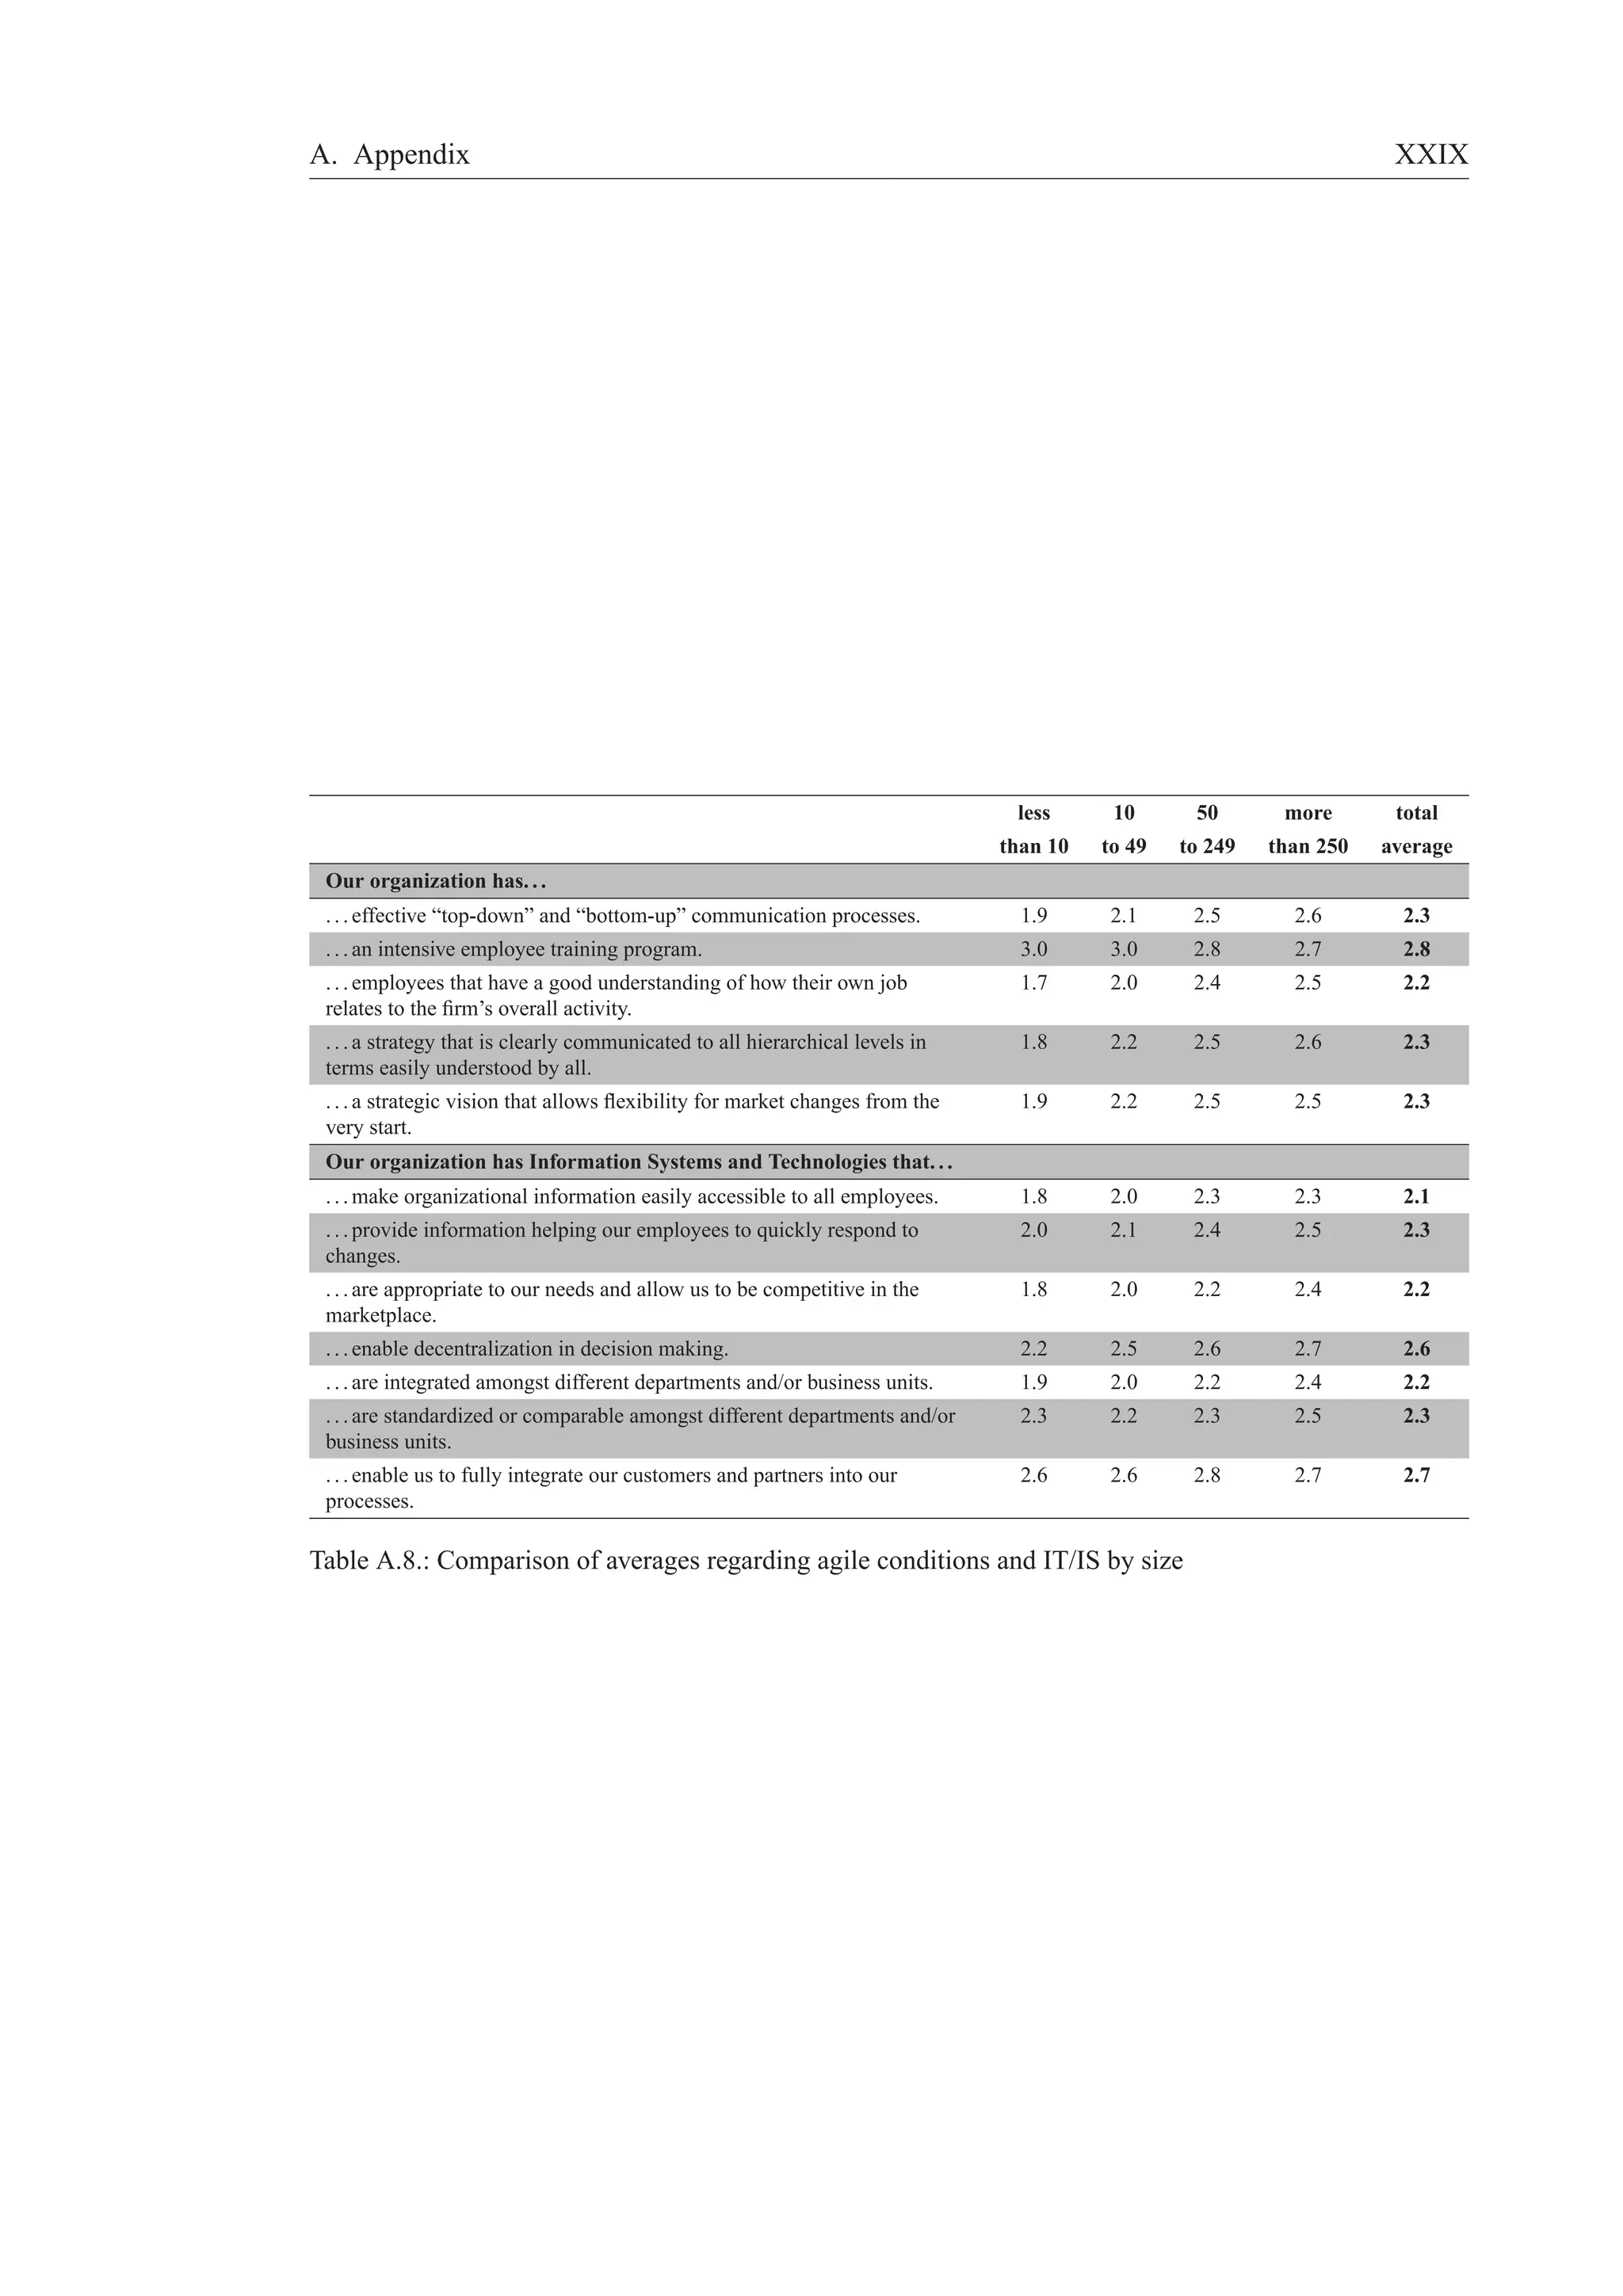
One result within the first set of items stands out. It is the item “Our organization has an intensive em-ployee
training program.” This item achieved only an average of 2.8 (partly) and shows a clearly different
distribution of answers. Only 42 % agree completely or mainly with this statement. However, continuous
and purposeful training of employees is one essential component to creating an agile workforce and, as
Sherehiy et al. state, “represents an investment into future success” (p. 448).
Additionally, two other items only reach an average score that lies within the scope of partly. These are
both IS-related aspects that “. . . enable decentralization in decision making” and “. . . enable [the organiza-tions]
to fully integrate [their] customers and partners into [their] processes.” Both are tasks that are not
easily fulfilled, so it is surprising that even approximately 19 % and 16 %, respectively, claim that their
organization fulfills these requirements completely.
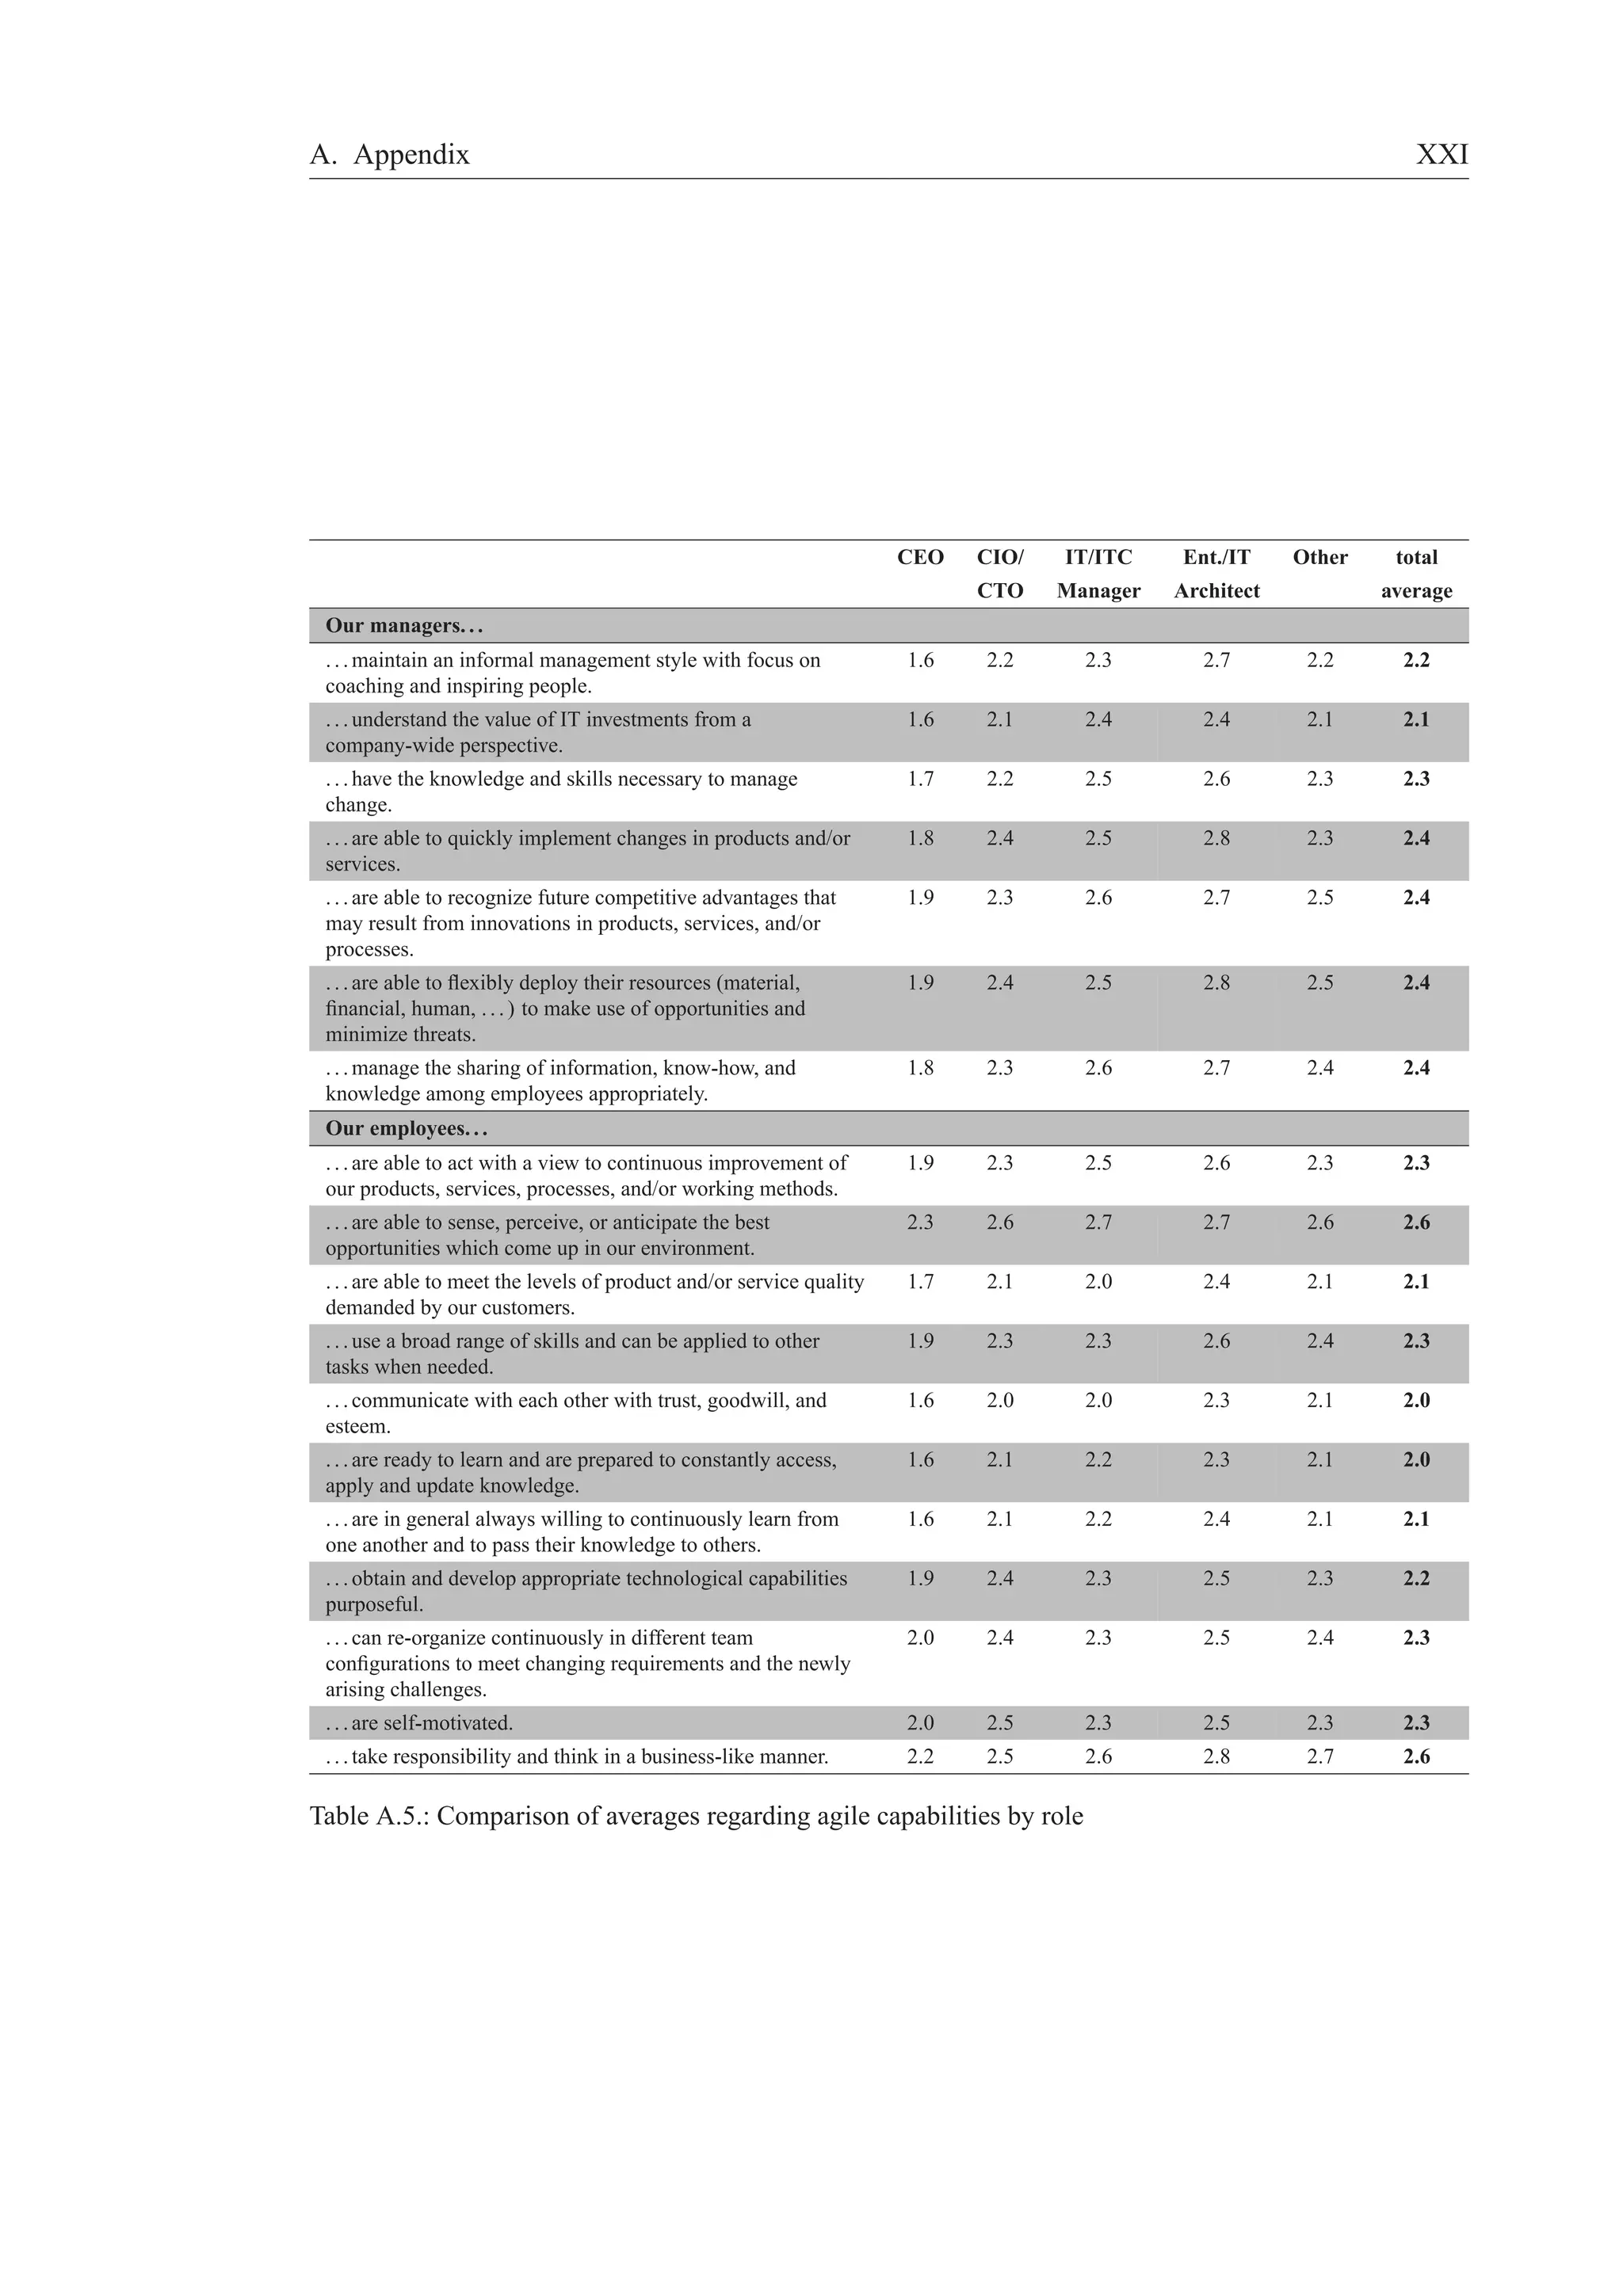
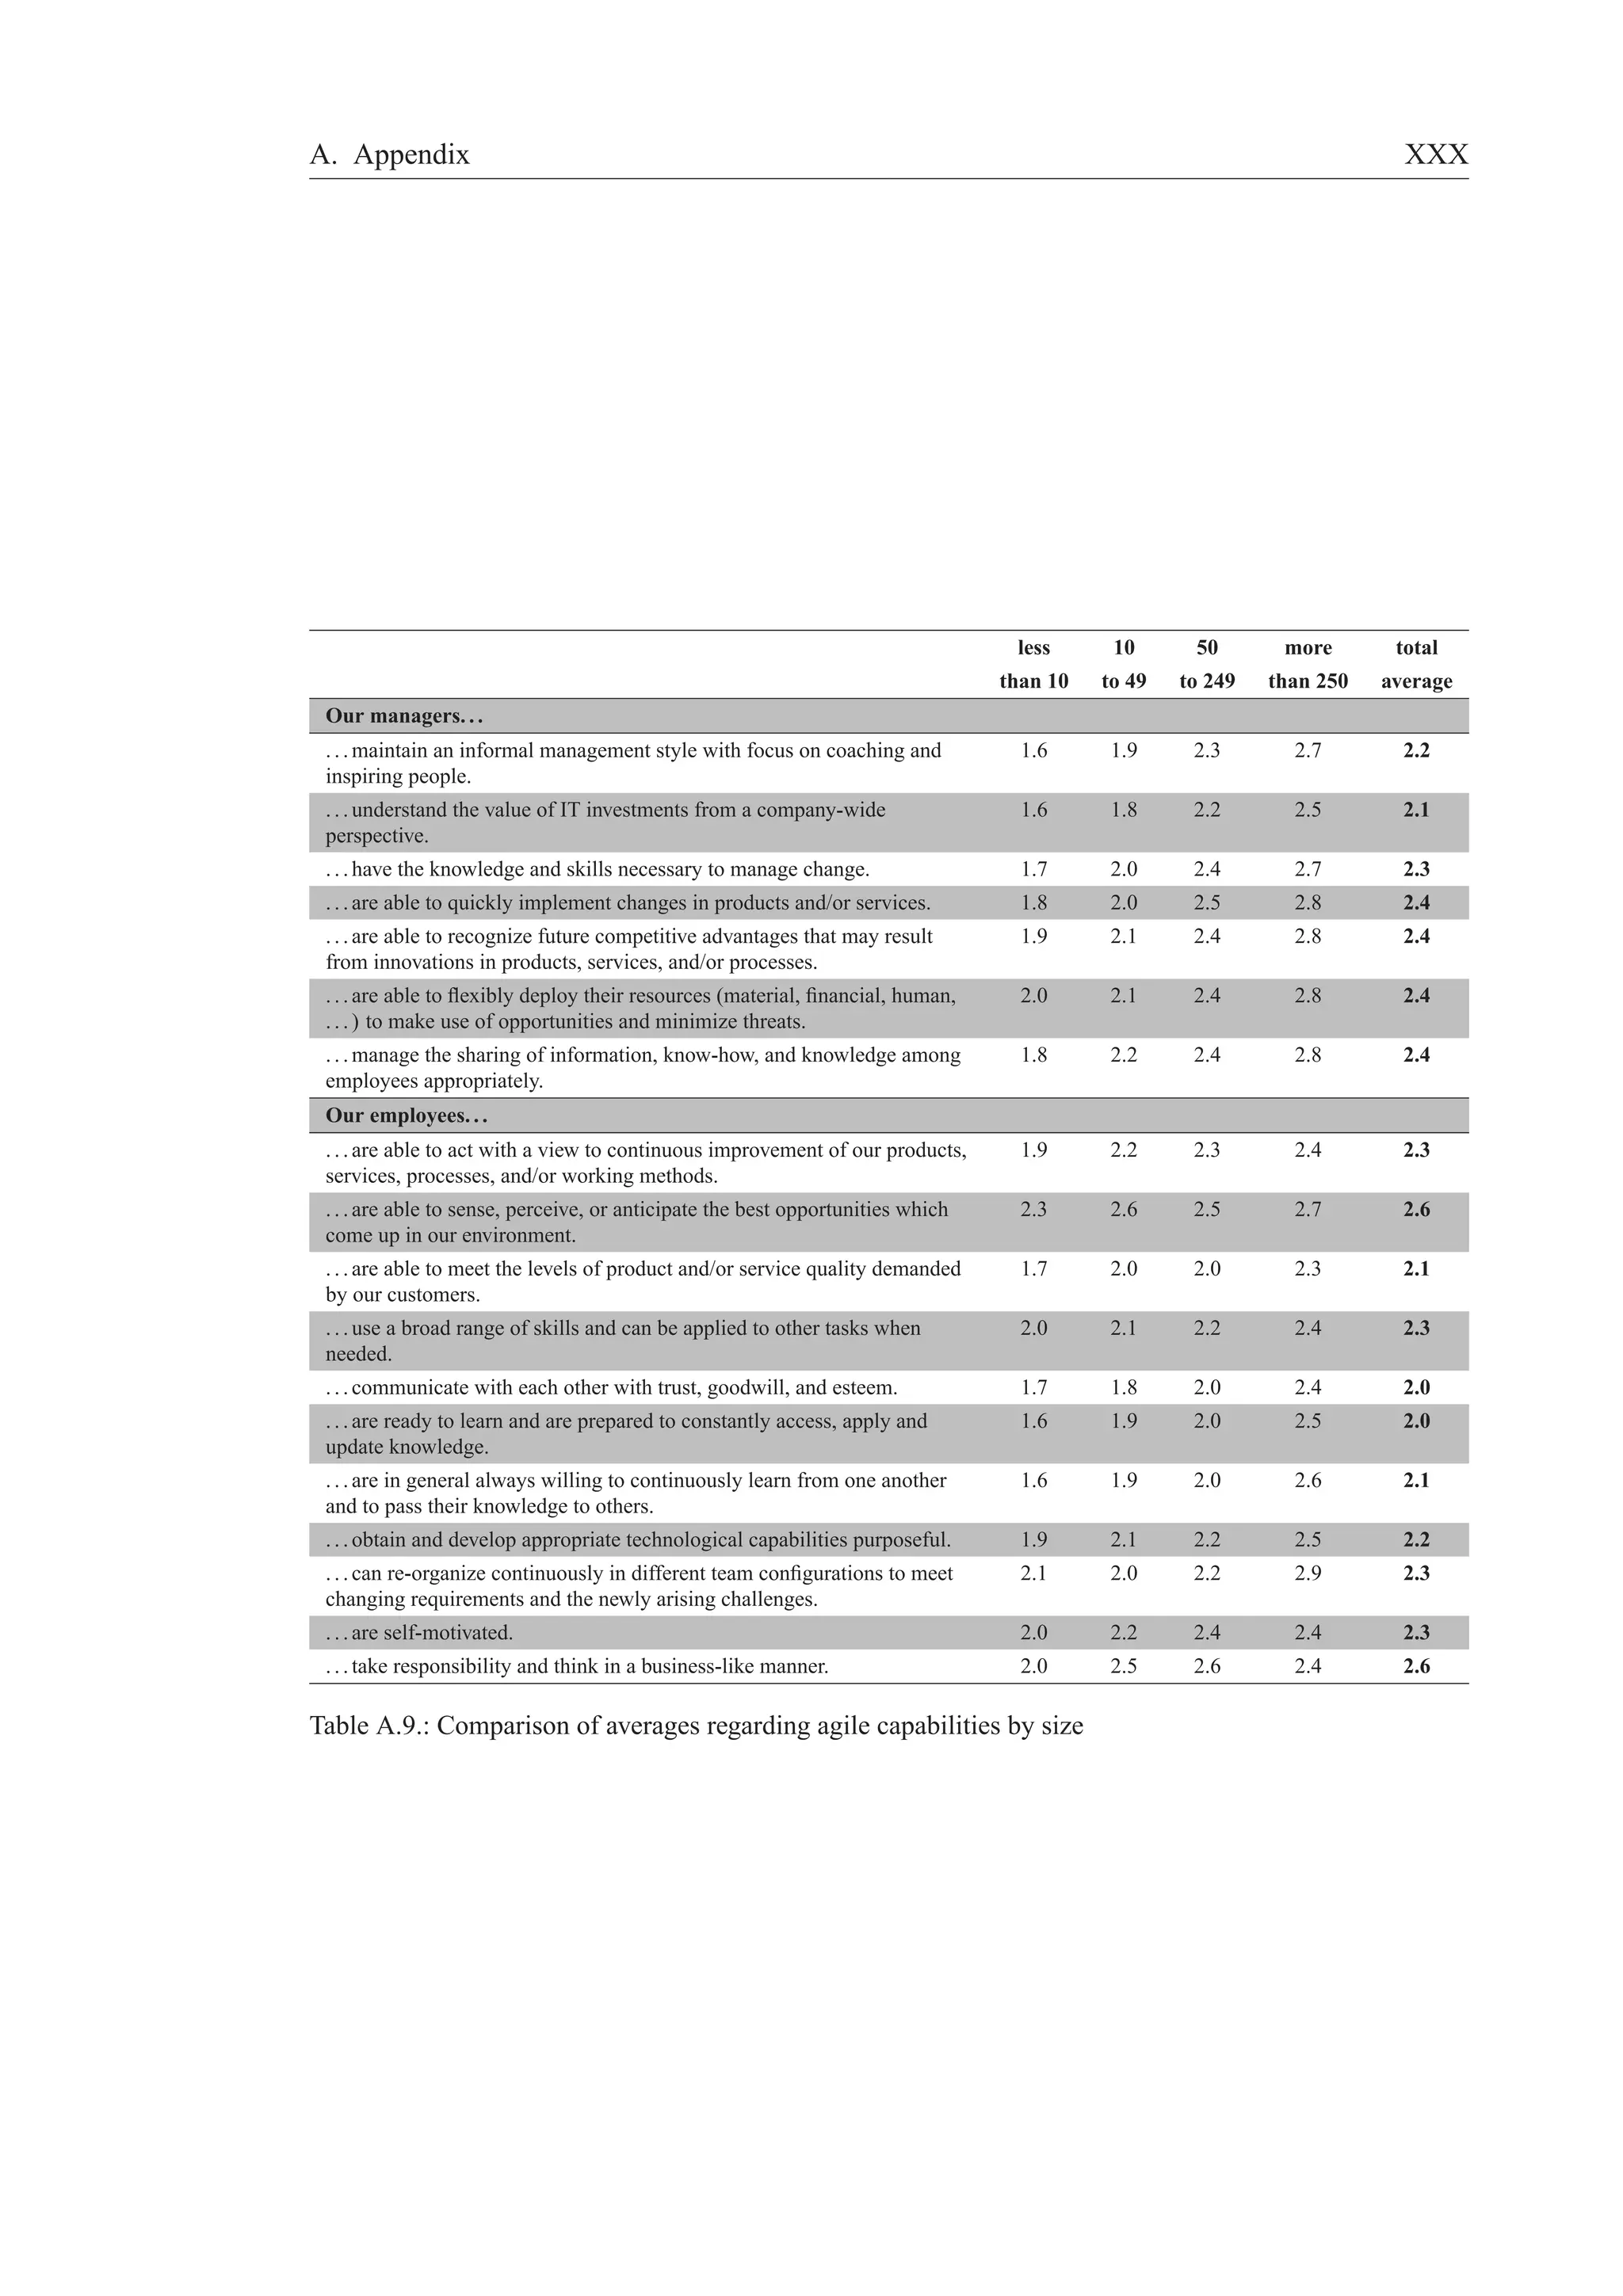
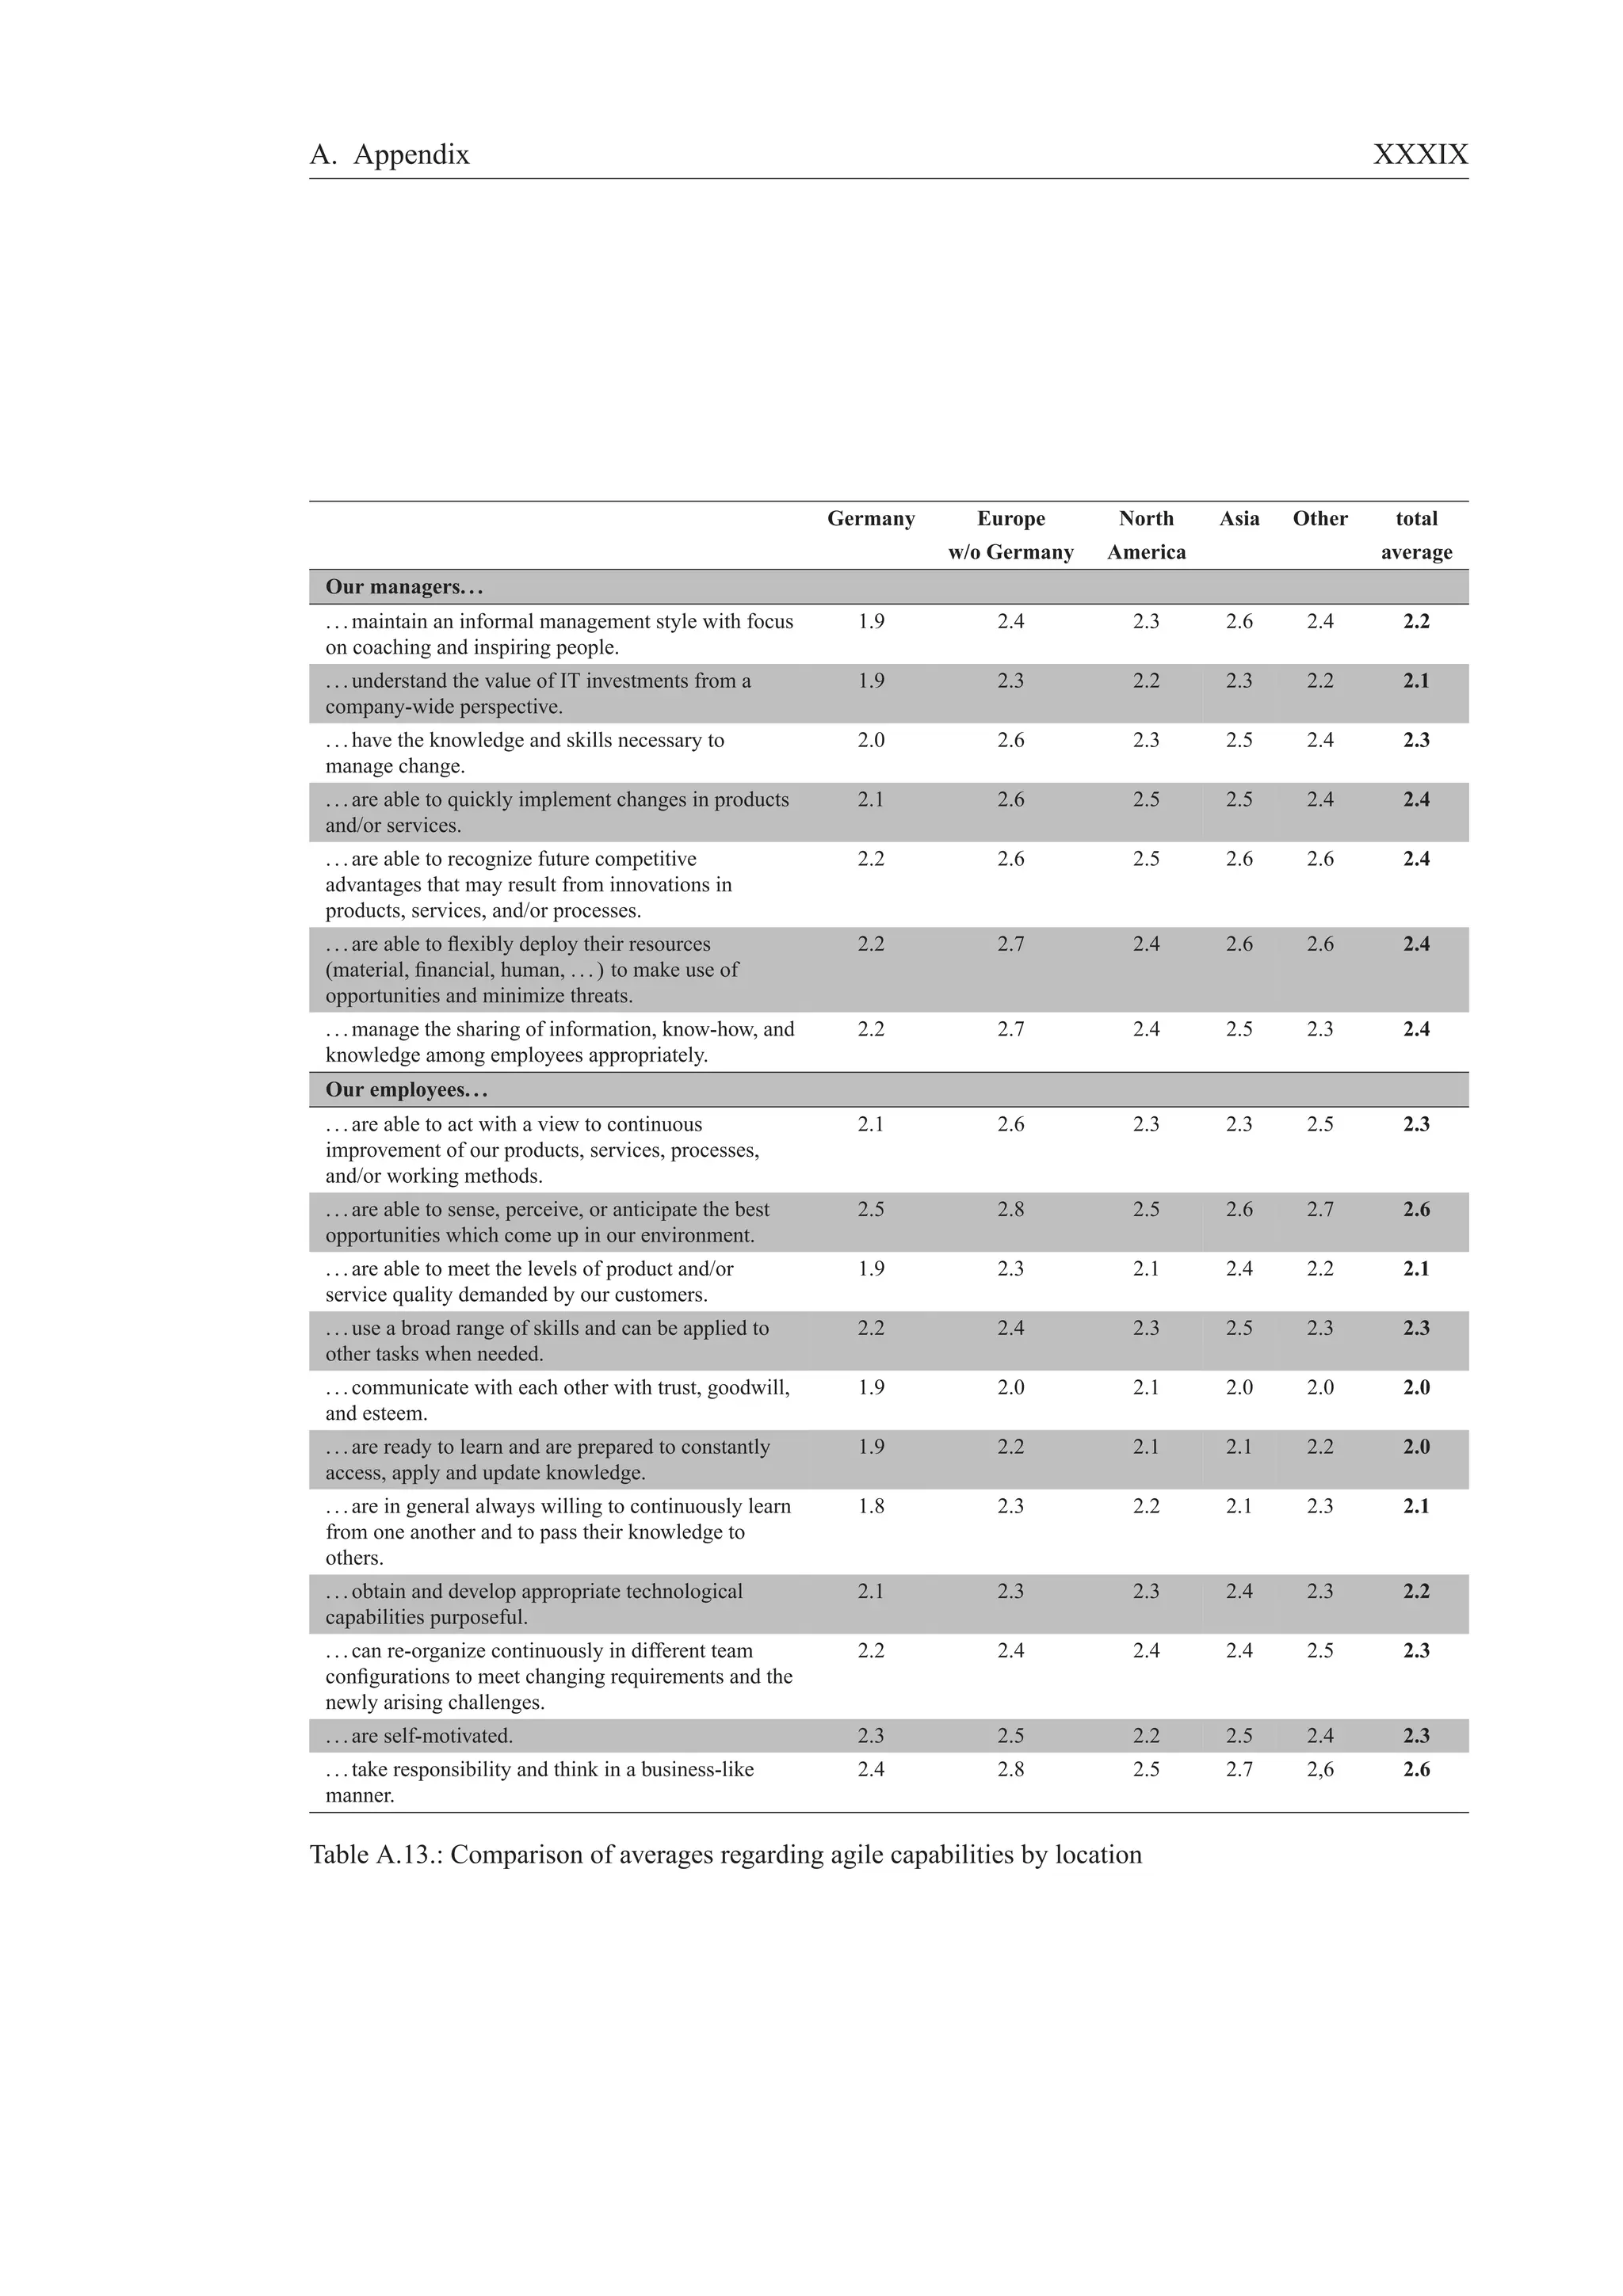
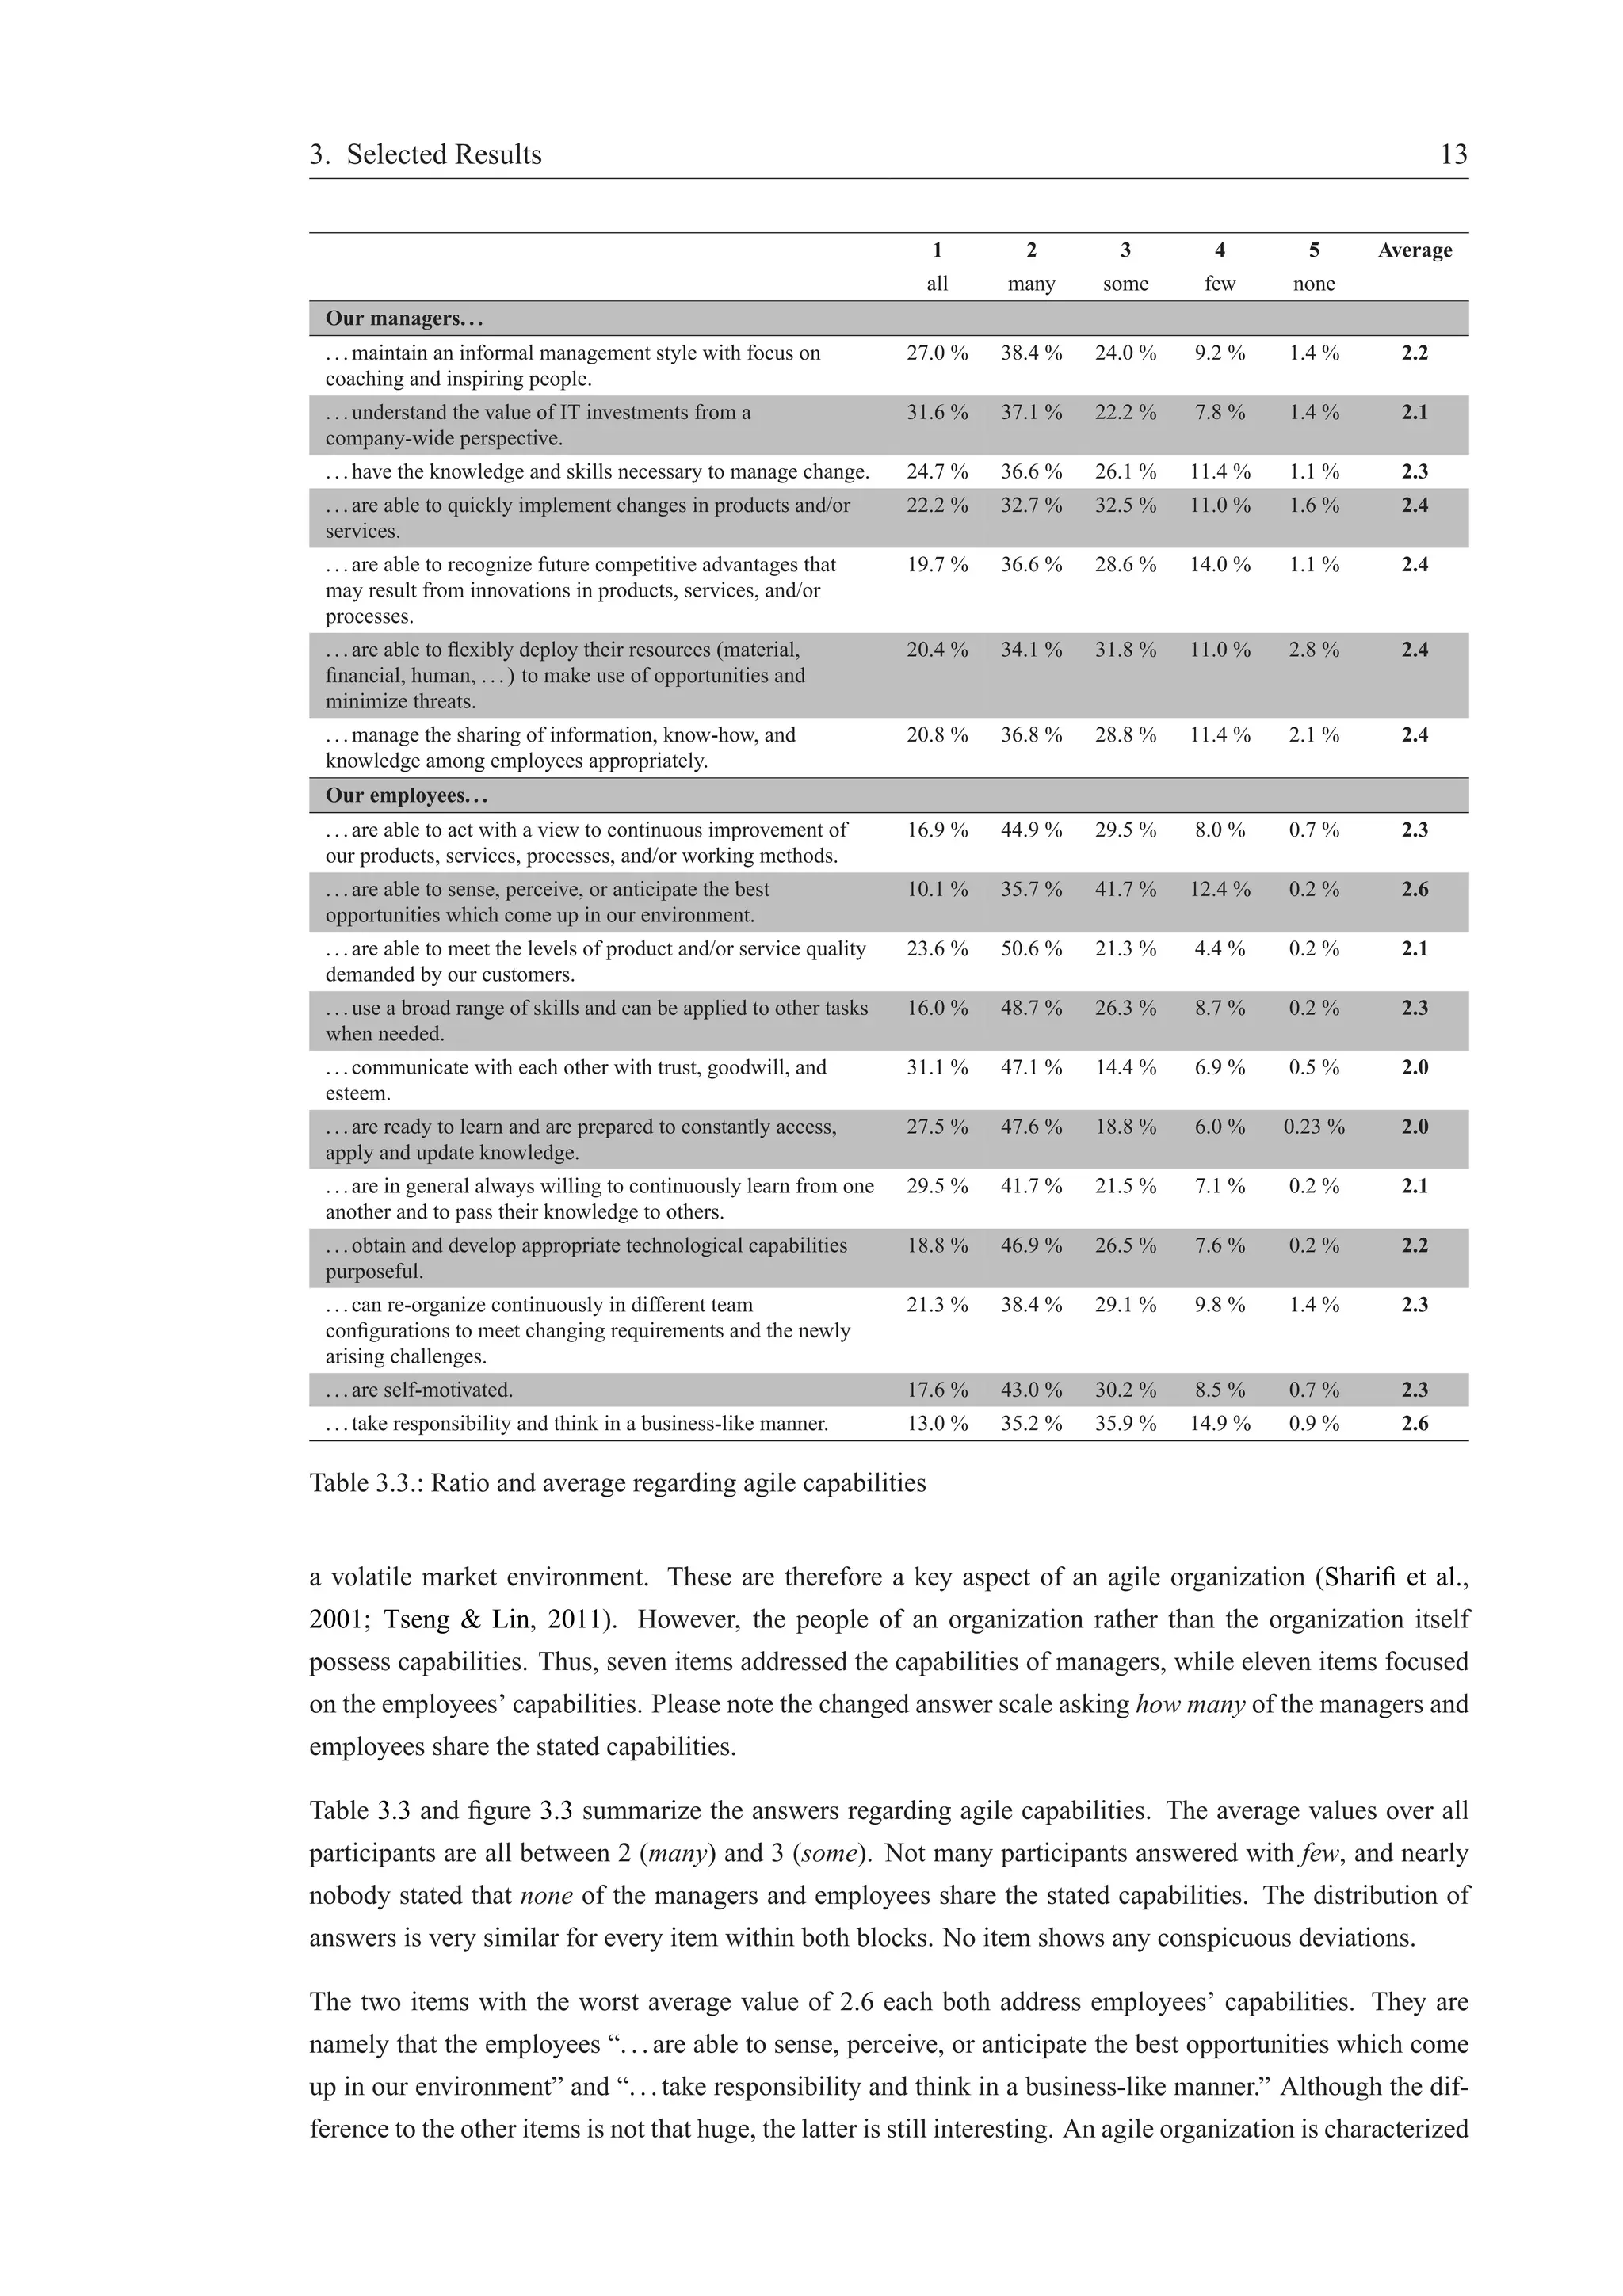
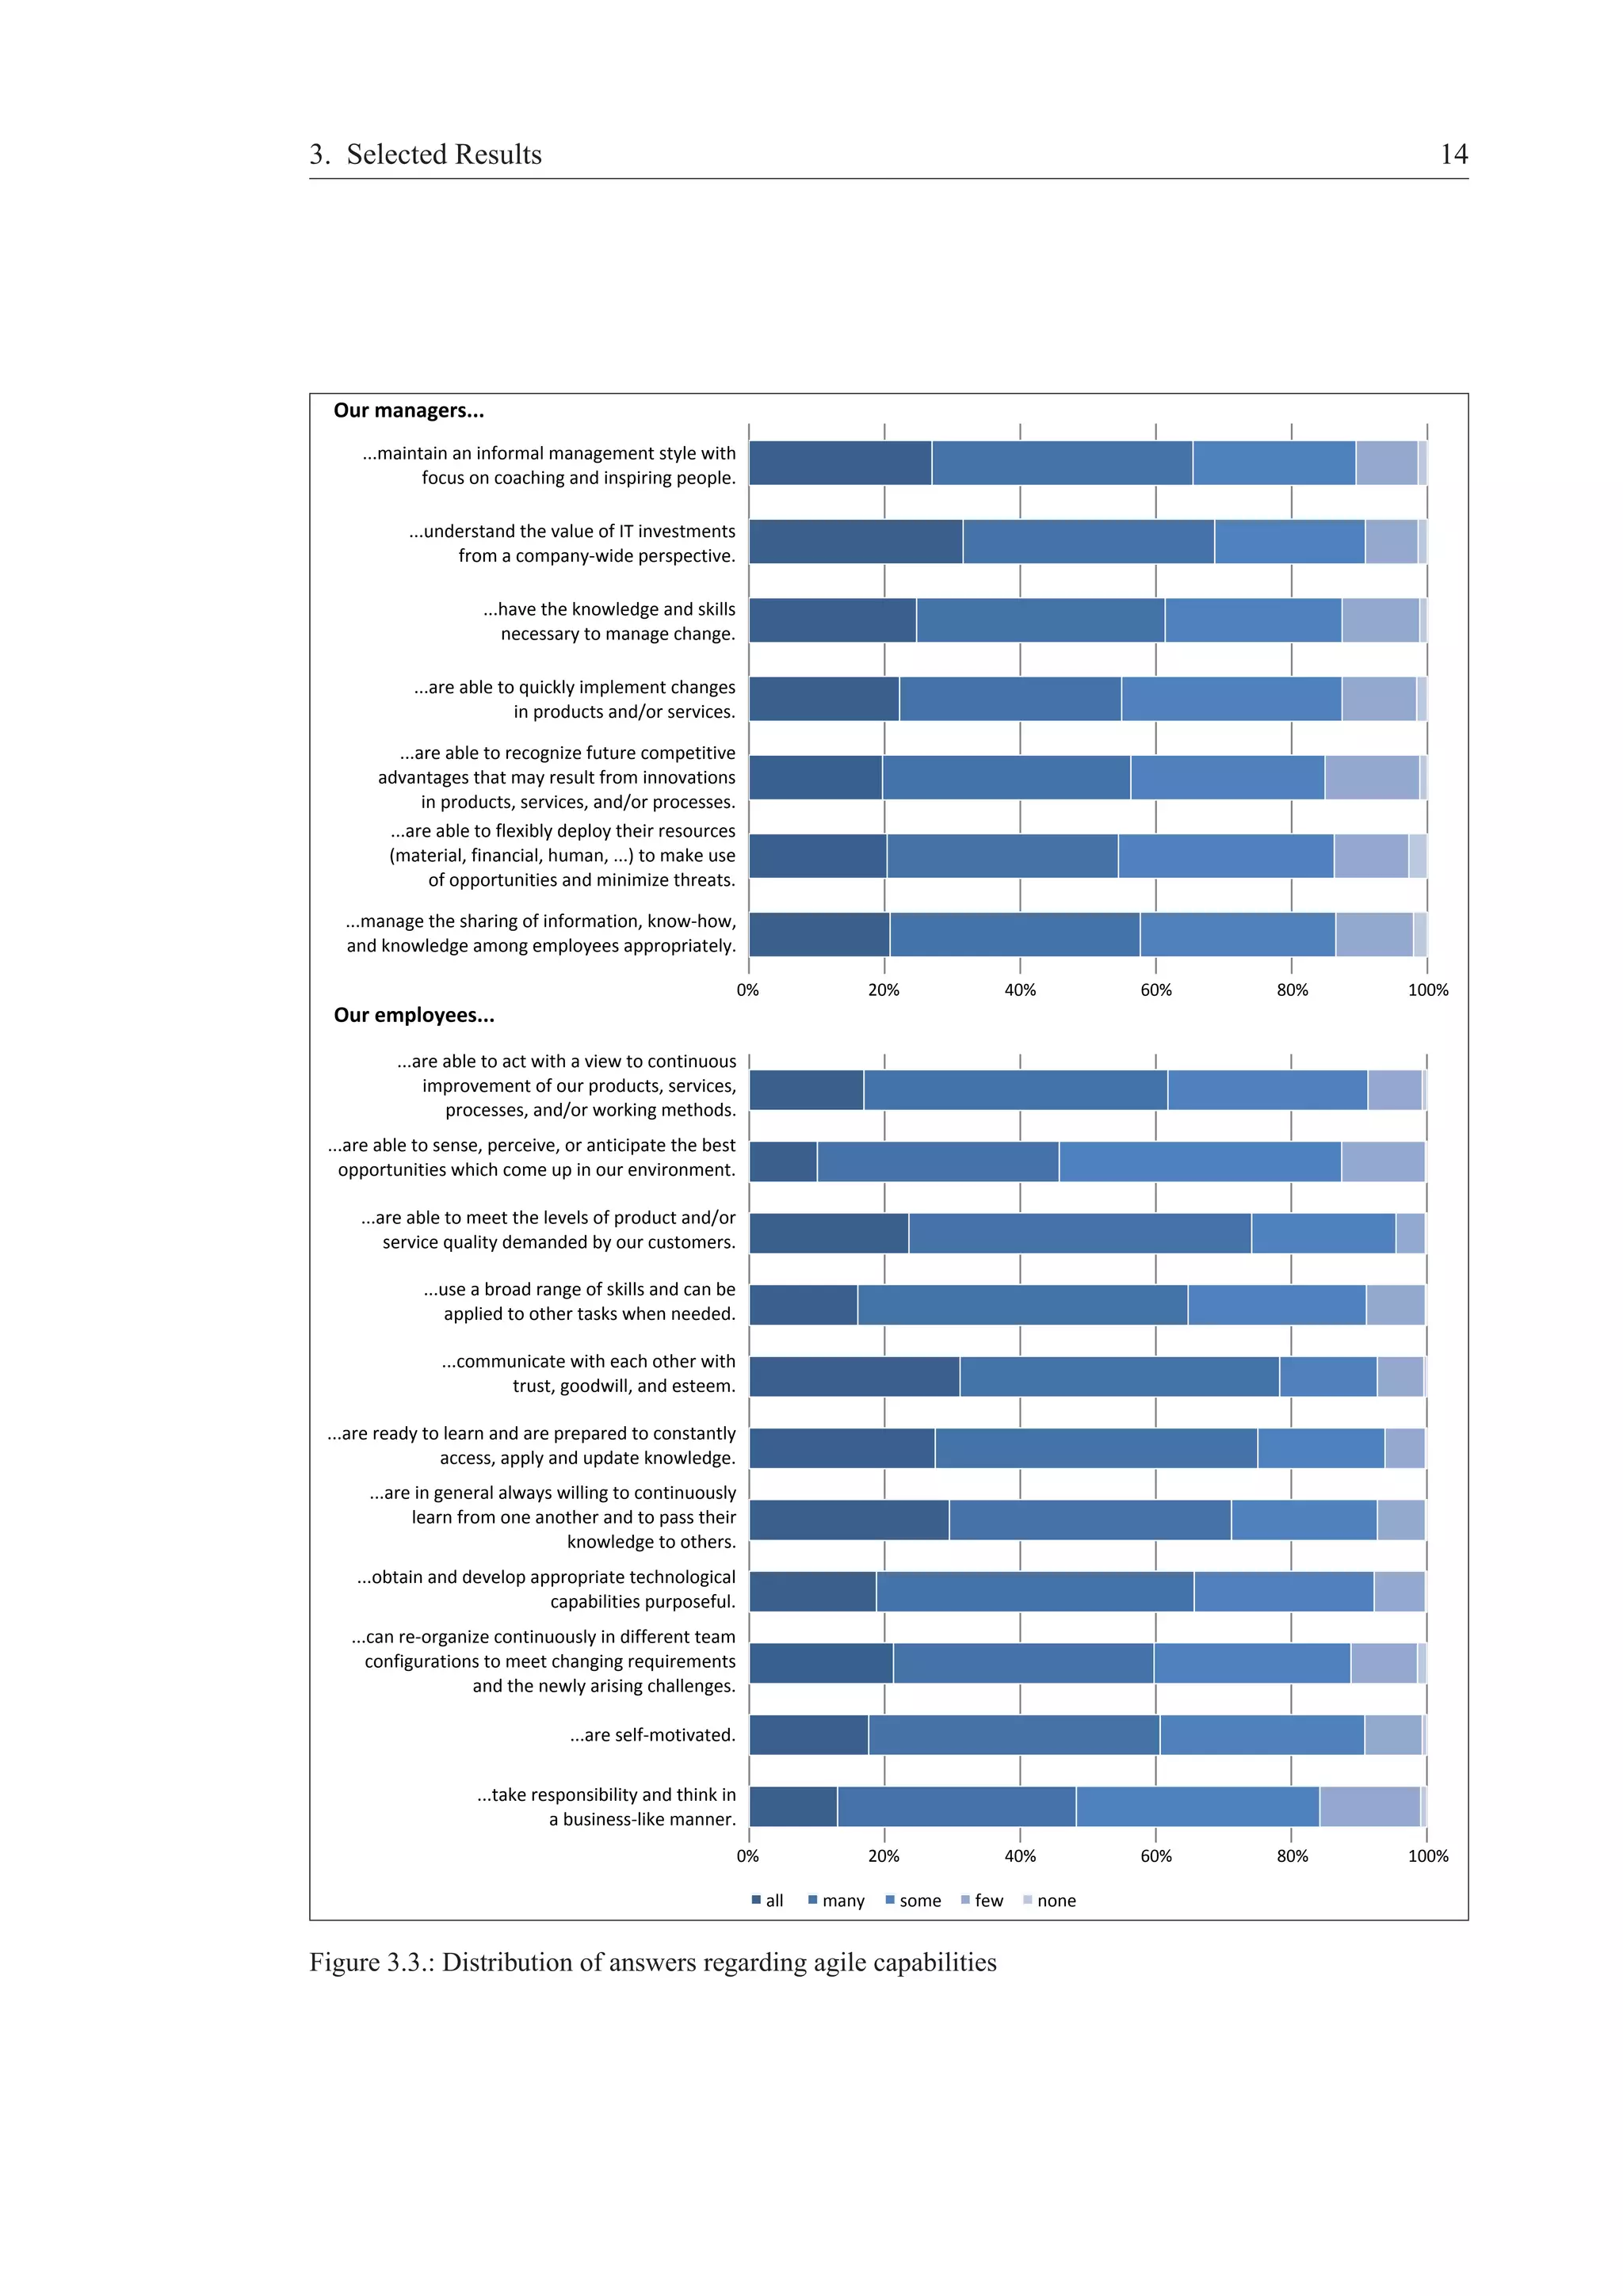
3.1.3. Agile Capabilities
The well-known “Lehigh-Report” from 1991 has already stated that “agility is accomplished by integrating
three resources: technology, management, workforce” (Iacocca Institute, 1991, p. 8). Hence, the third part
of the questionnaire focused on the capabilities that are needed within an agile organization. Capabilities
enhancing agility enable an organization to cope with uncertainty and change and to stay competitive in](https://image.slidesharecdn.com/gelbe-reiheagility-survey-140826135420-phpapp02/75/WHAT-CONSTITUTES-AN-AGILE-ORGANIZATION-DESCRIPTIVE-RESULTS-OF-AN-EMPIRICAL-INVESTIGATION-19-2048.jpg)
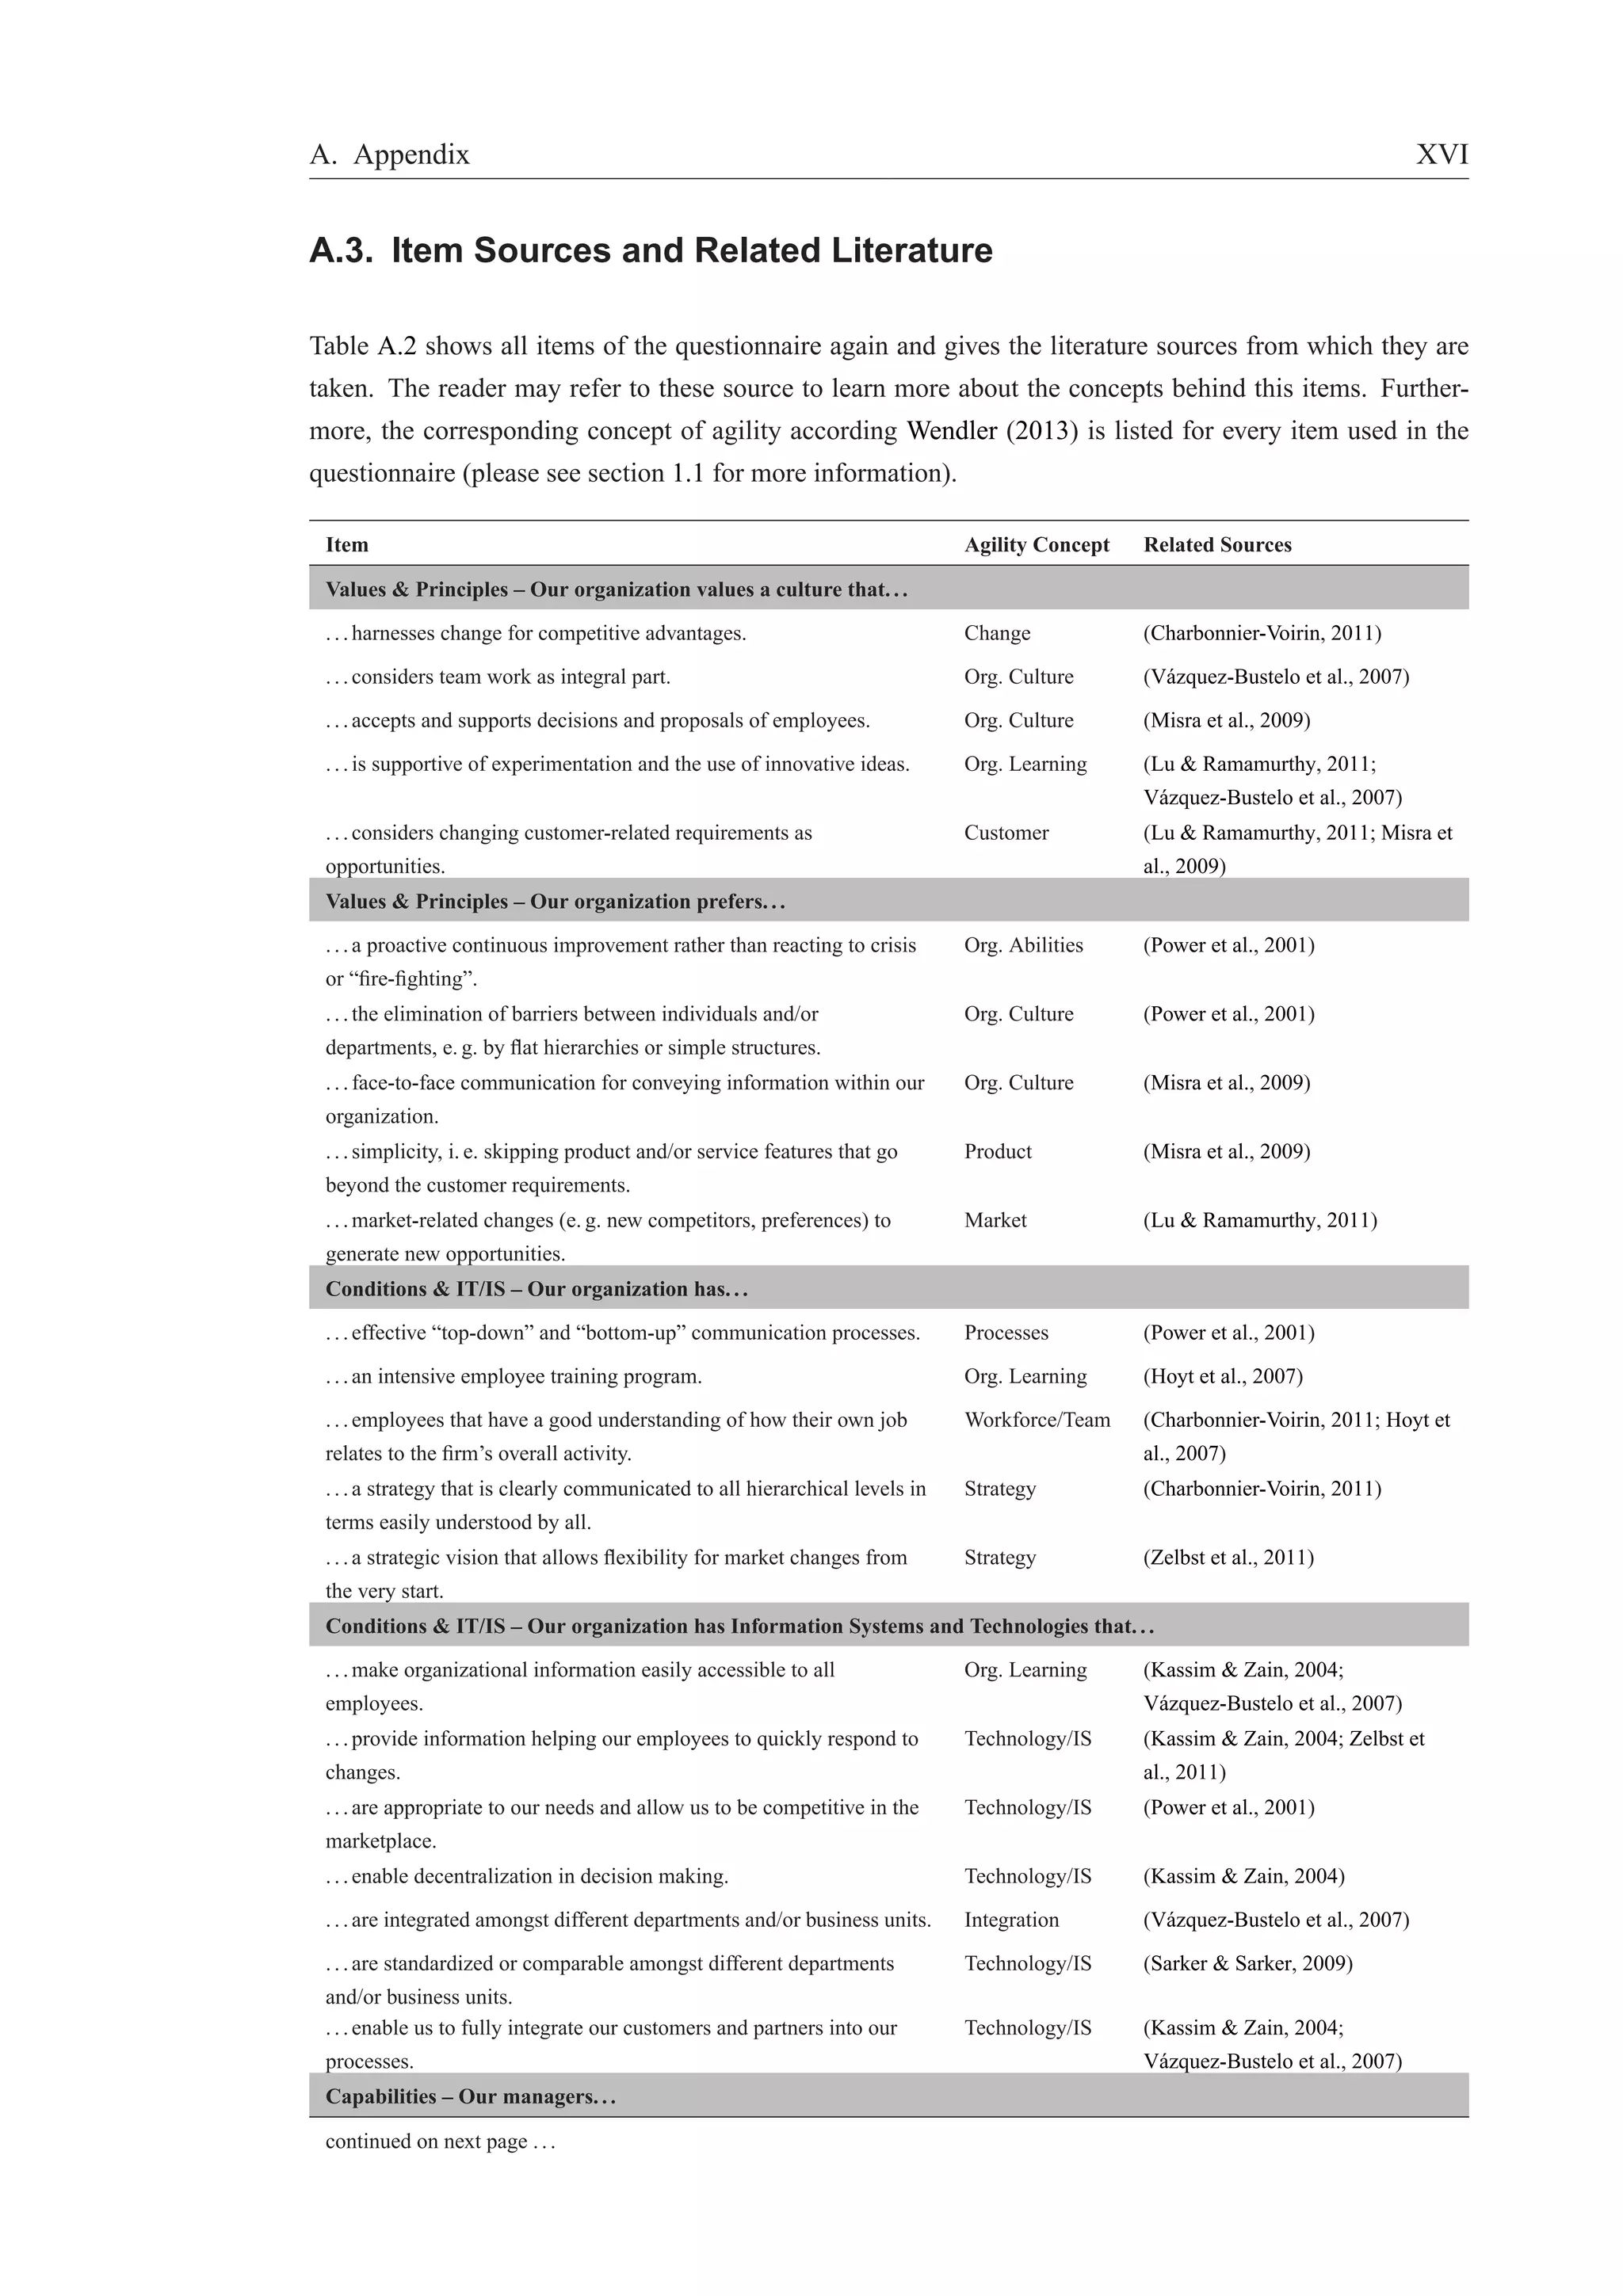
![A. Appendix VIII
A.2. Complete Questionnaire
A.2.1. English Version
General Information
What are the main fields of activity of your organization? [multiple answers possible]
• Programming and Software Development
• IT Services and Consultancy
• Computer Facilities Management
• Other, please specify [text box]
What is your role in your organization?
• Chief Executive Officer
• Chief Information Officer
• Chief Financial Officer
• IT Manager, ICT Manager, or related
• Enterprise Architect, IT Architect, or related
• other, please specify [text box]
Where is your organization located (if your organization has subsidies in different countries, please refer to
your headquarter)?
• Germany
• USA
• other, please specify [text box]
In which regions are your customers located? [multiple answers possible]
• regional
• national
• Europe
• North America
• Latin America / Caribbean
• Asia / Pacific
• Africa
• no answer
What is the approximate number of employees in your organization?
• less than 10
• 10 to 49
• 50 to 249
• 250 to 500
• more than 500
• no answer](https://image.slidesharecdn.com/gelbe-reiheagility-survey-140826135420-phpapp02/75/WHAT-CONSTITUTES-AN-AGILE-ORGANIZATION-DESCRIPTIVE-RESULTS-OF-AN-EMPIRICAL-INVESTIGATION-45-2048.jpg)
![A. Appendix IX
Values and Principles – Organization
Please state to what extend the following statements reflect the values and principles in your organization.
[Scale: completely–mainly–partly–little–not at all]
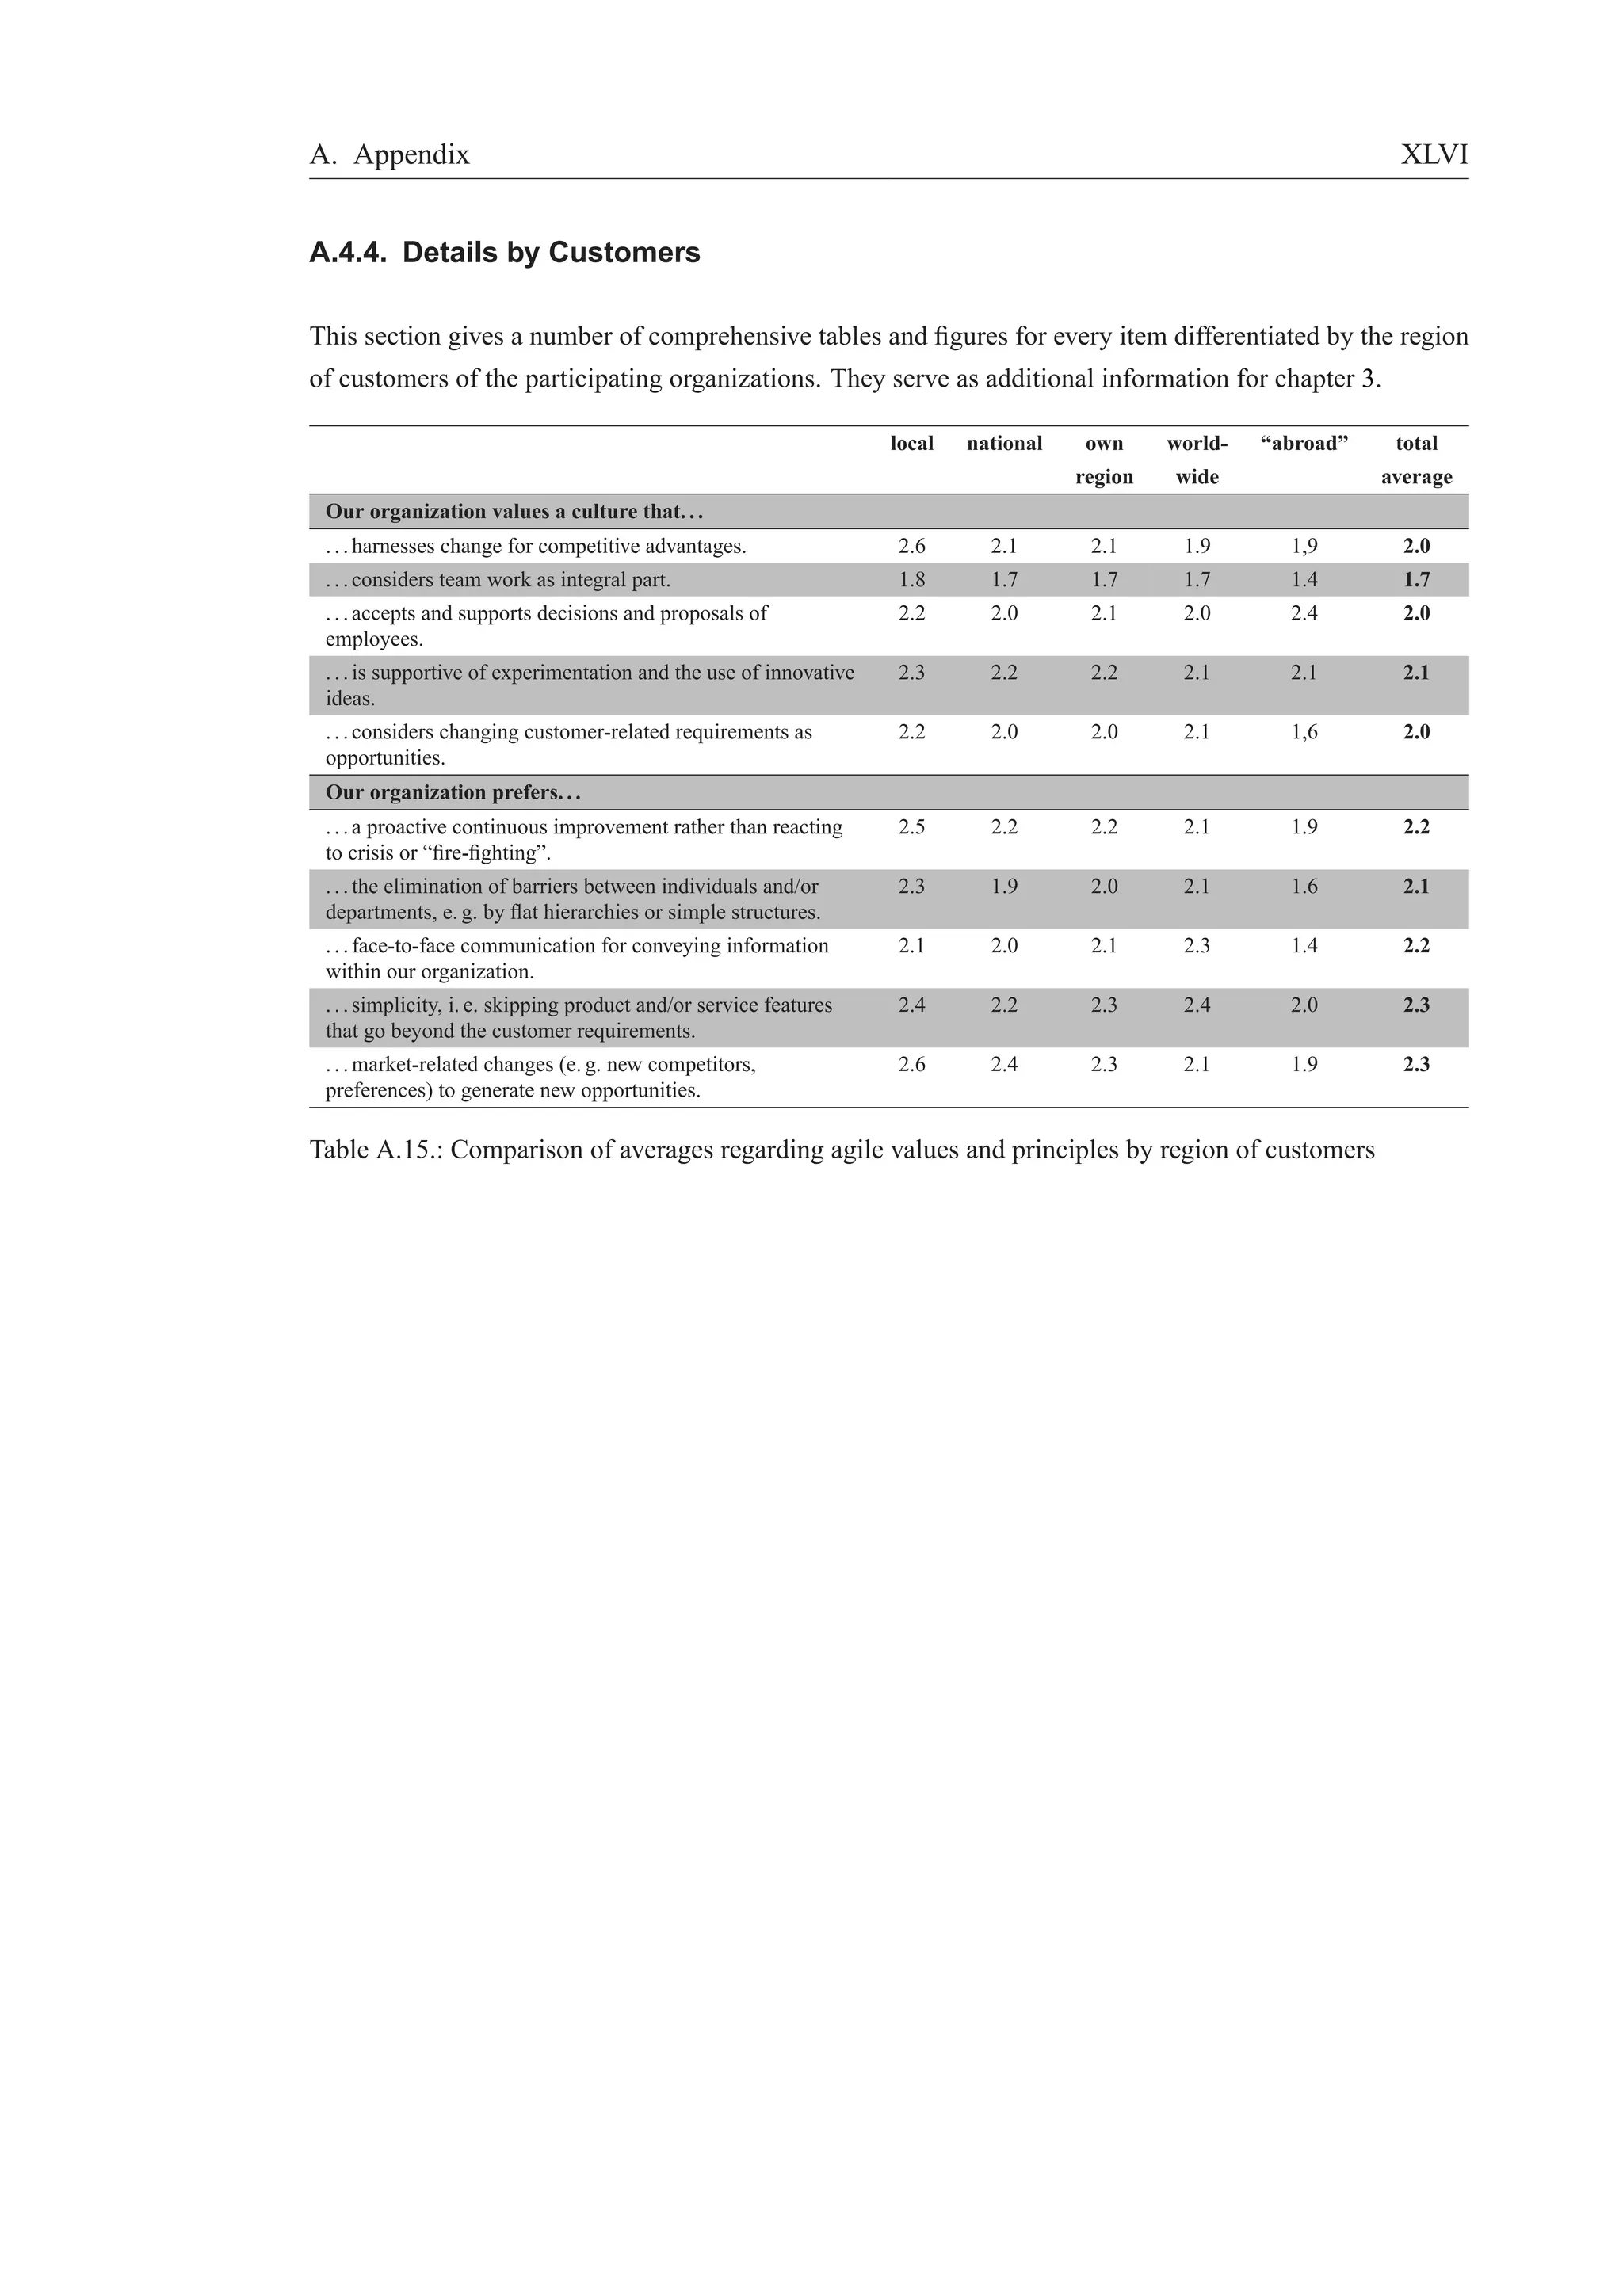
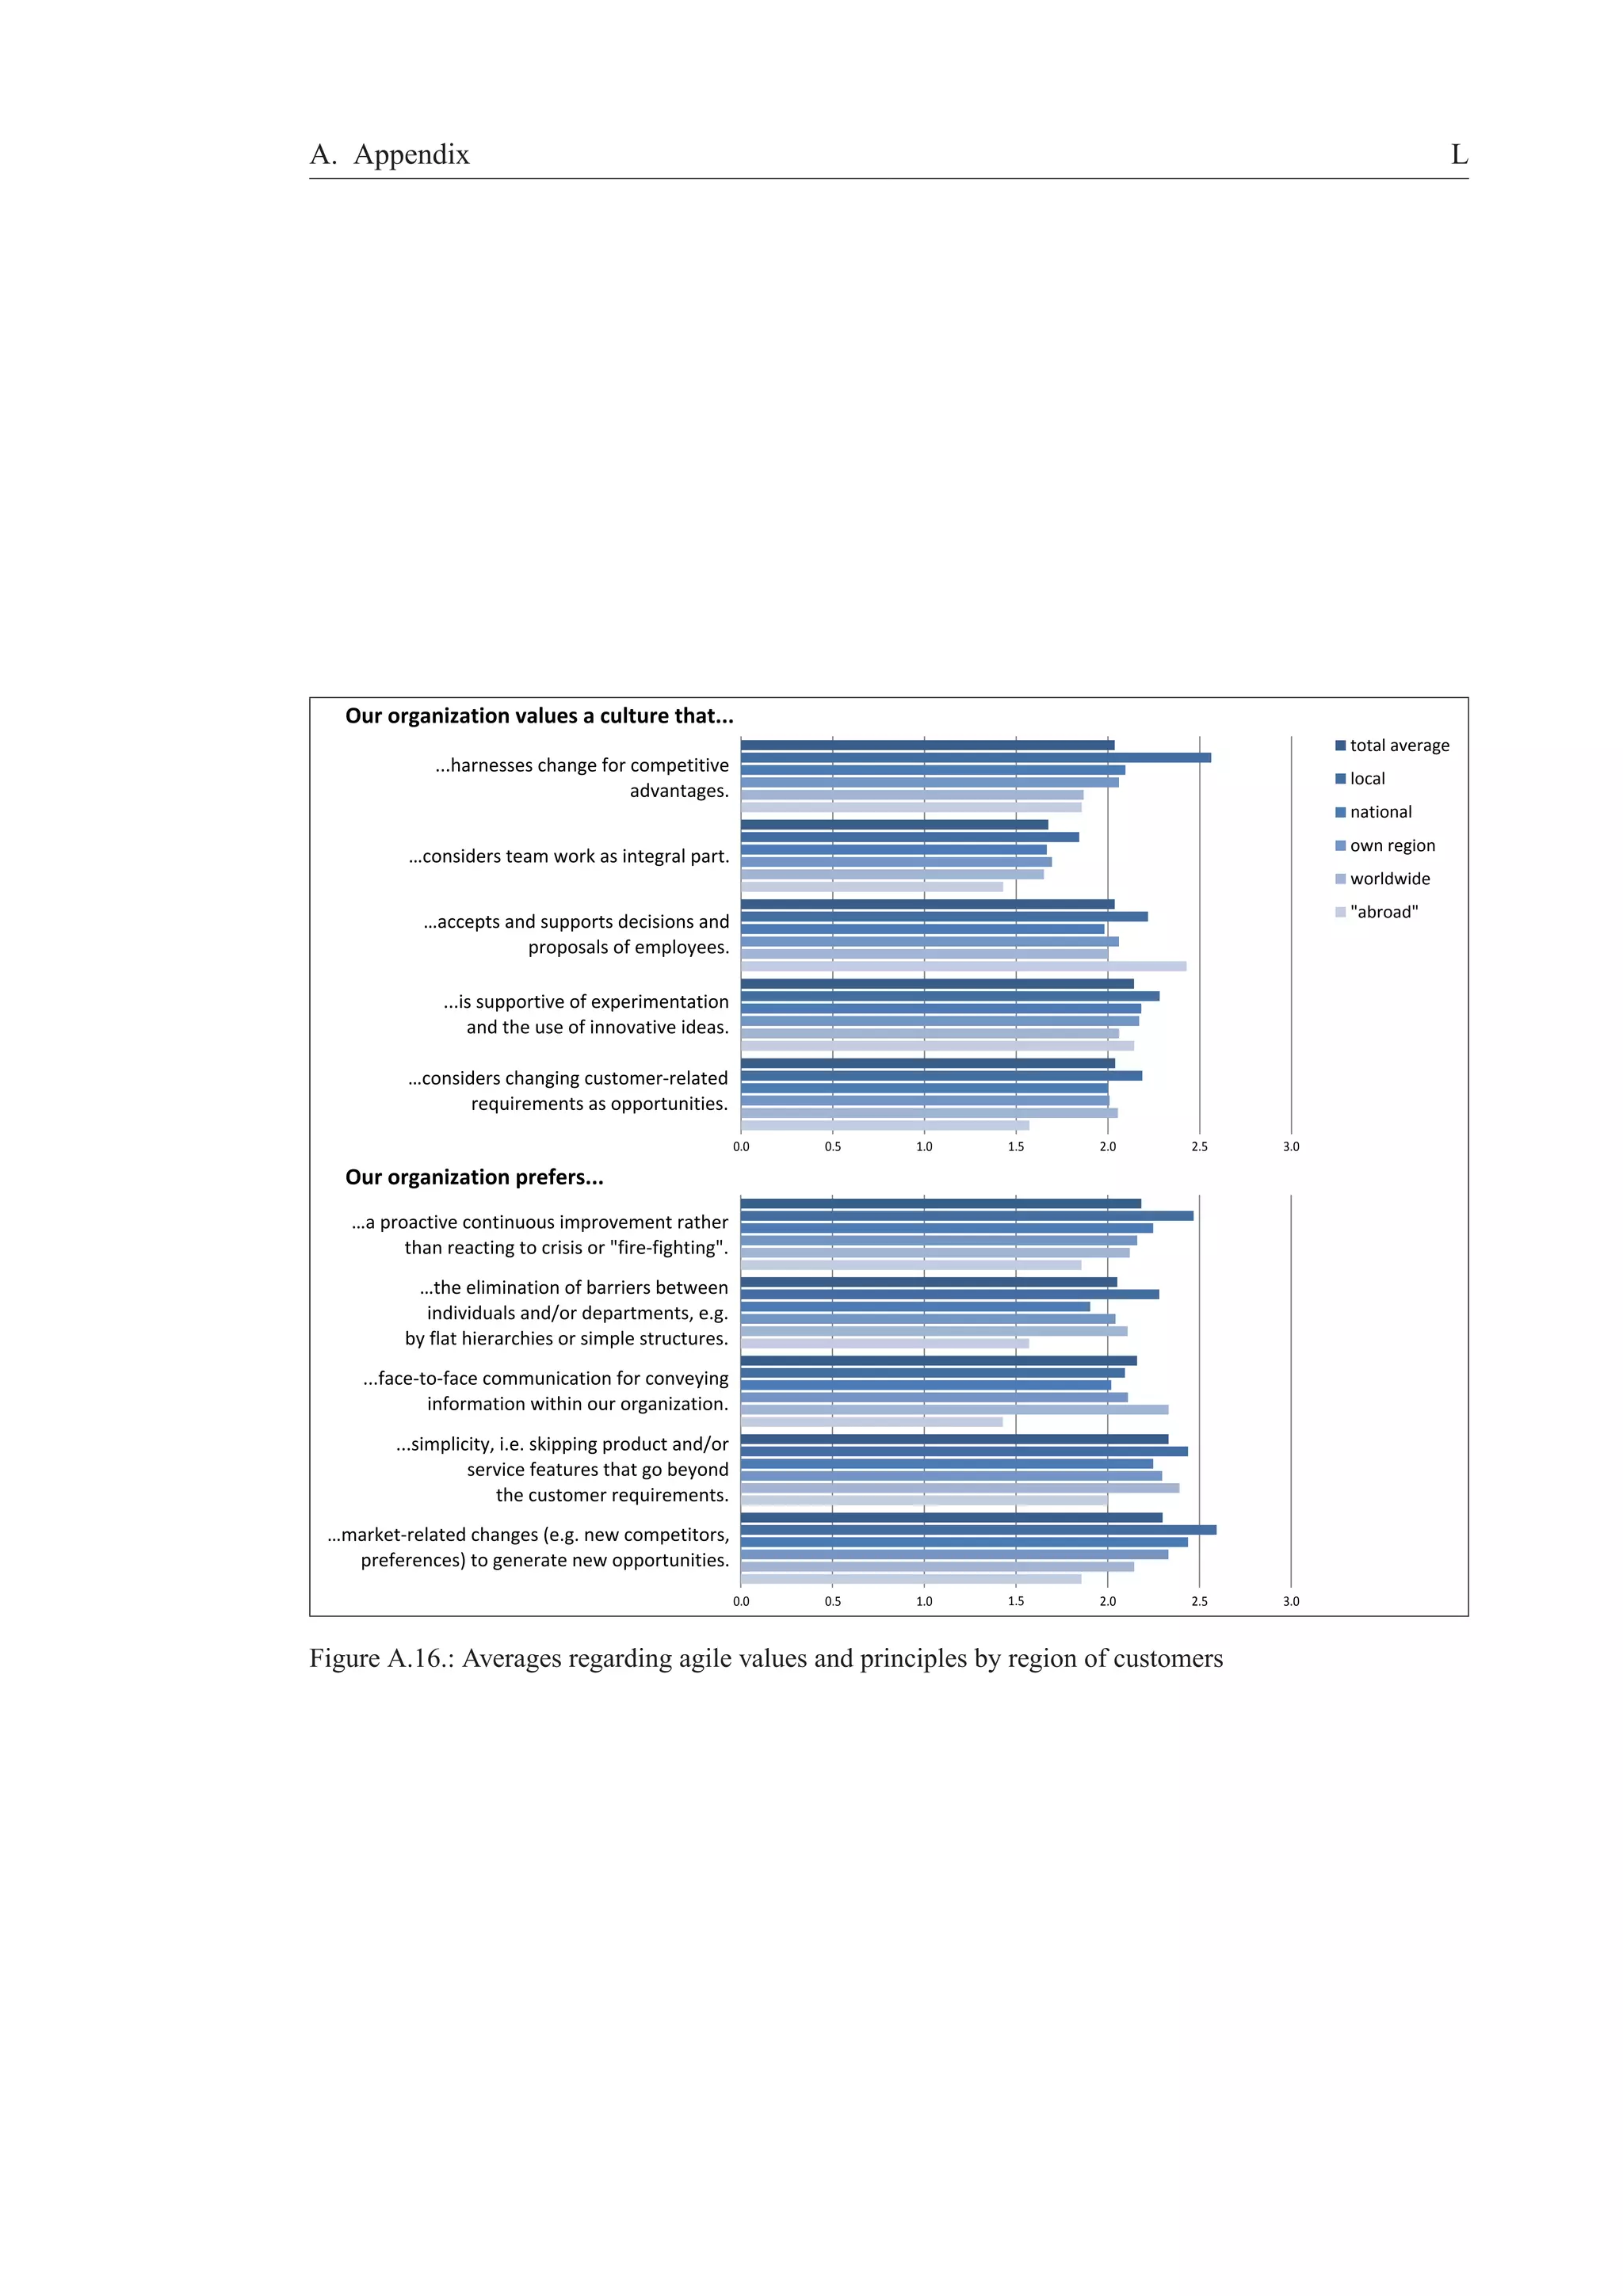
Our organization values a culture that. . .
. . . harnesses change for competitive advantages.
. . . considers team work as integral part.
. . . accepts and supports decisions and proposals of employees.
. . . is supportive of experimentation and the use of innovative ideas.
. . . considers changing customer-related requirements as opportunities.
Our organization prefers. . .
. . . a proactive continuous improvement rather than reacting to crisis or “fire-fighting”.
. . . the elimination of barriers between individuals and/or departments, e. g. by flat hierarchies or simple
structures.
. . . face-to-face communication for conveying information within our organization.
. . . simplicity, i. e. skipping product and/or service features that go beyond the customer requirements.
. . . market-related changes (e. g. new competitors, preferences) to generate new opportunities.
Conditions – Organization
Please state to what extend the following conditions and circumstances are implemented in your organiza-tion.
[Scale: completely–mainly–partly–little–not at all]
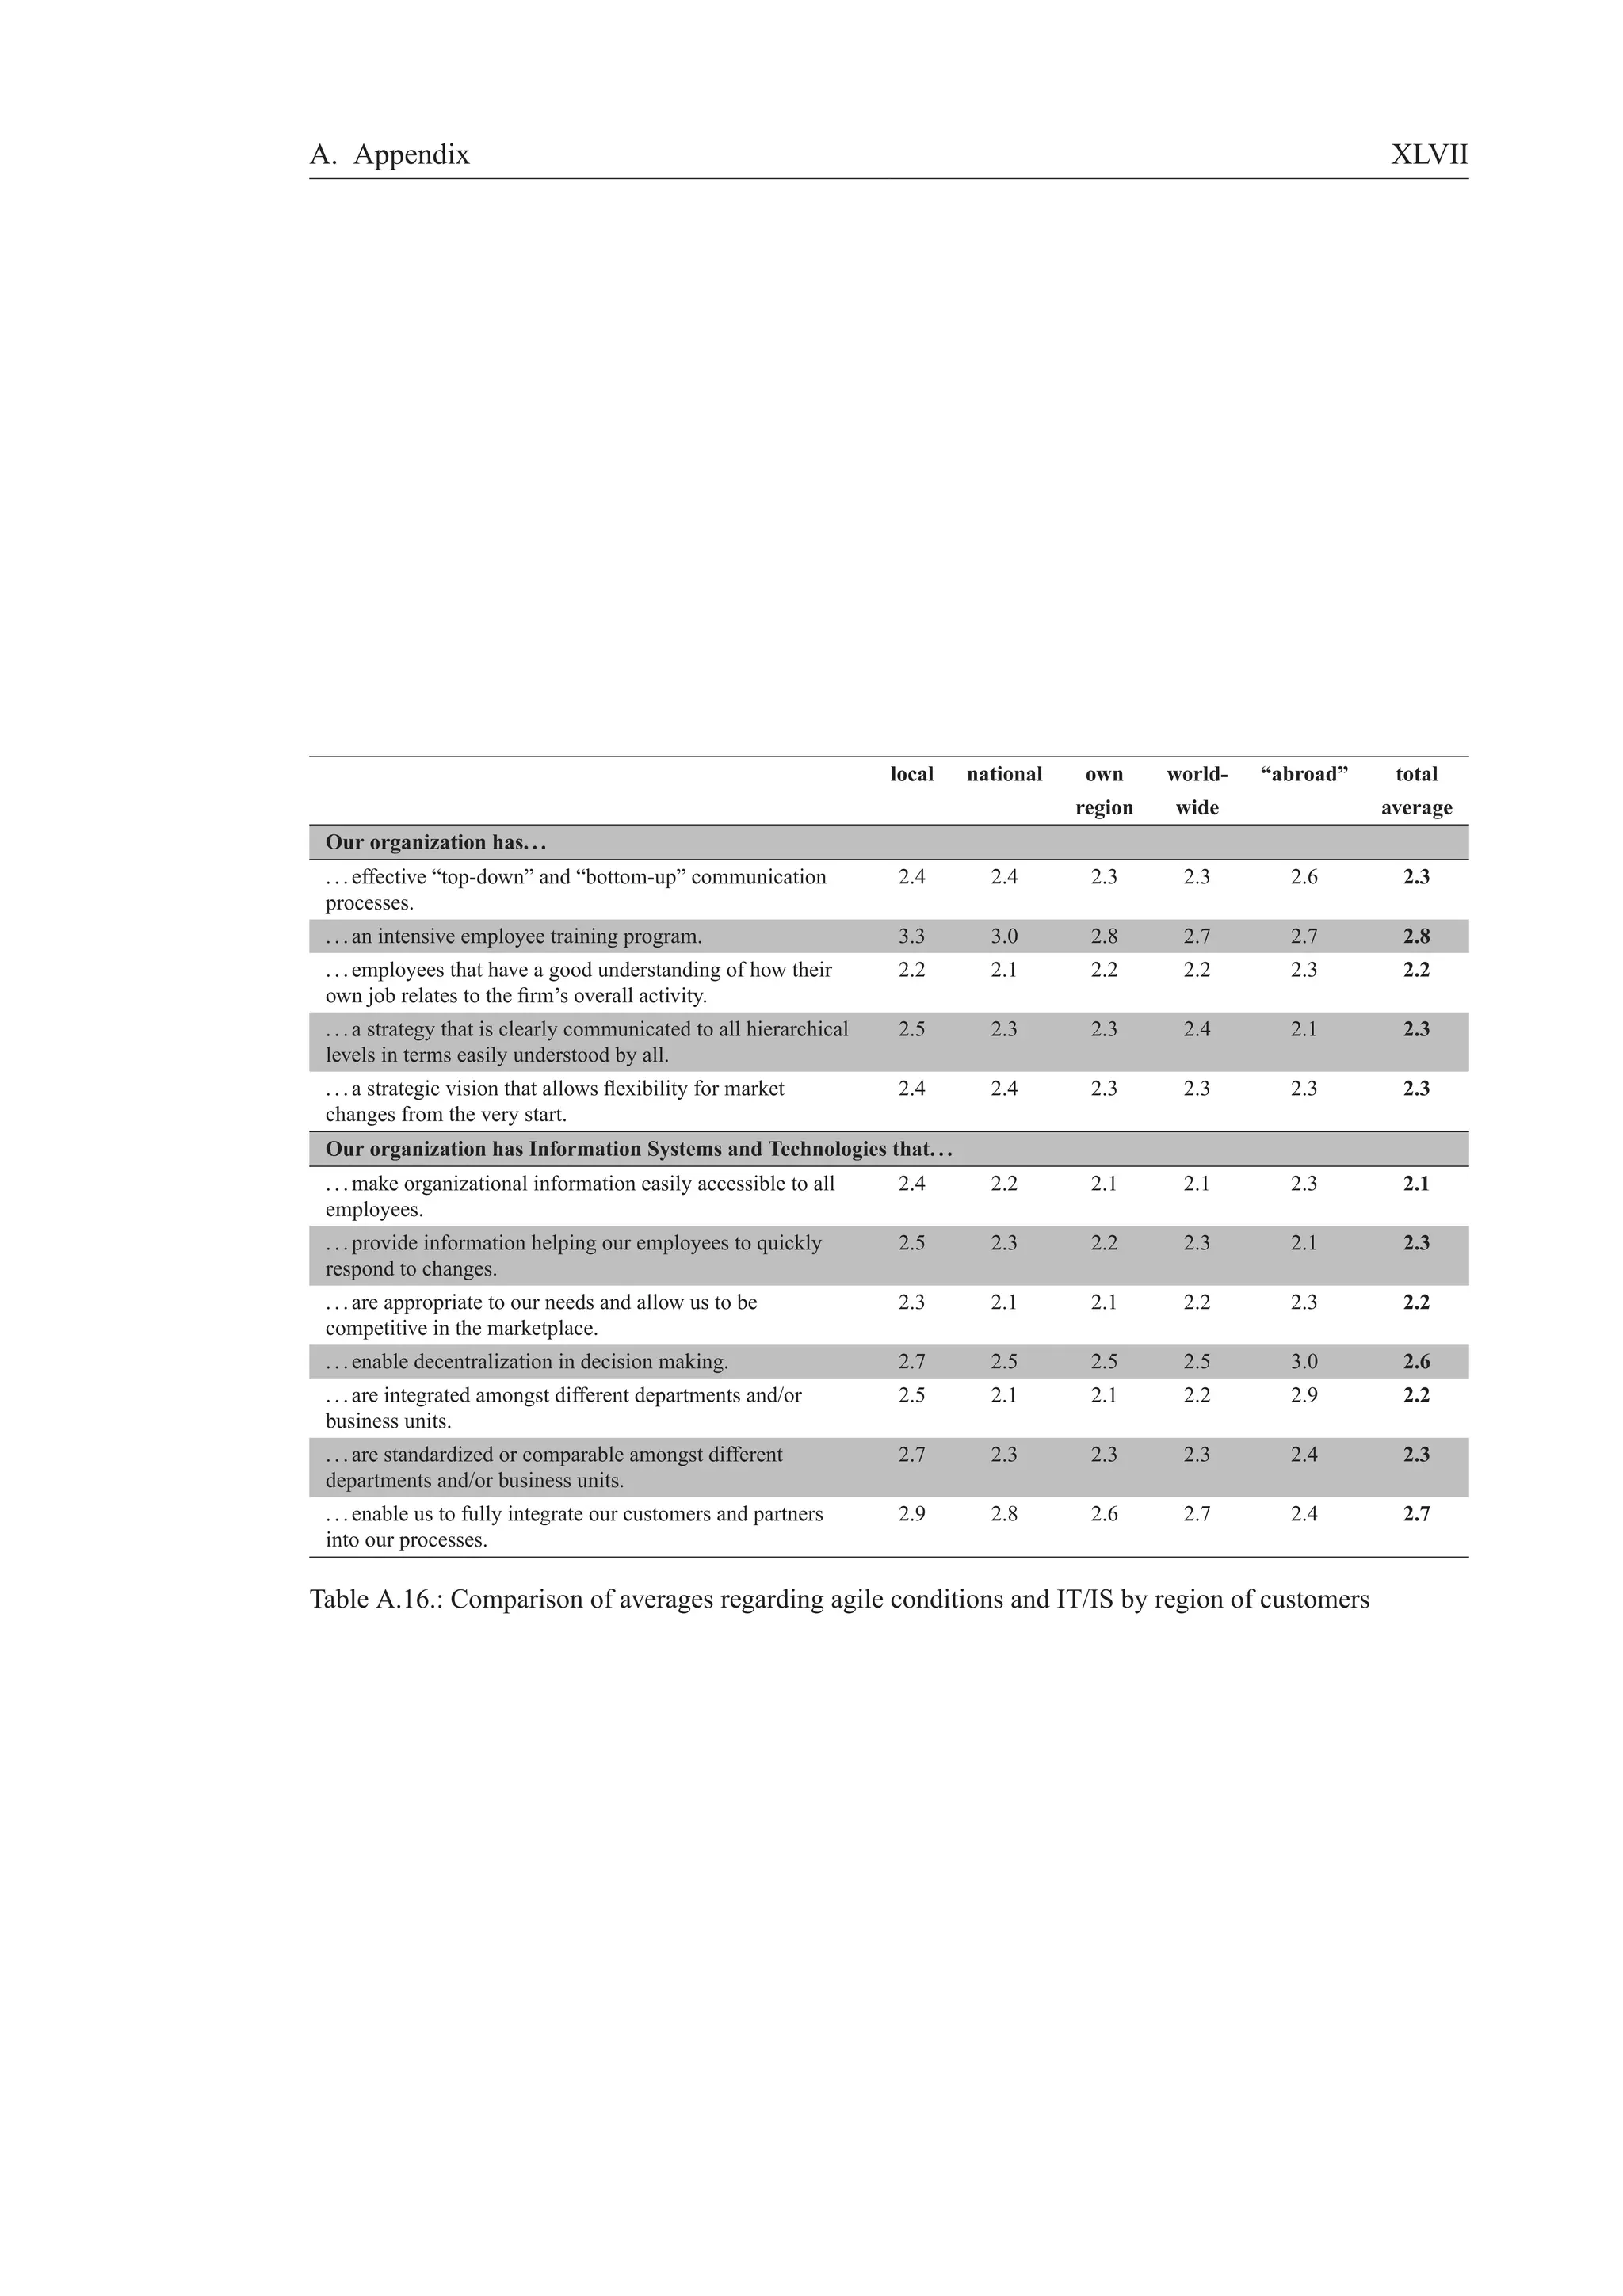
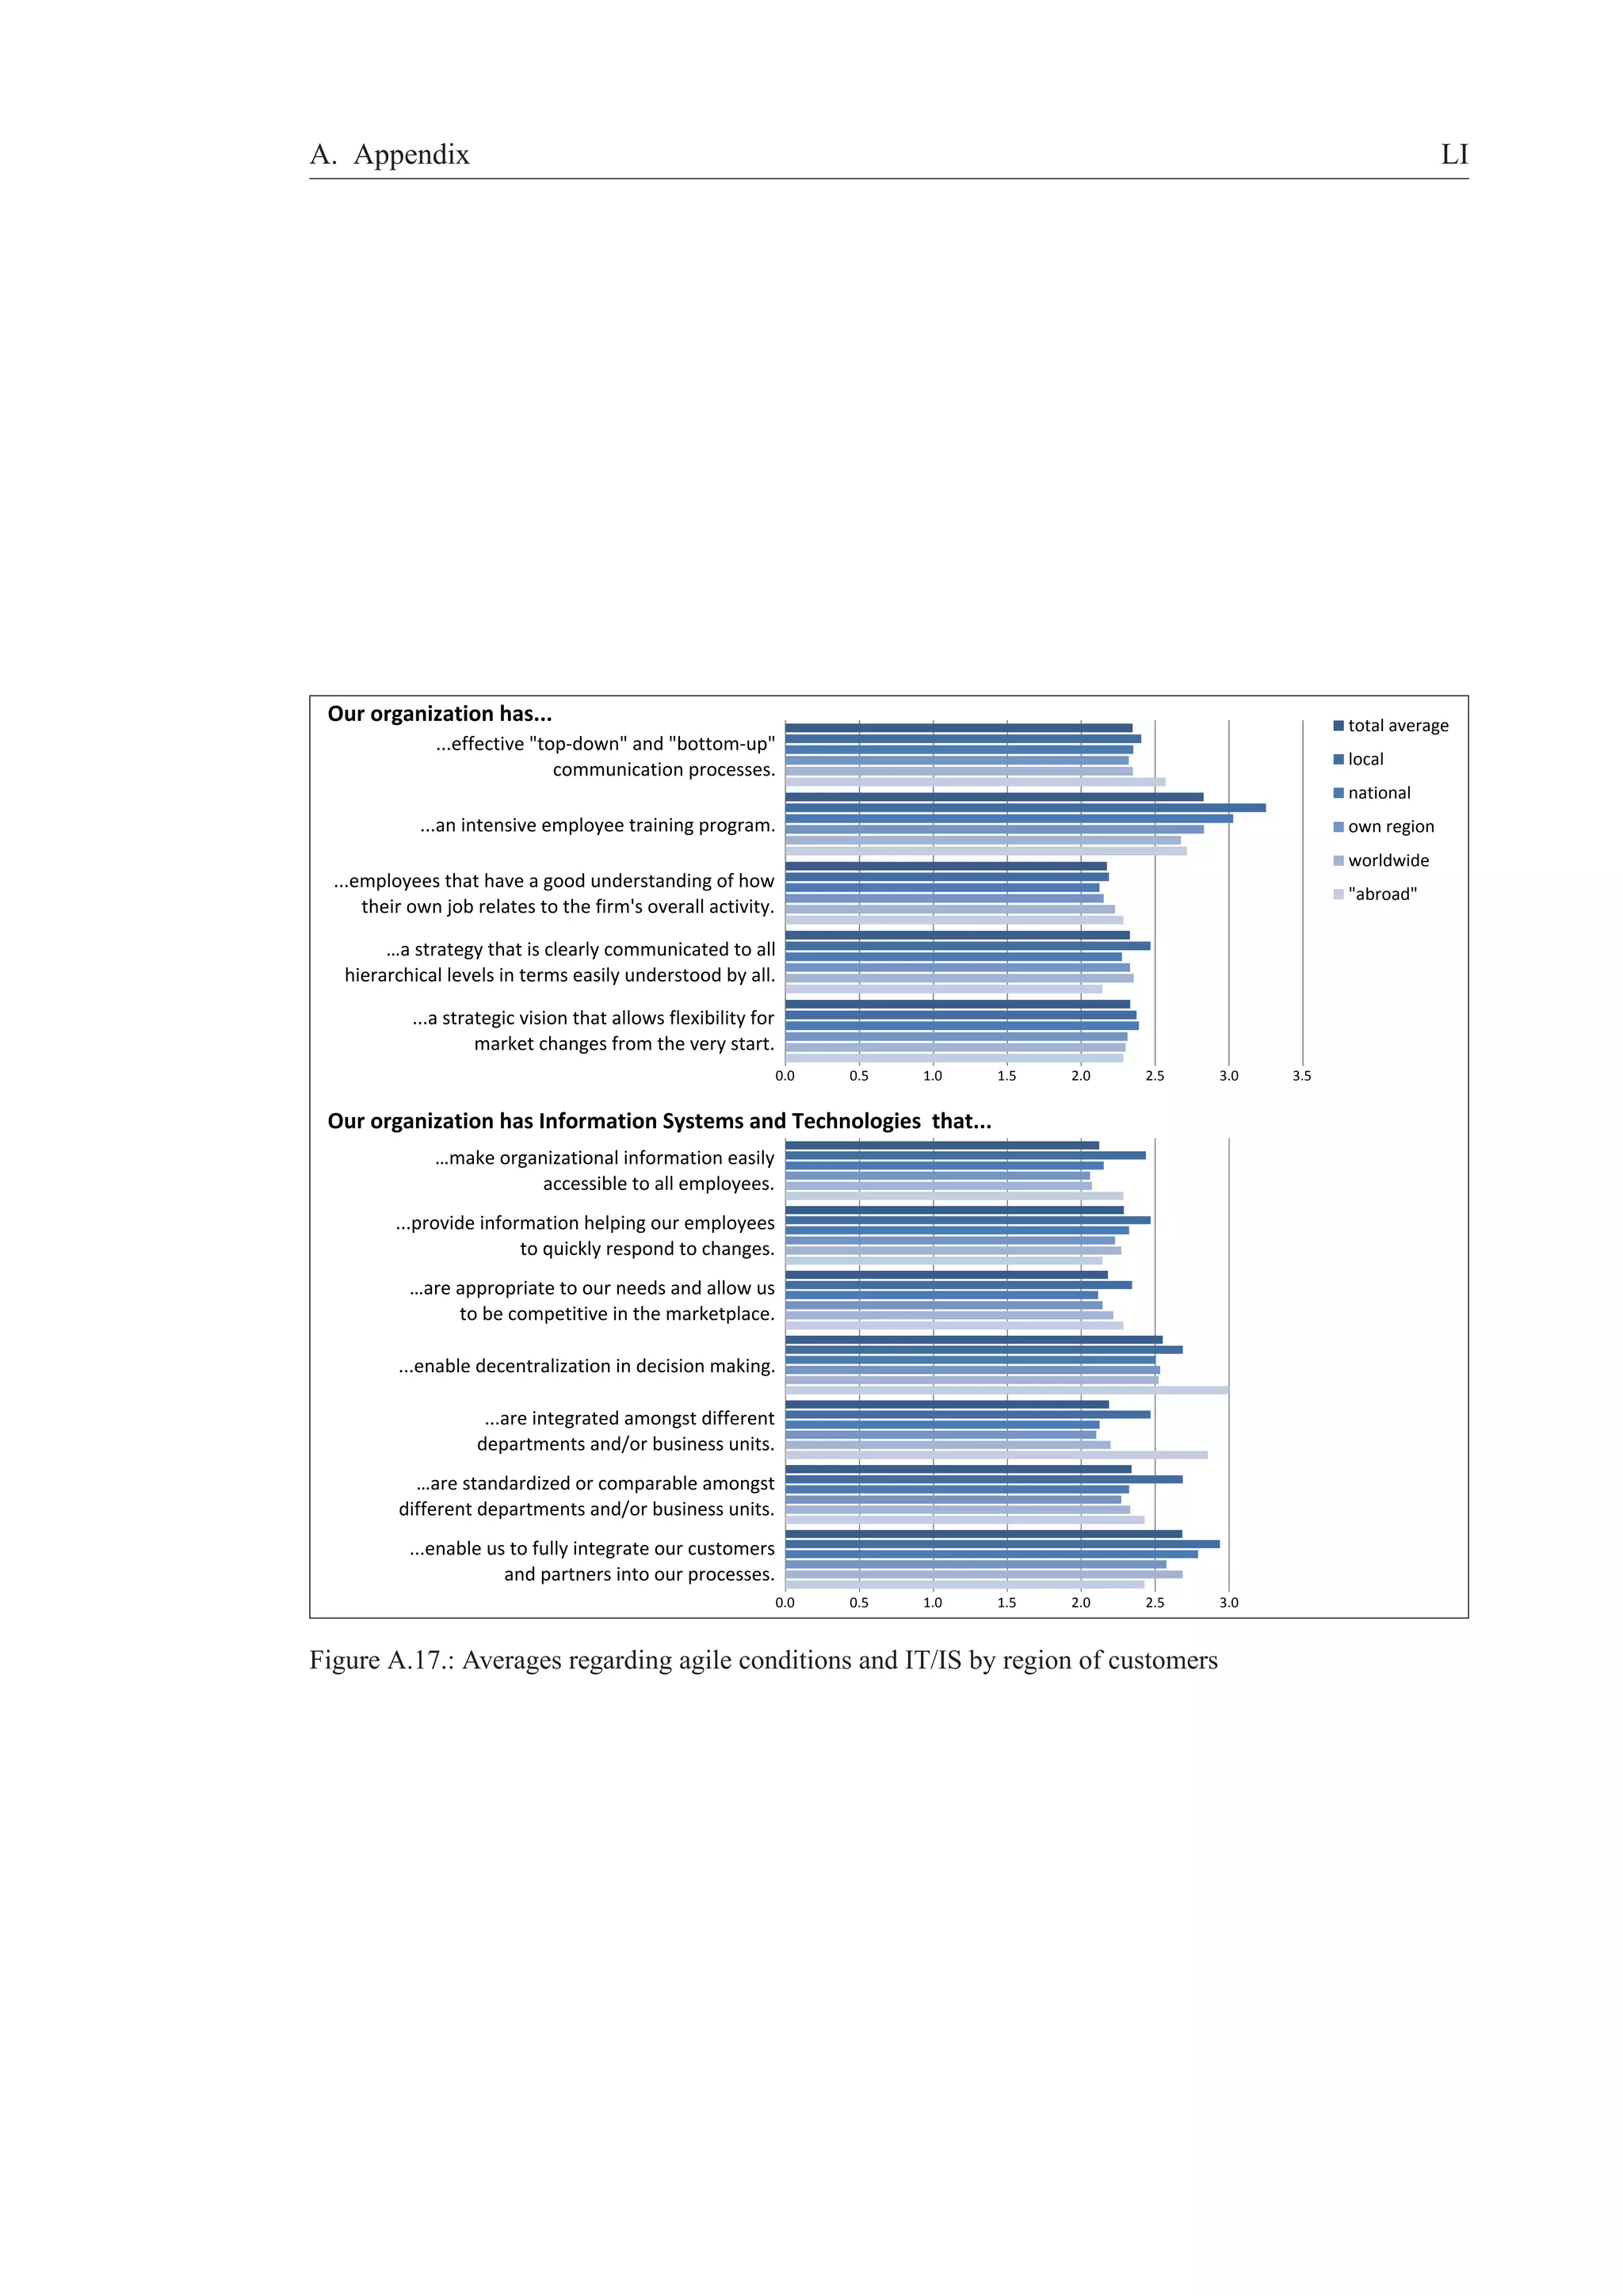
Our organization has. . .
. . . effective “top-down” and “bottom-up” communication processes.
. . . an intensive employee training program.
. . . employees that have a good understanding of how their own job relates to the firm’s overall activity.
. . . a strategy that is clearly communicated to all hierarchical levels in terms easily understood by all.
. . . a strategic vision that allows flexibility for market changes from the very start.
Our organization has Information Systems and Technologies that. . .
. . . make organizational information easily accessible to all employees.
. . . provide information helping our employees to quickly respond to changes.
. . . are appropriate to our needs and allow us to be competitive in the marketplace.
. . . enable decentralization in decision making.
. . . are integrated amongst different departments and/or business units.
. . . are standardized or comparable amongst different departments and/or business units.
. . . enable us to fully integrate our customers and partners into our processes.
Capabilities – Employees and Managers
Please state how many of your employees and managers share the following capabilities. [Scale: all–many–
some–few–none]](https://image.slidesharecdn.com/gelbe-reiheagility-survey-140826135420-phpapp02/75/WHAT-CONSTITUTES-AN-AGILE-ORGANIZATION-DESCRIPTIVE-RESULTS-OF-AN-EMPIRICAL-INVESTIGATION-46-2048.jpg)
![A. Appendix X
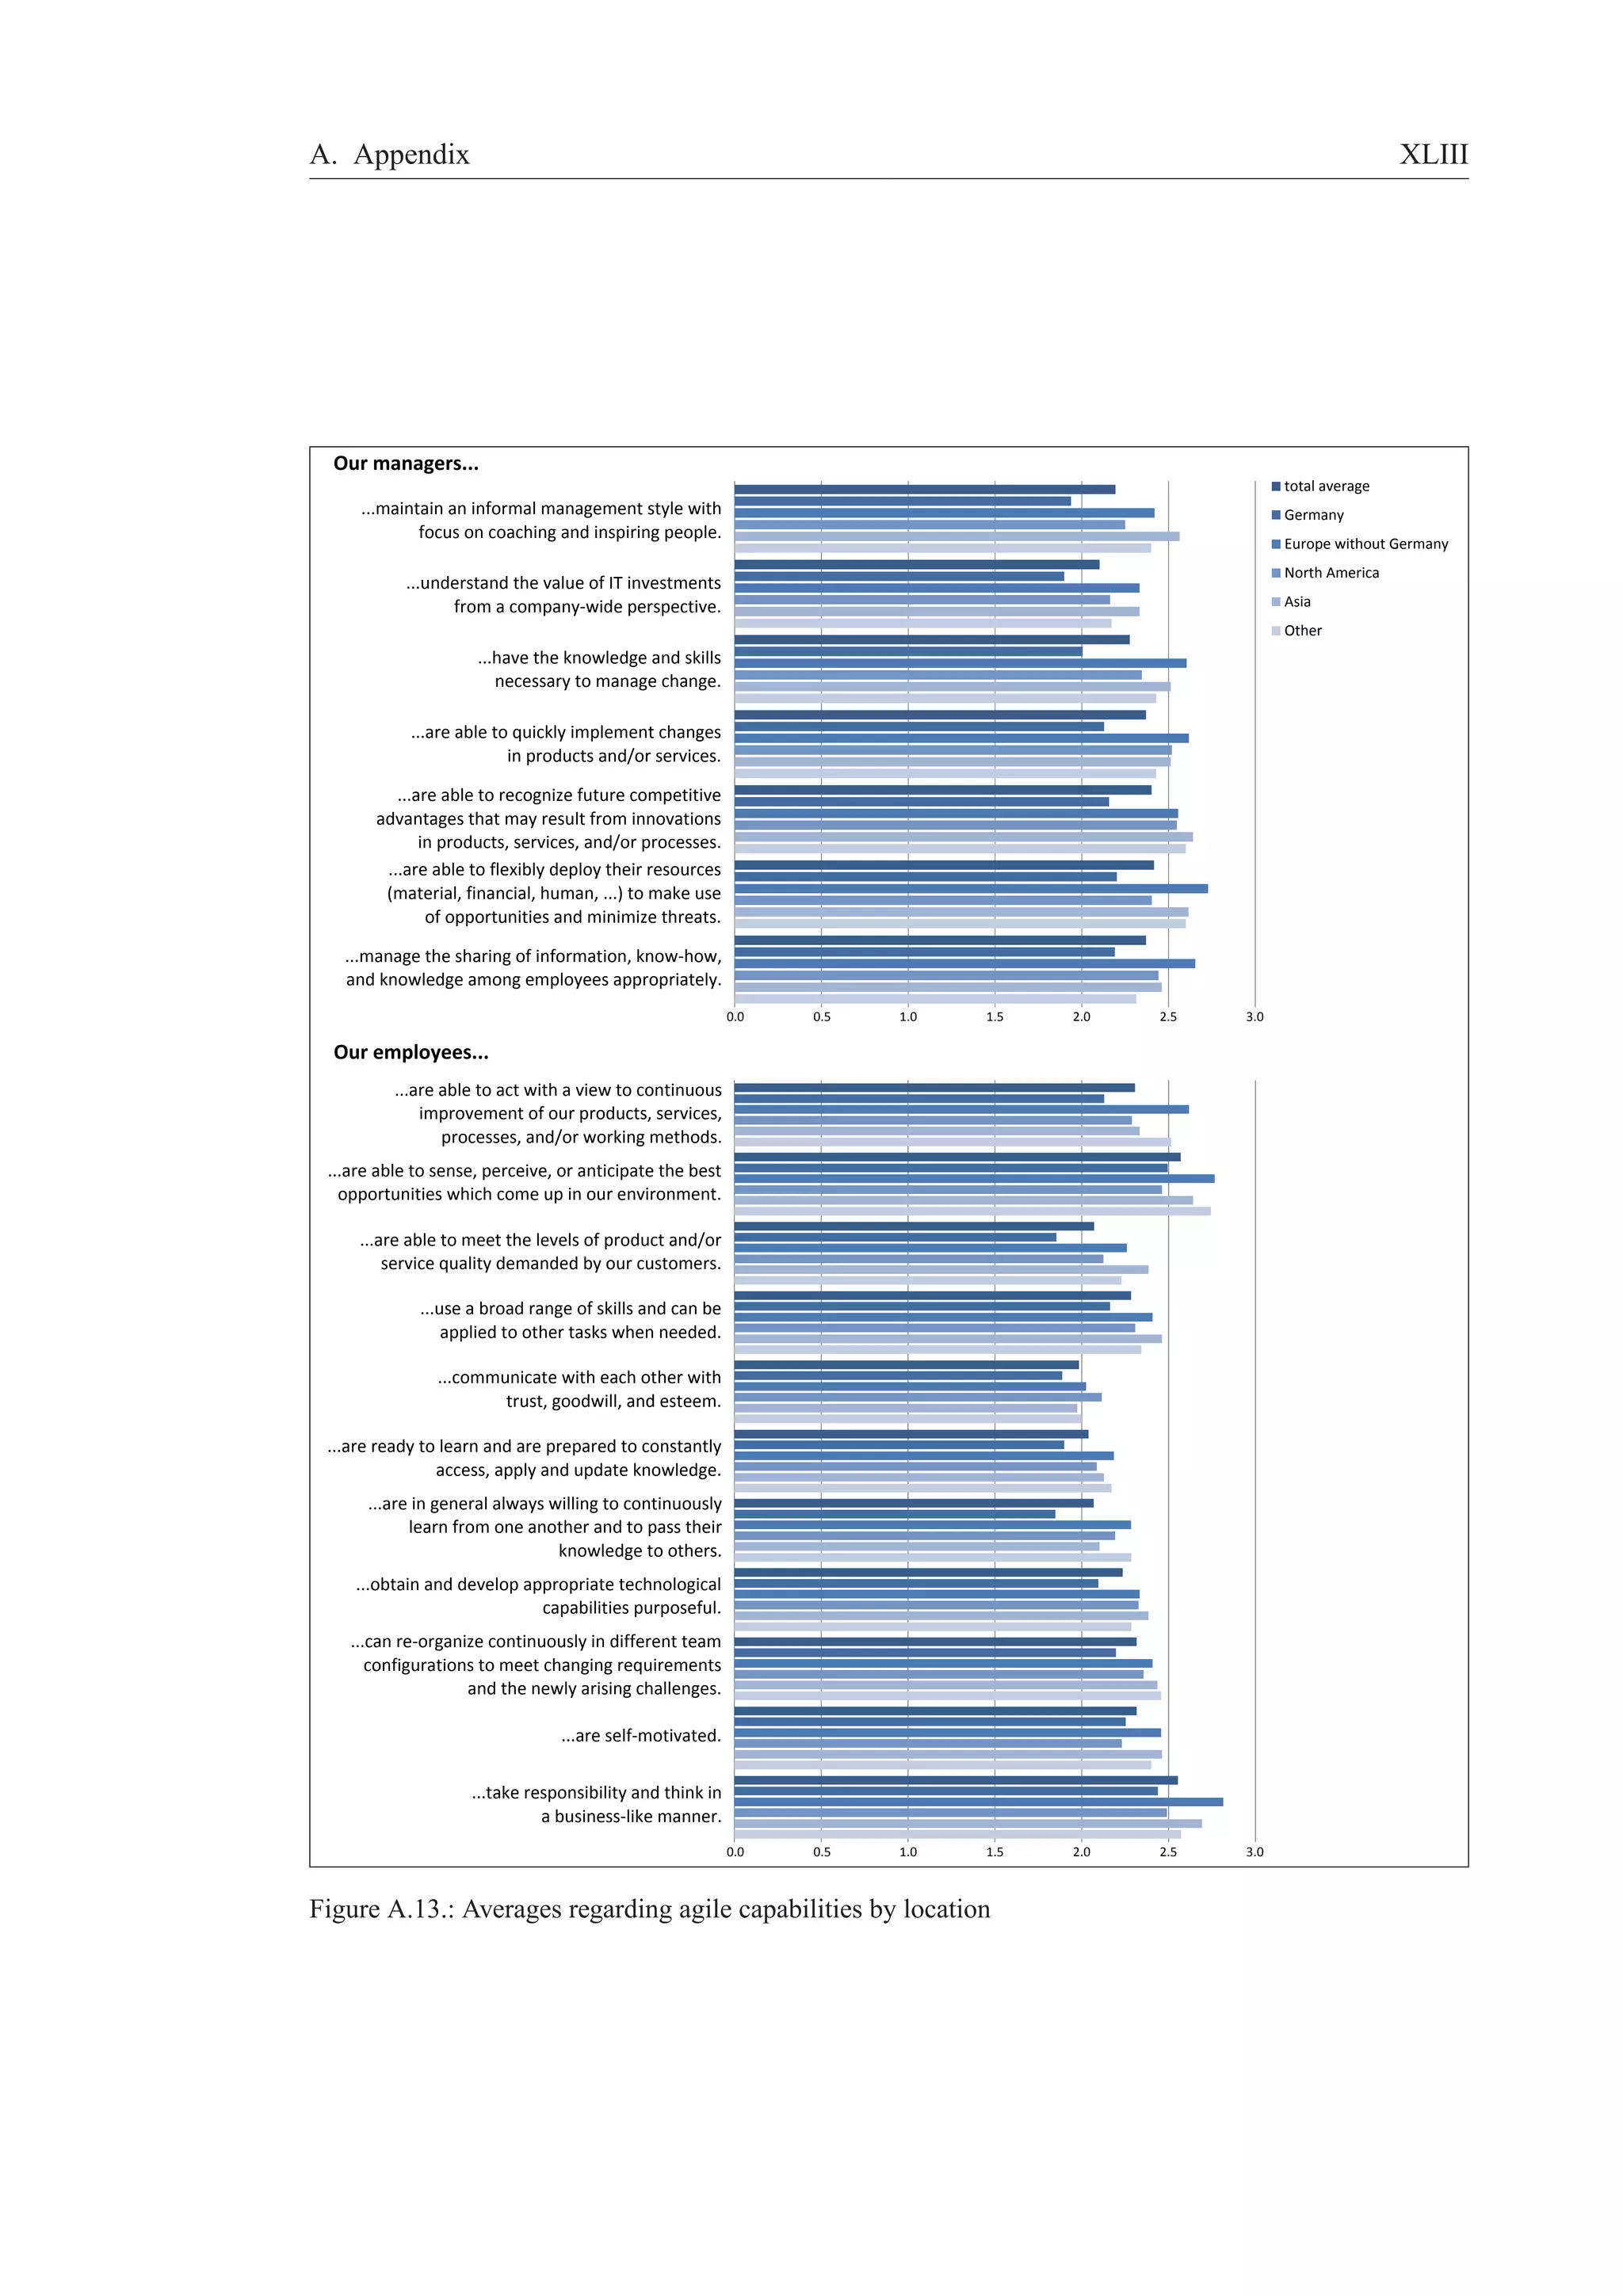
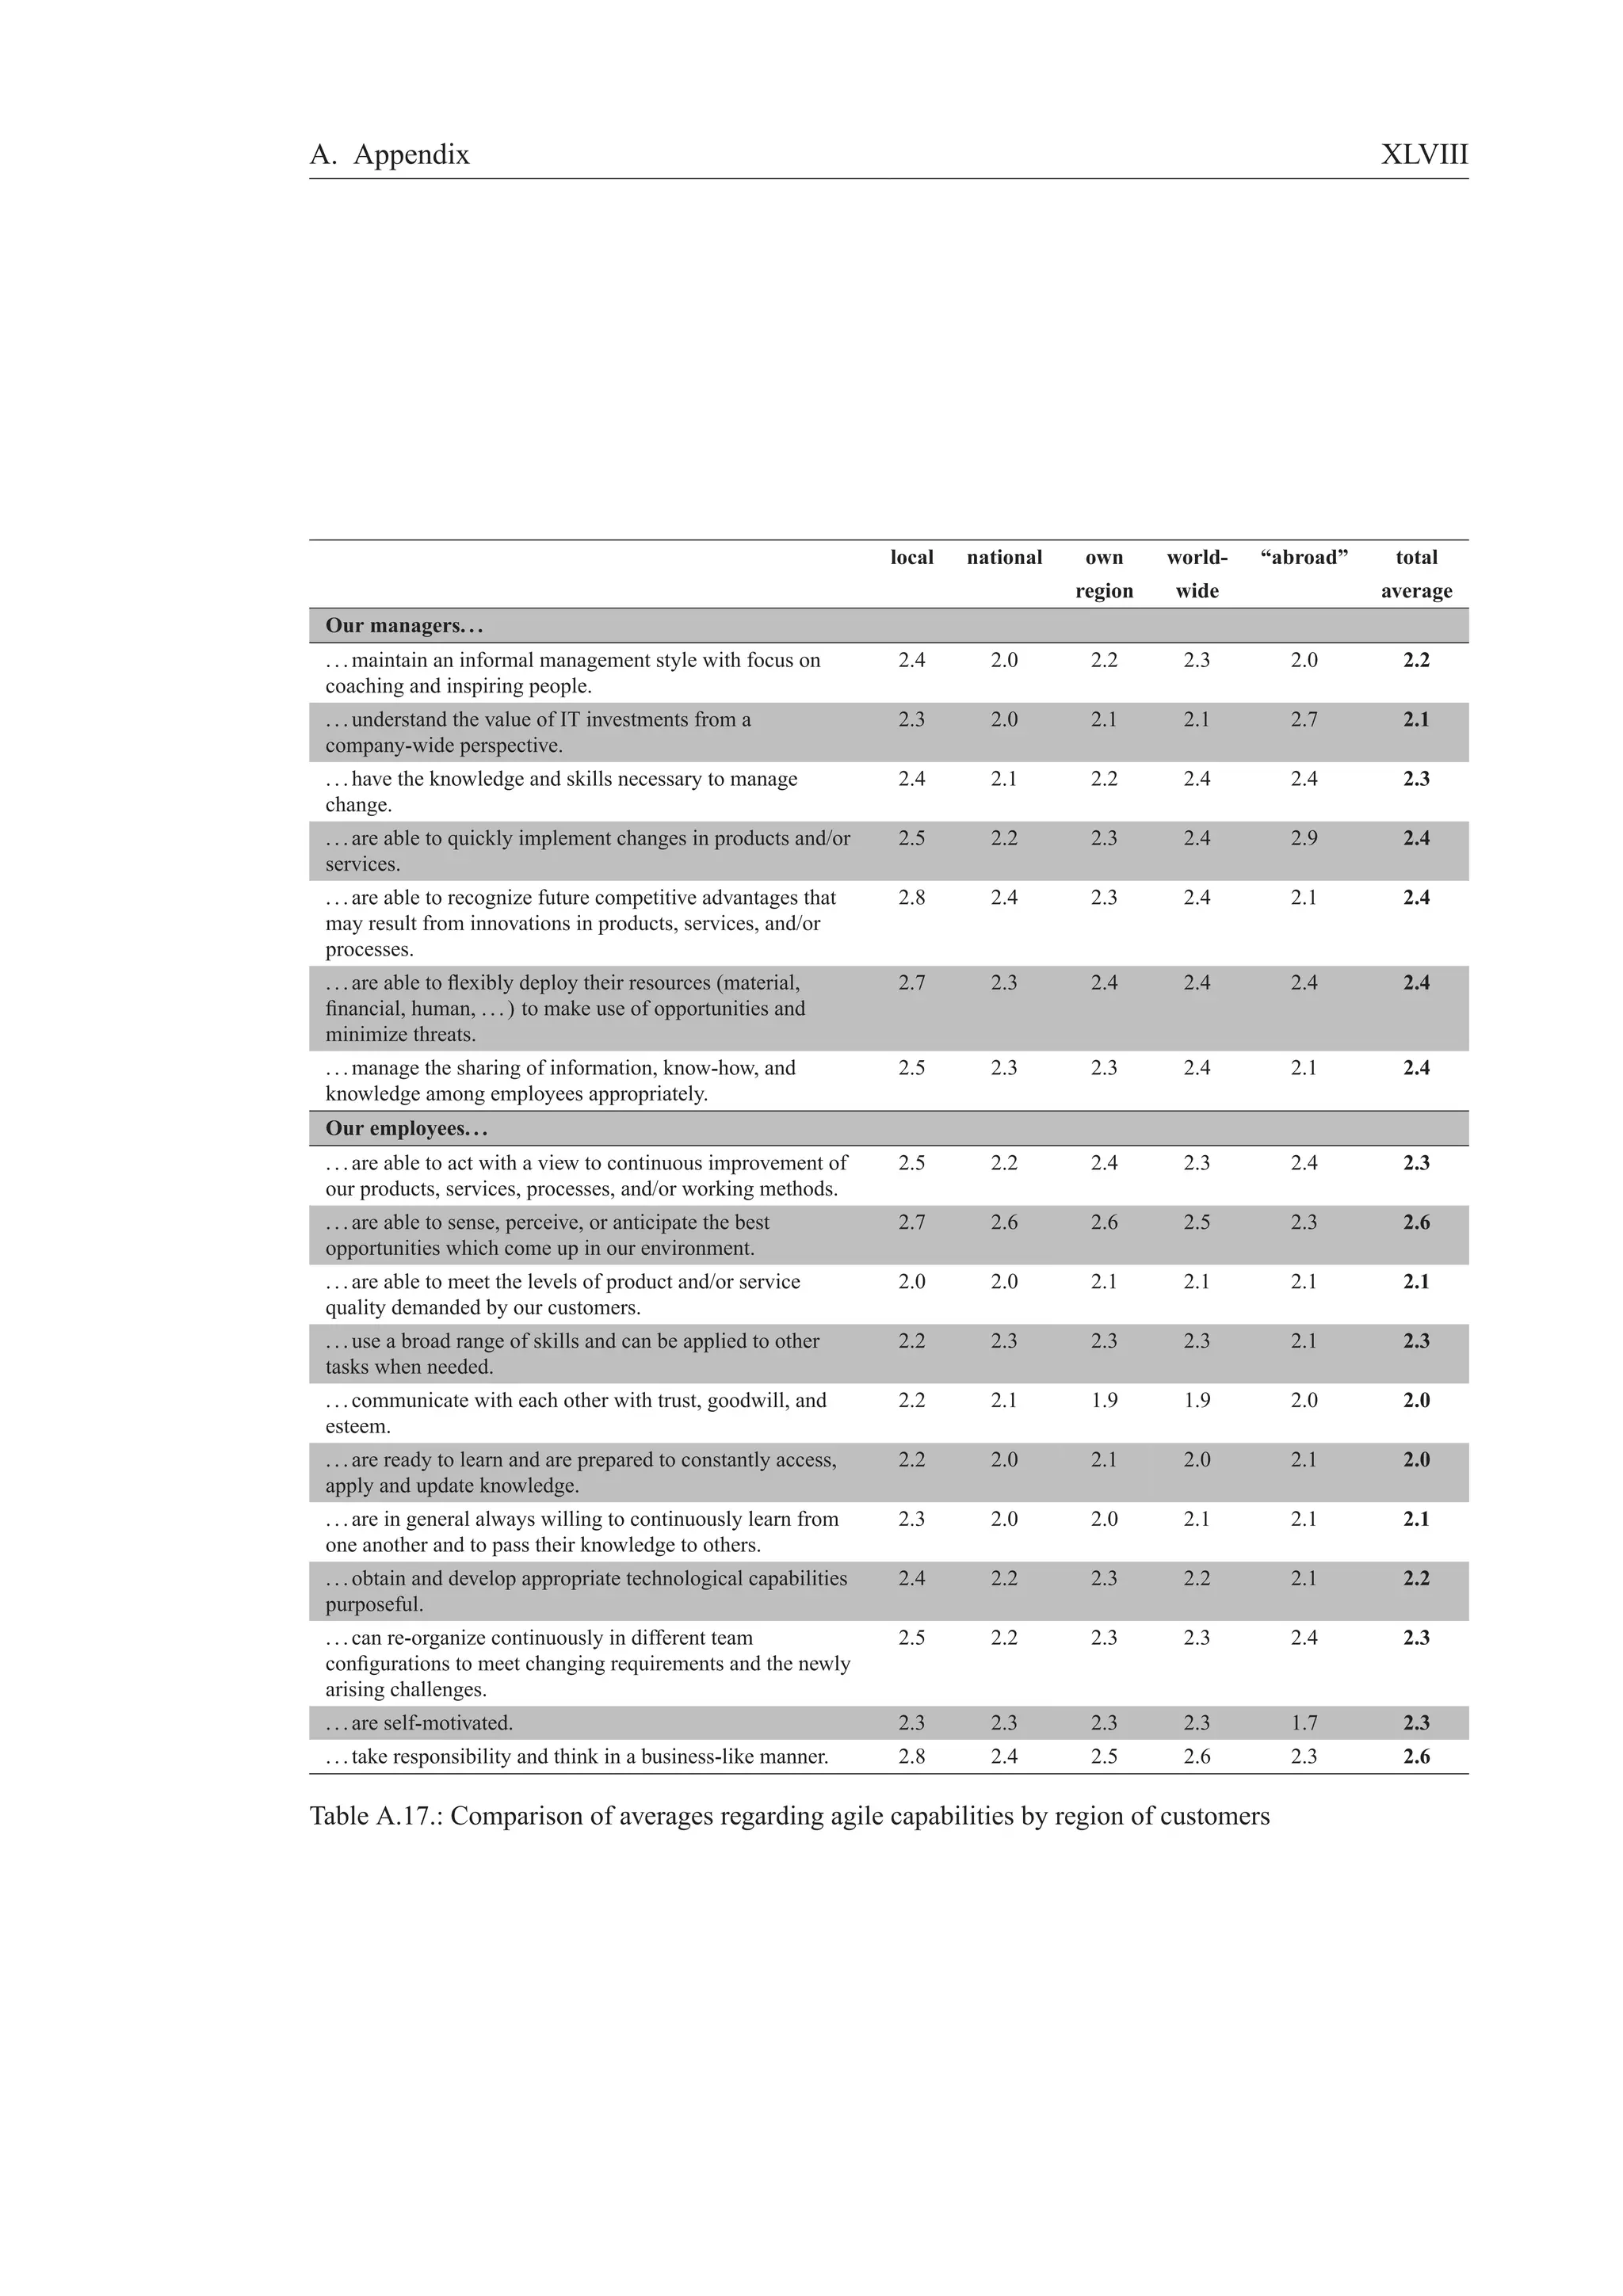
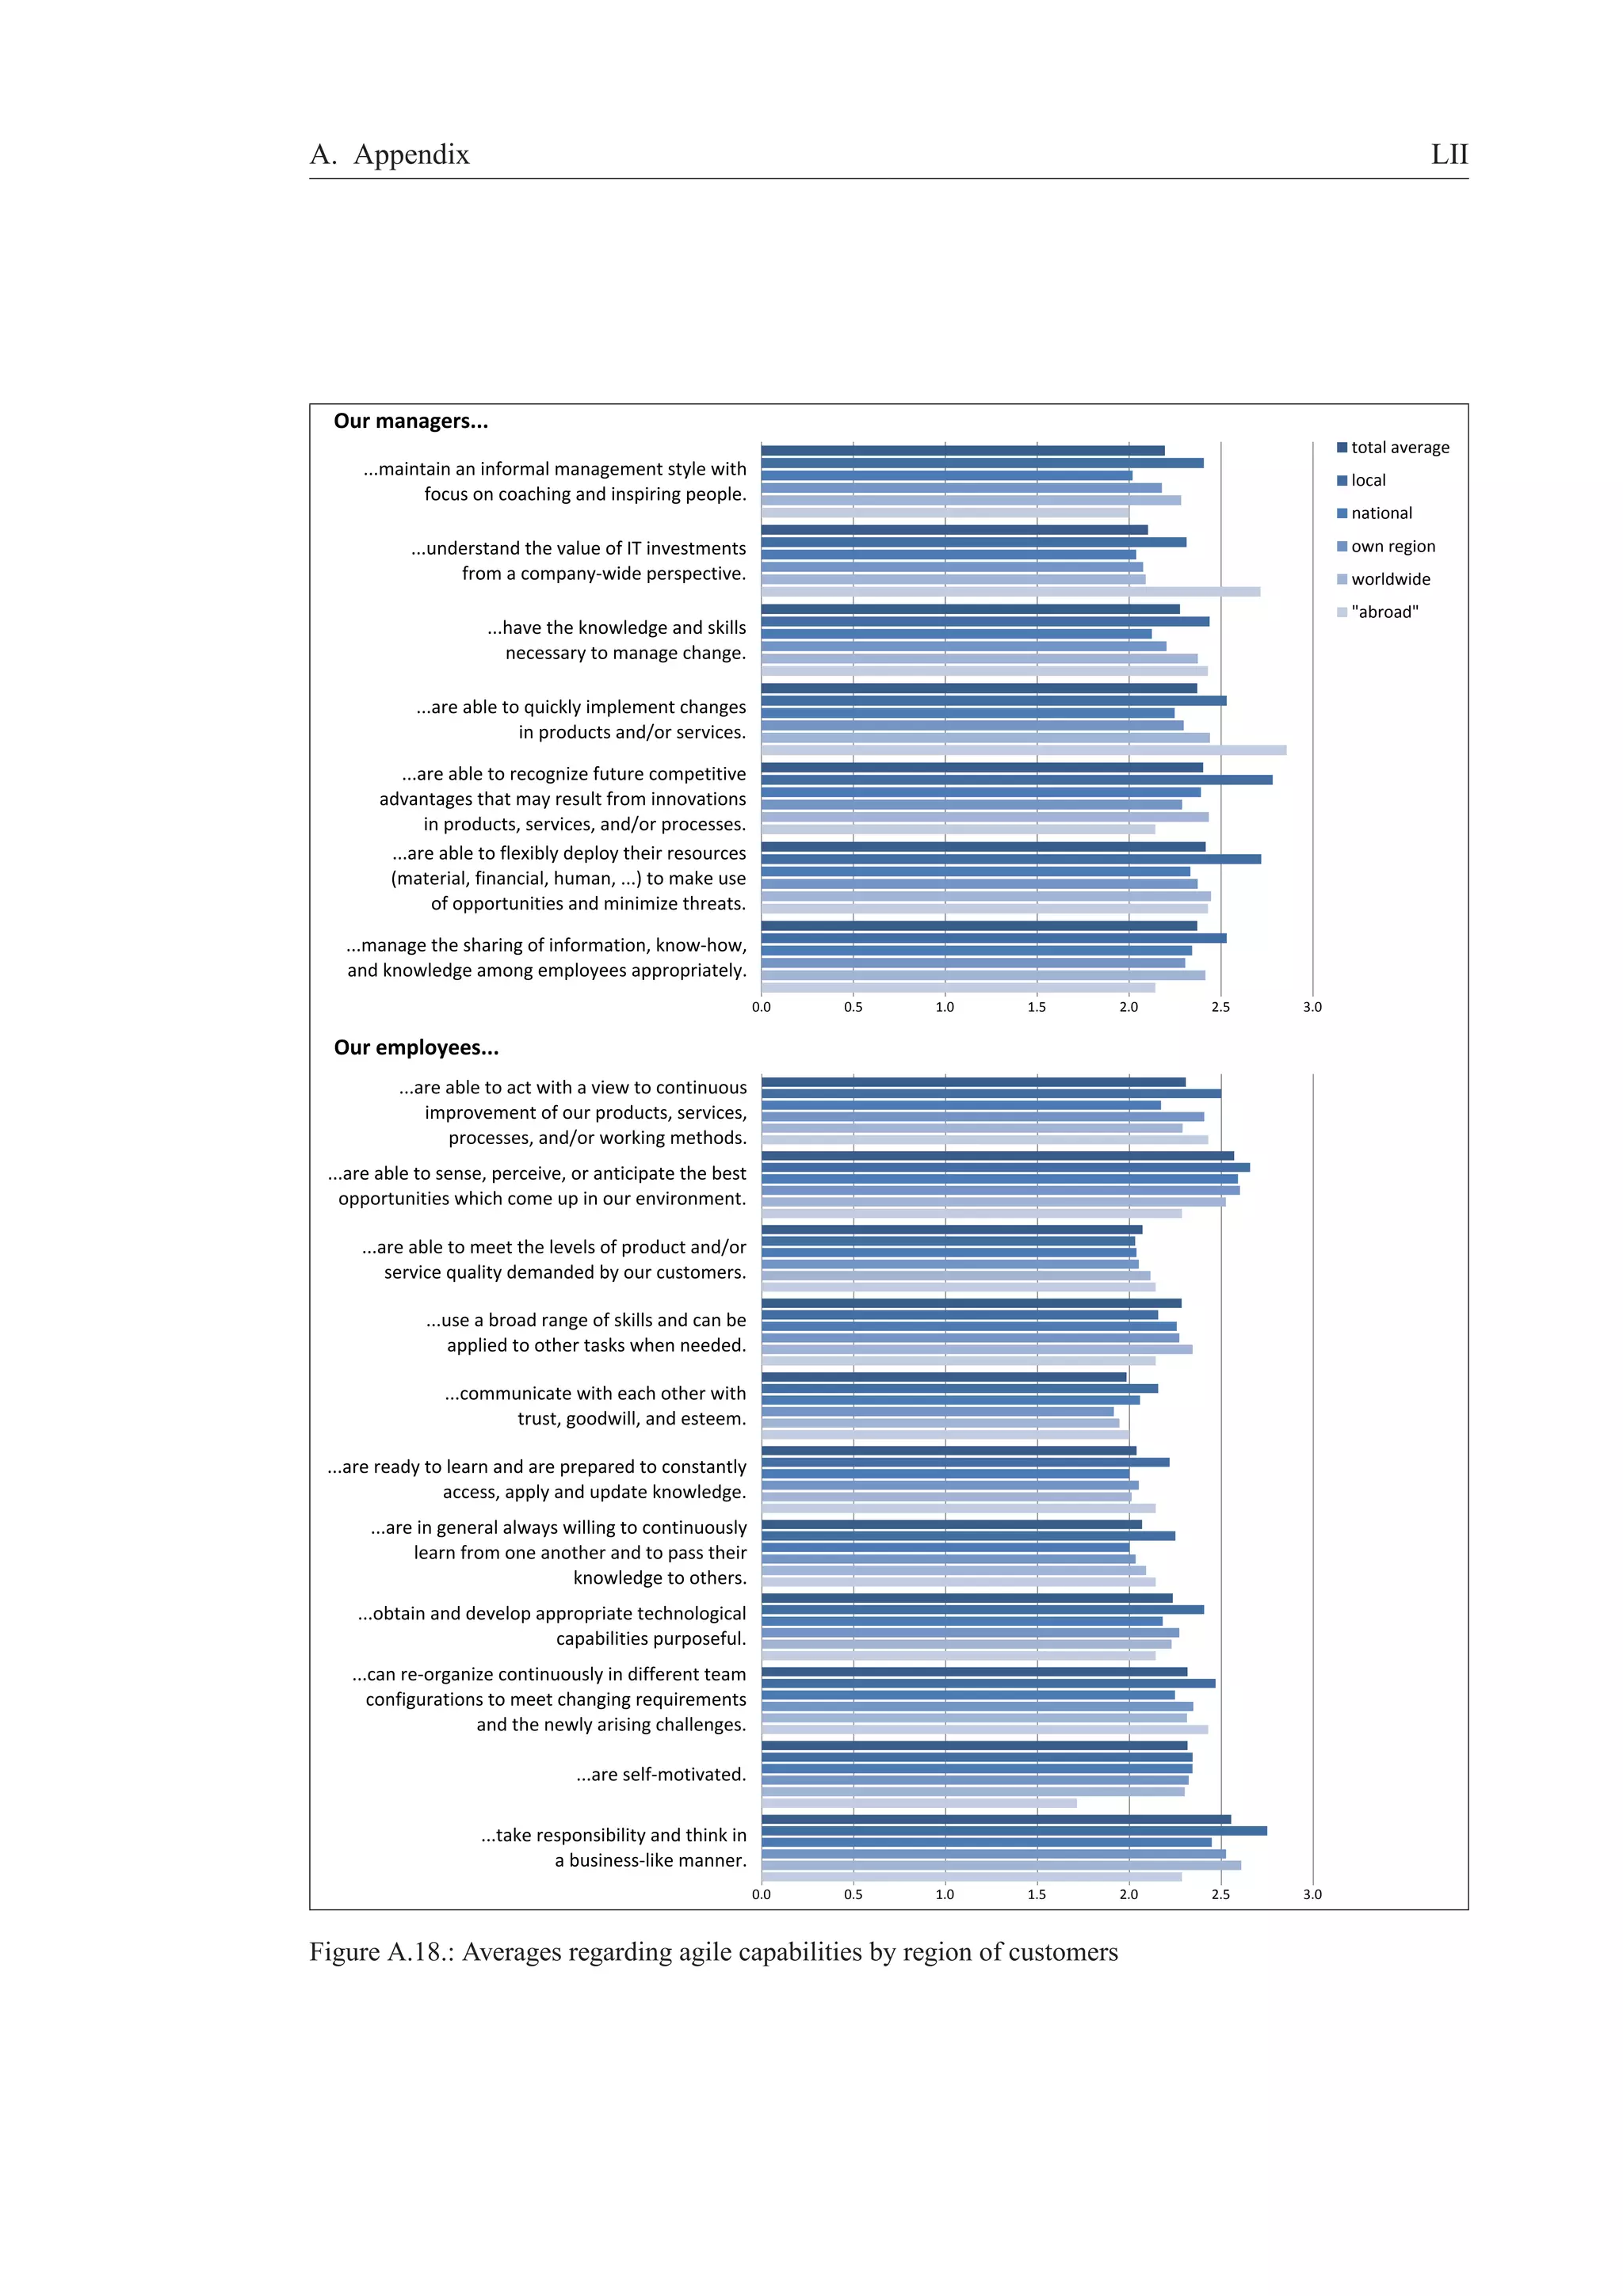
Our managers. . .
. . . maintain an informal management style with focus on coaching and inspiring people.
. . . understand the value of IT investments from a company-wide perspective.
. . . have the knowledge and skills necessary to manage change.
. . . are able to quickly implement changes in products and/or services.
. . . are able to recognize future competitive advantages that may result from innovations in products, ser-vices,
and/or processes.
. . . are able to flexibly deploy their resources (material, financial, human, . . . ) to make use of opportunities
and minimize threats.
. . . manage the sharing of information, know-how, and knowledge among employees appropriately.
Our employees. . .
. . . are able to act with a view to continuous improvement of our products, services, processes, and/or
working methods.
. . . are able to sense, perceive, or anticipate the best opportunities which come up in our environment.
. . . are able to meet the levels of product and/or service quality demanded by our customers.
. . . use a broad range of skills and can be applied to other tasks when needed.
. . . communicate with each other with trust, goodwill, and esteem.
. . . are ready to learn and are prepared to constantly access, apply and update knowledge.
. . . are in general always willing to continuously learn from one another and to pass their knowledge to
others.
. . . obtain and develop appropriate technological capabilities purposeful.
. . . can re-organize continuously in different team configurations to meet changing requirements and the
newly arising challenges.
. . . are self-motivated.
. . . take responsibility and think in a business-like manner.
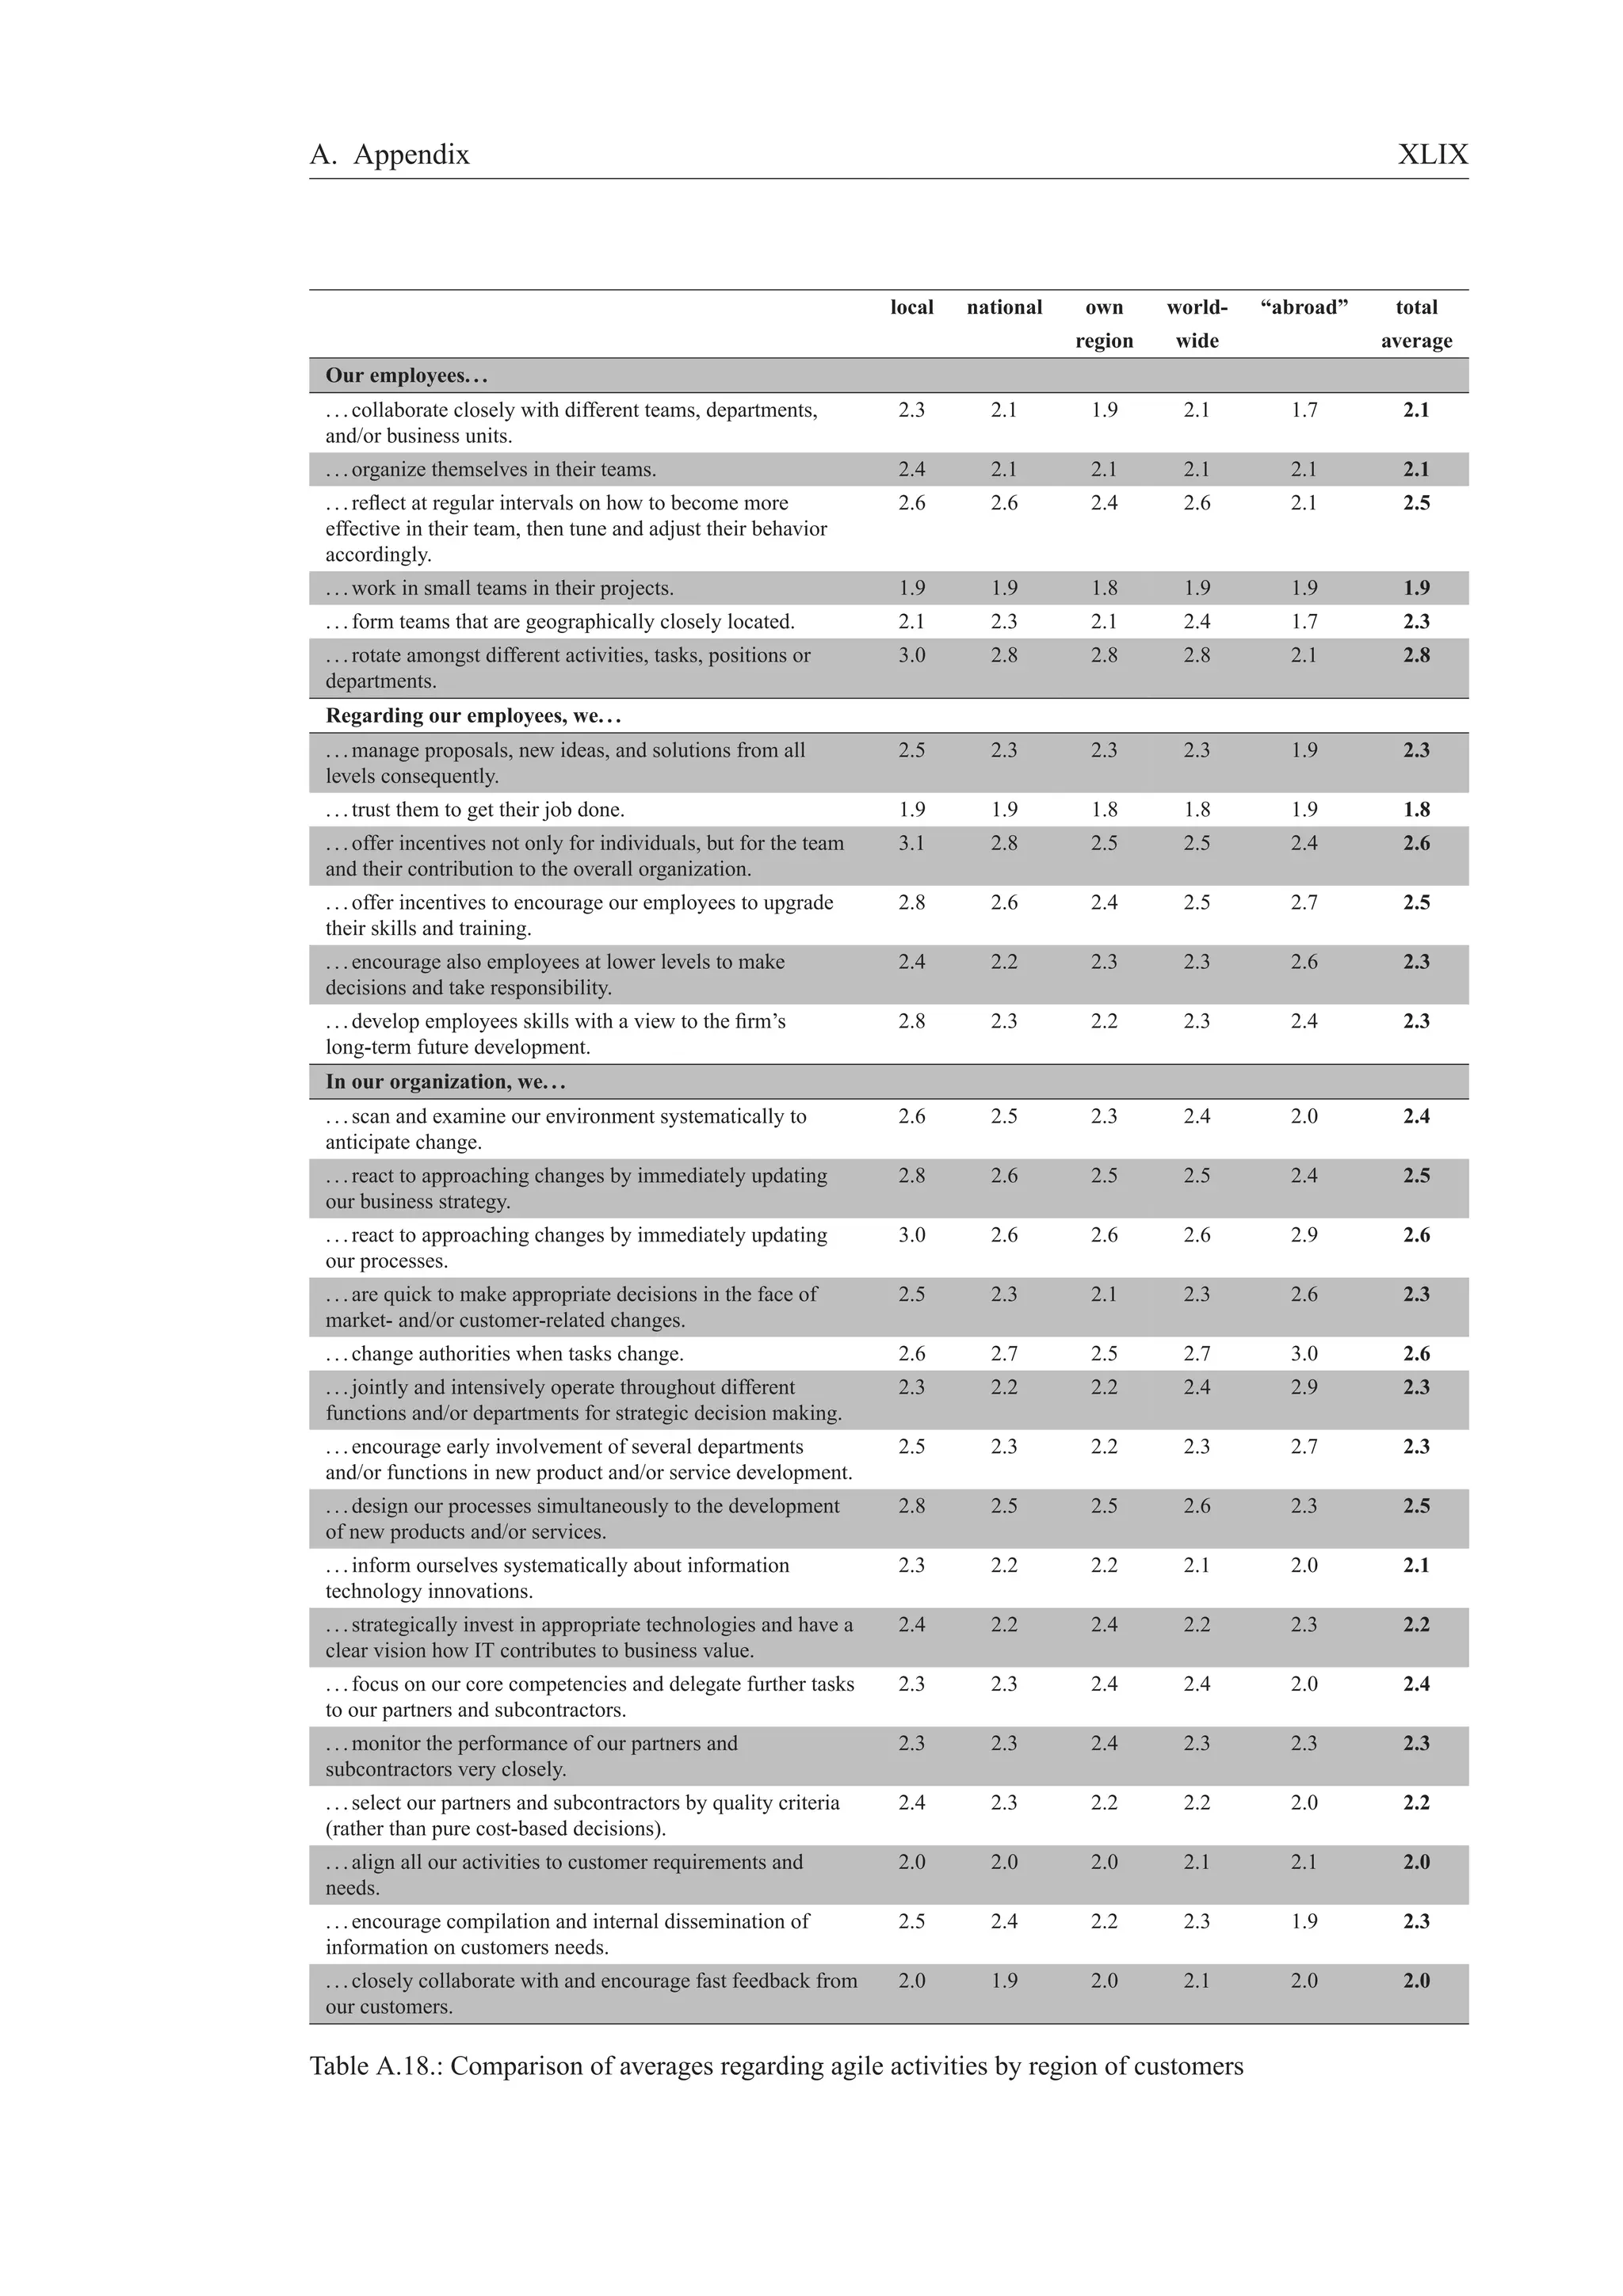
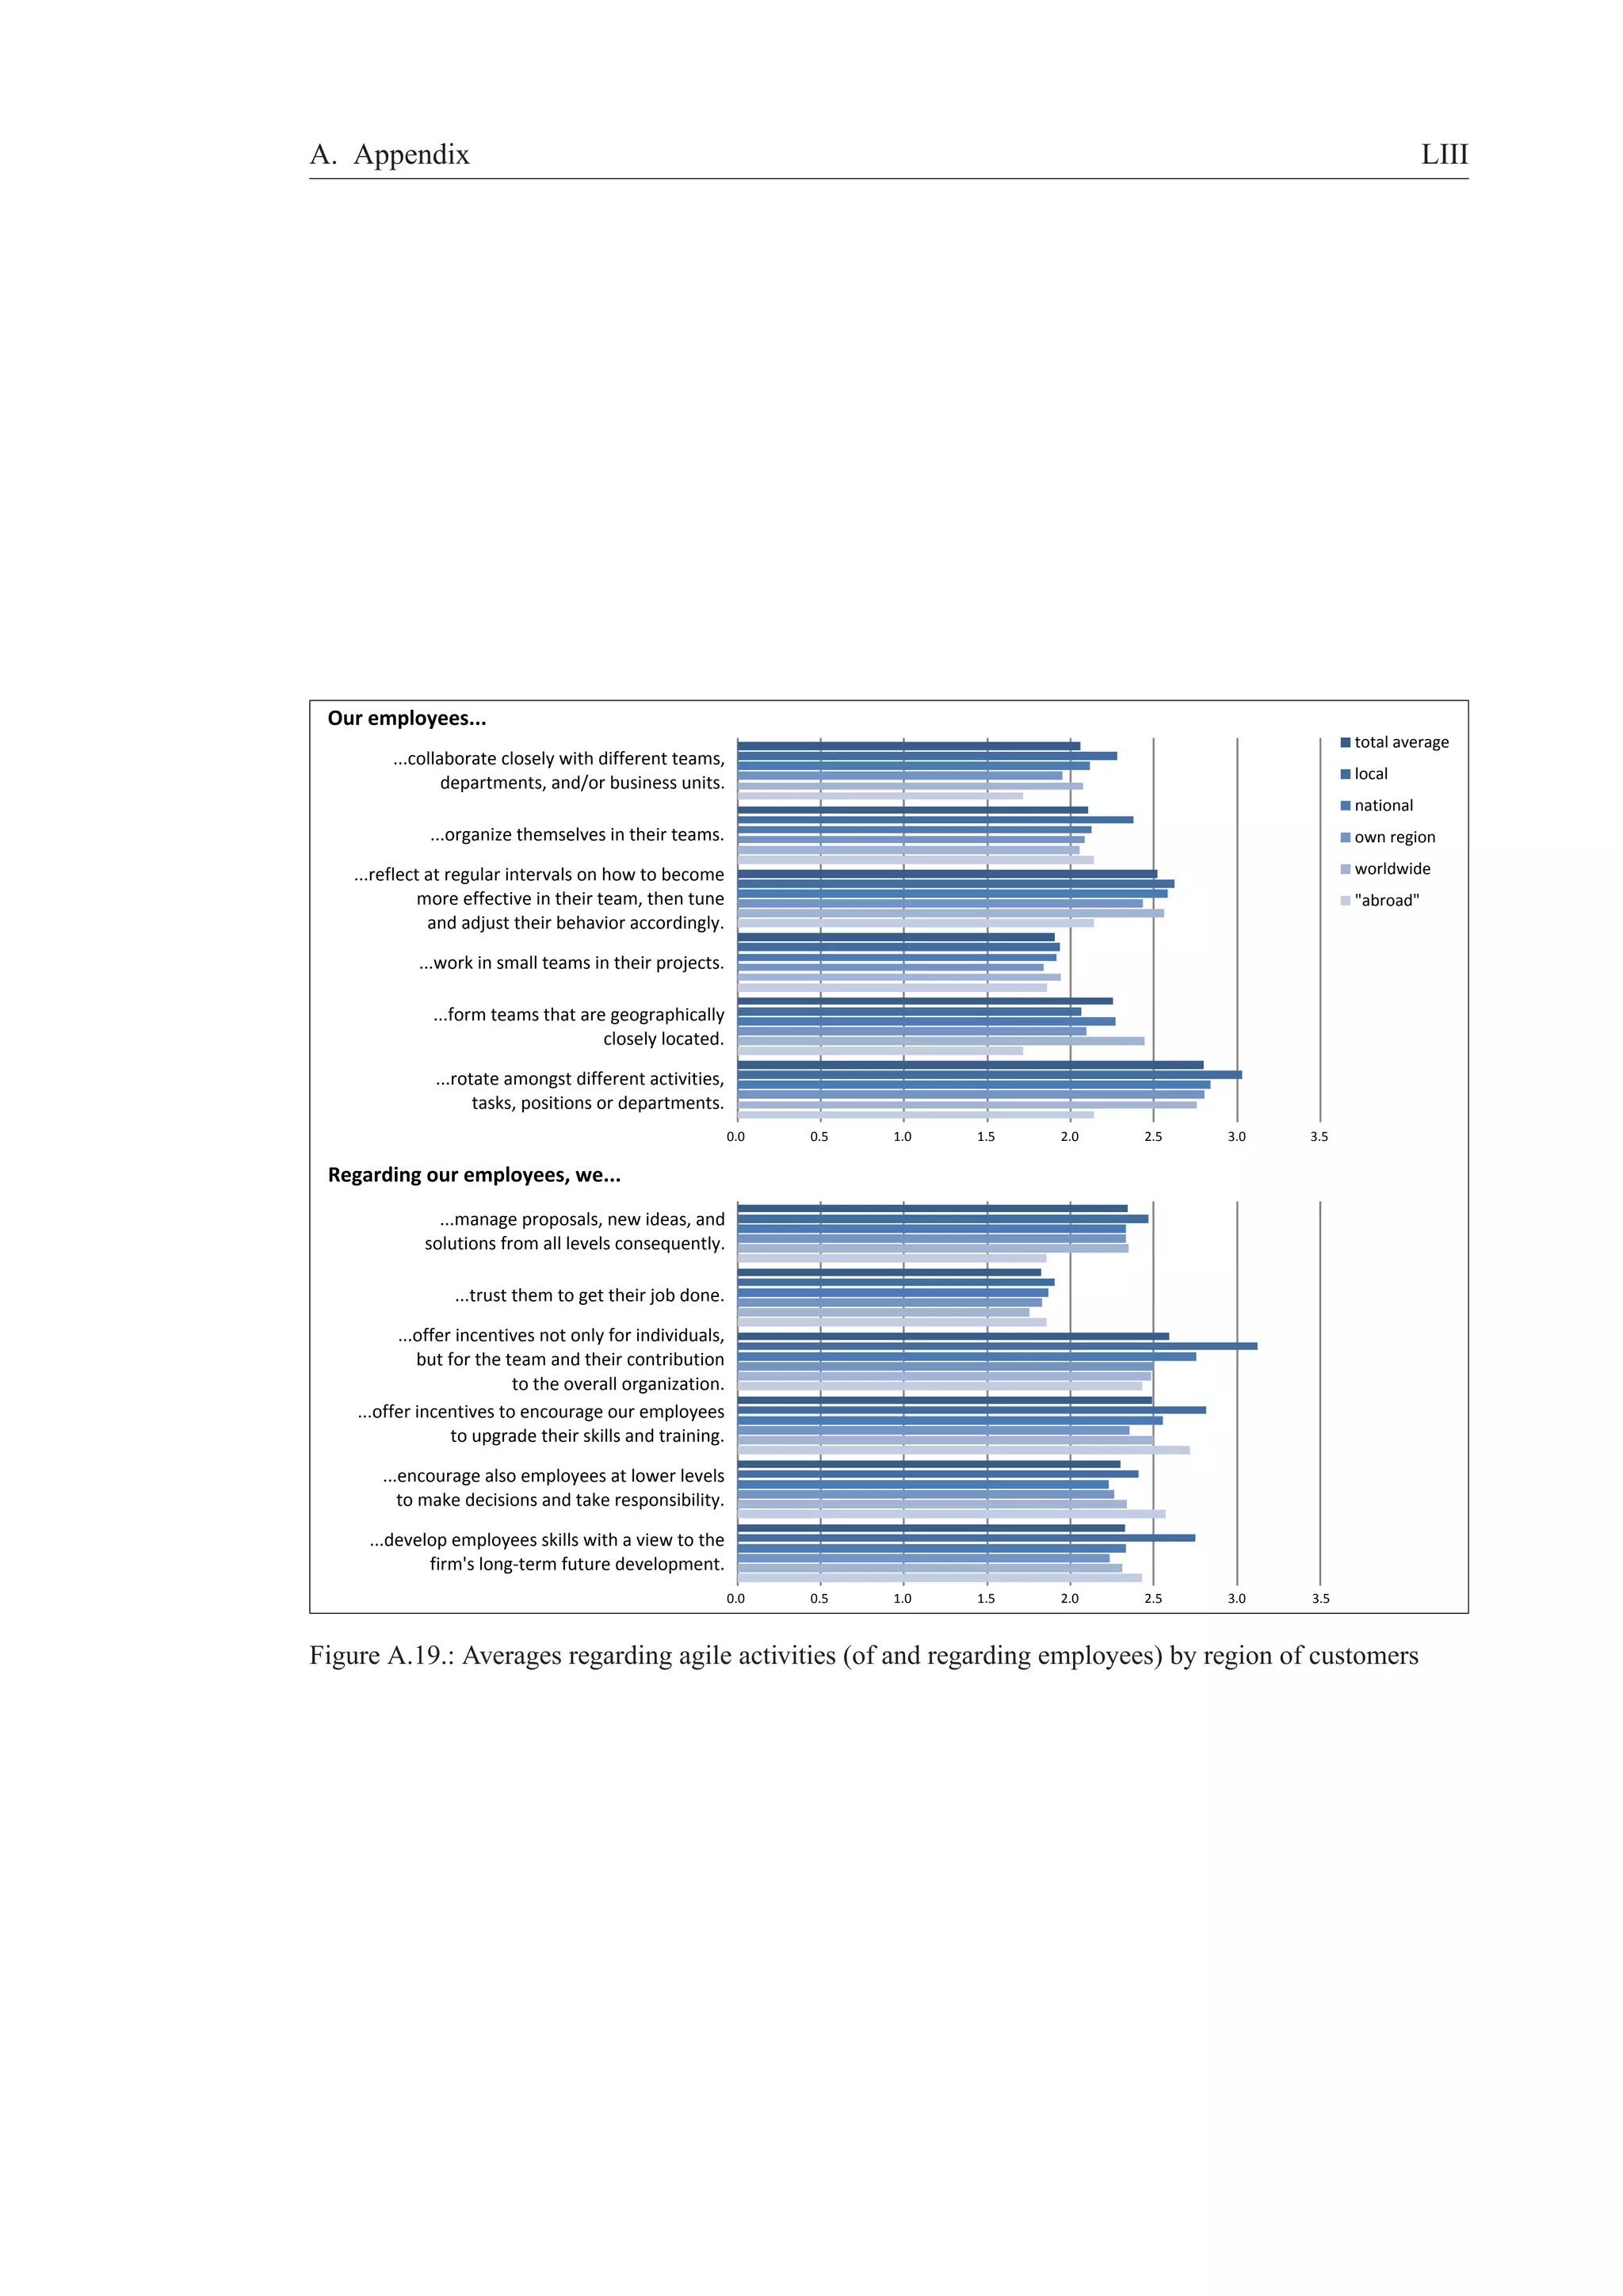
Activities – Employees
Please specify how often your employees carry out the following activities. [Scale: always–often–some-times–
seldom–never]
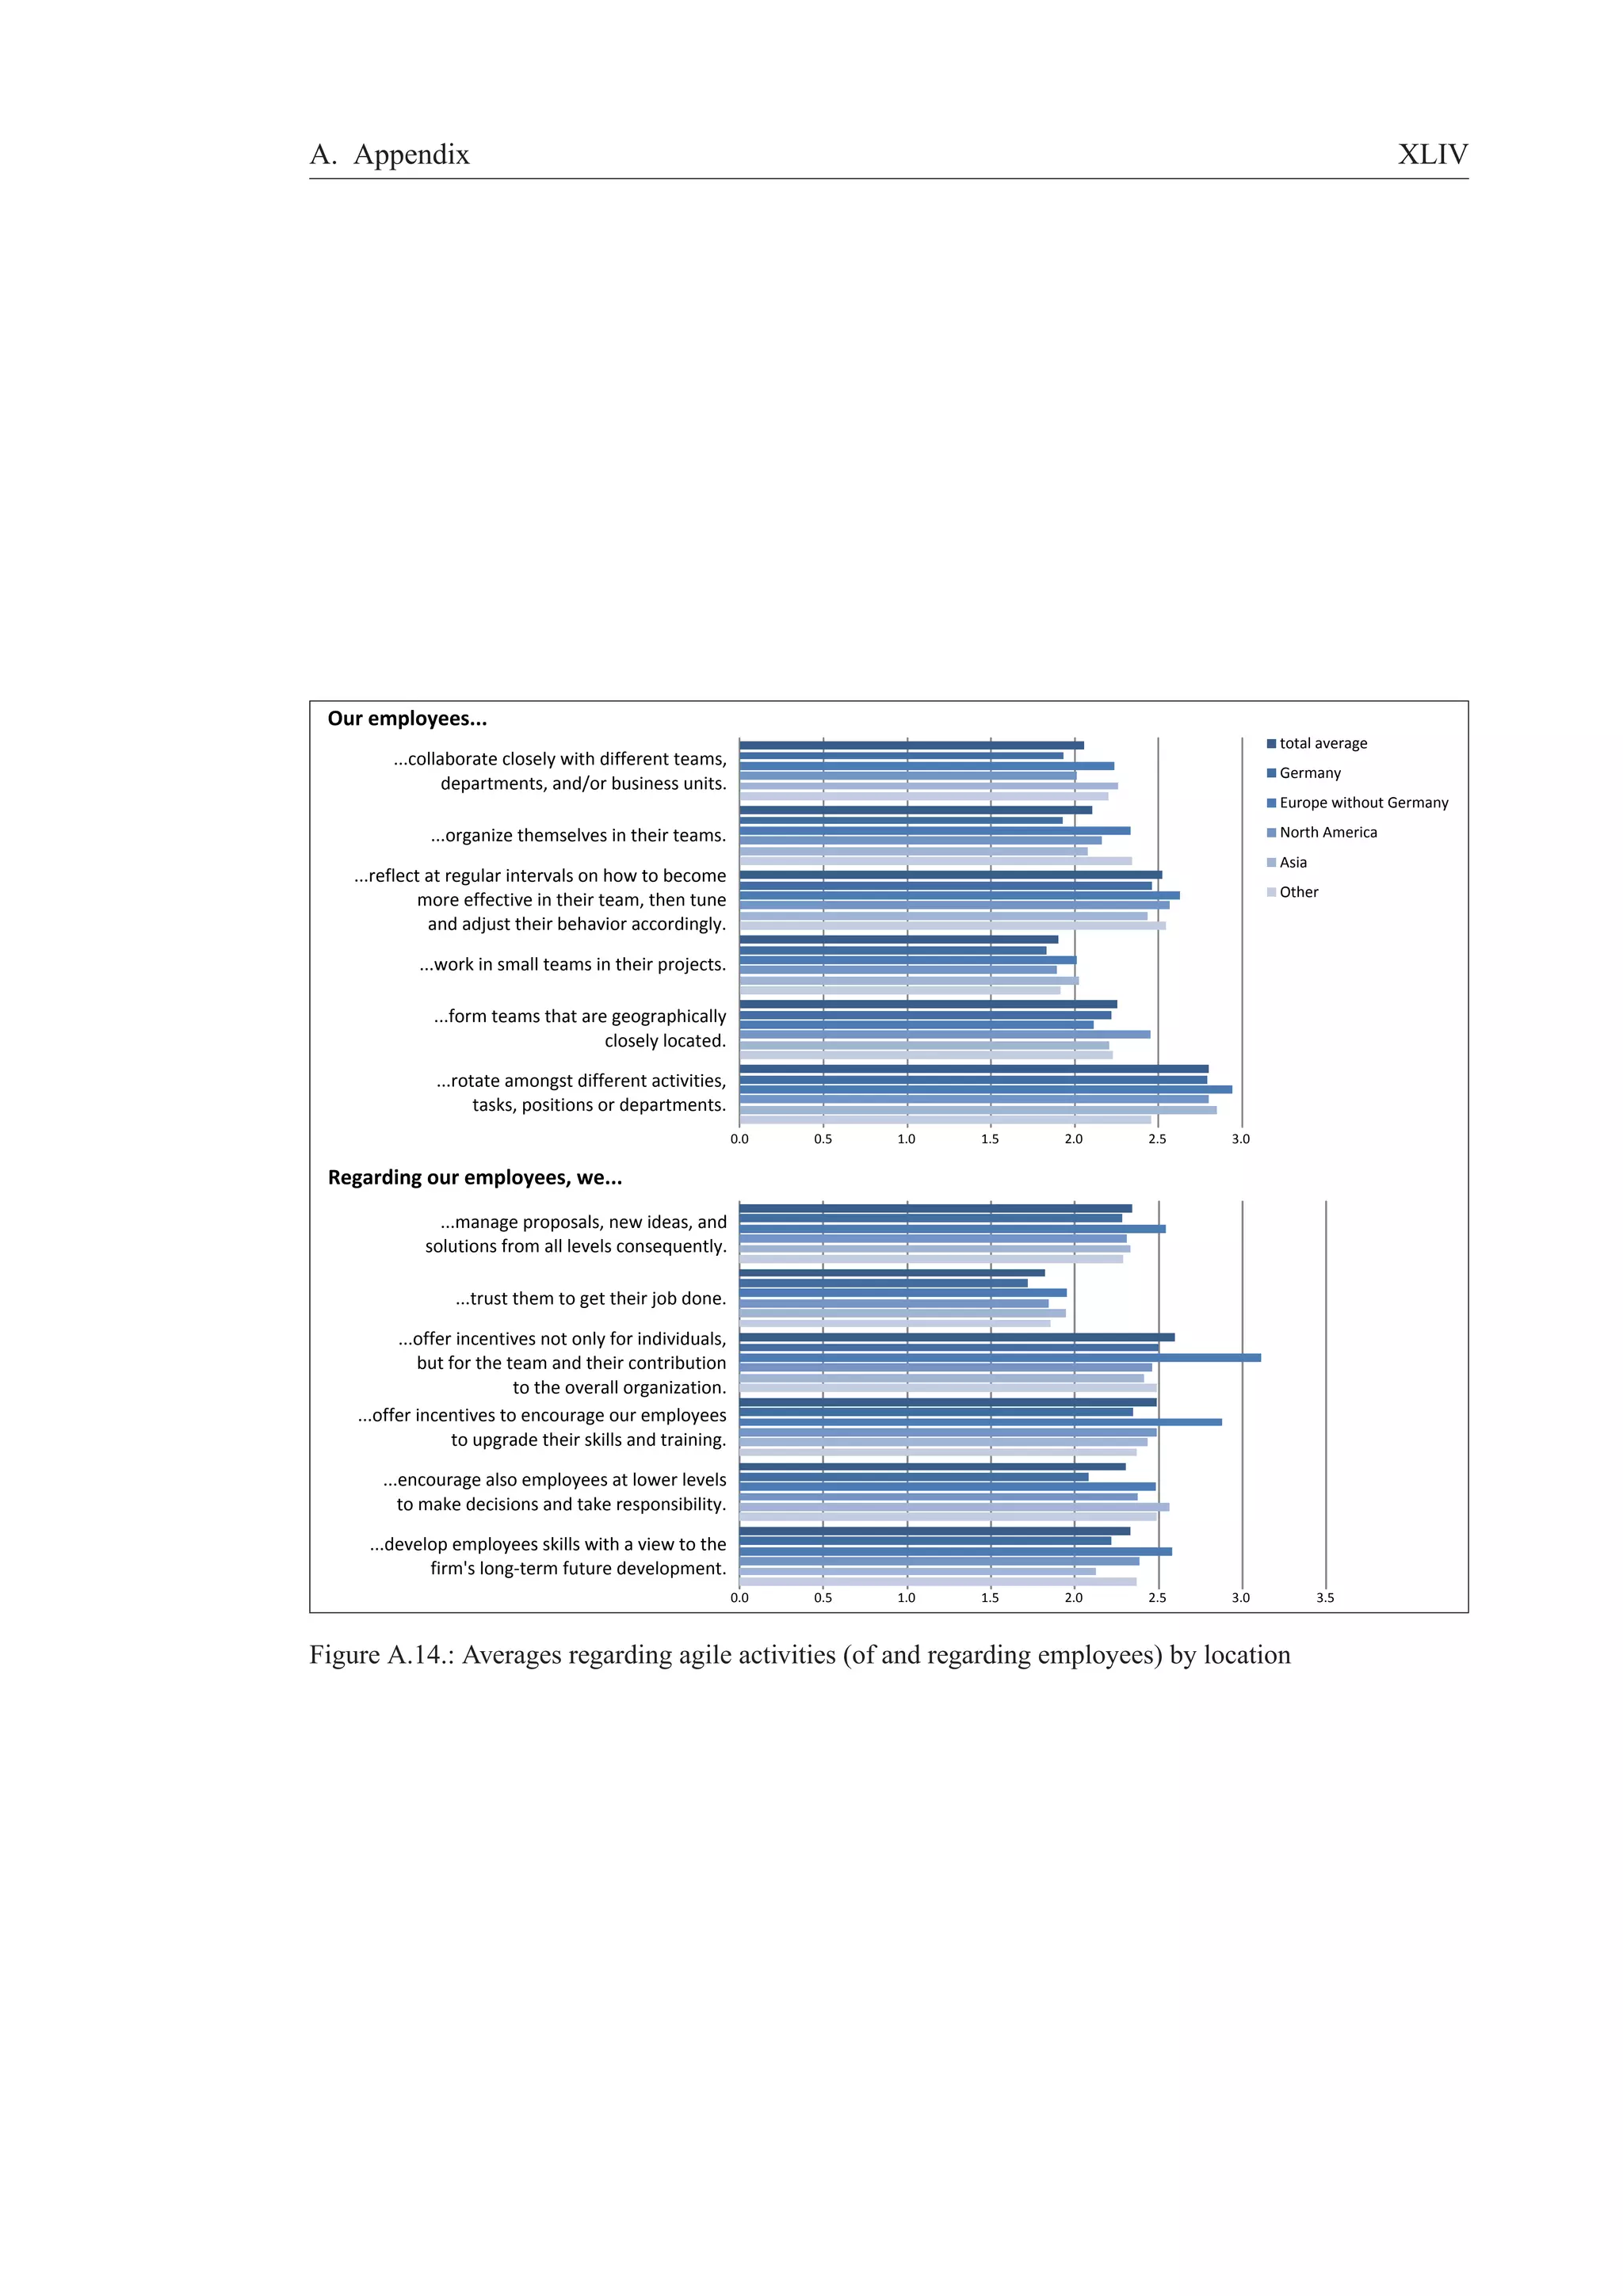
Our employees. . .
. . . collaborate closely with different teams, departments, and/or business units.
. . . organize themselves in their teams.
. . . reflect at regular intervals on how to become more effective in their team, then tune and adjust their
behavior accordingly.
. . . work in small teams in their projects.
. . . form teams that are geographically closely located.
. . . rotate amongst different activities, tasks, positions or departments.](https://image.slidesharecdn.com/gelbe-reiheagility-survey-140826135420-phpapp02/75/WHAT-CONSTITUTES-AN-AGILE-ORGANIZATION-DESCRIPTIVE-RESULTS-OF-AN-EMPIRICAL-INVESTIGATION-47-2048.jpg)
![A. Appendix XI
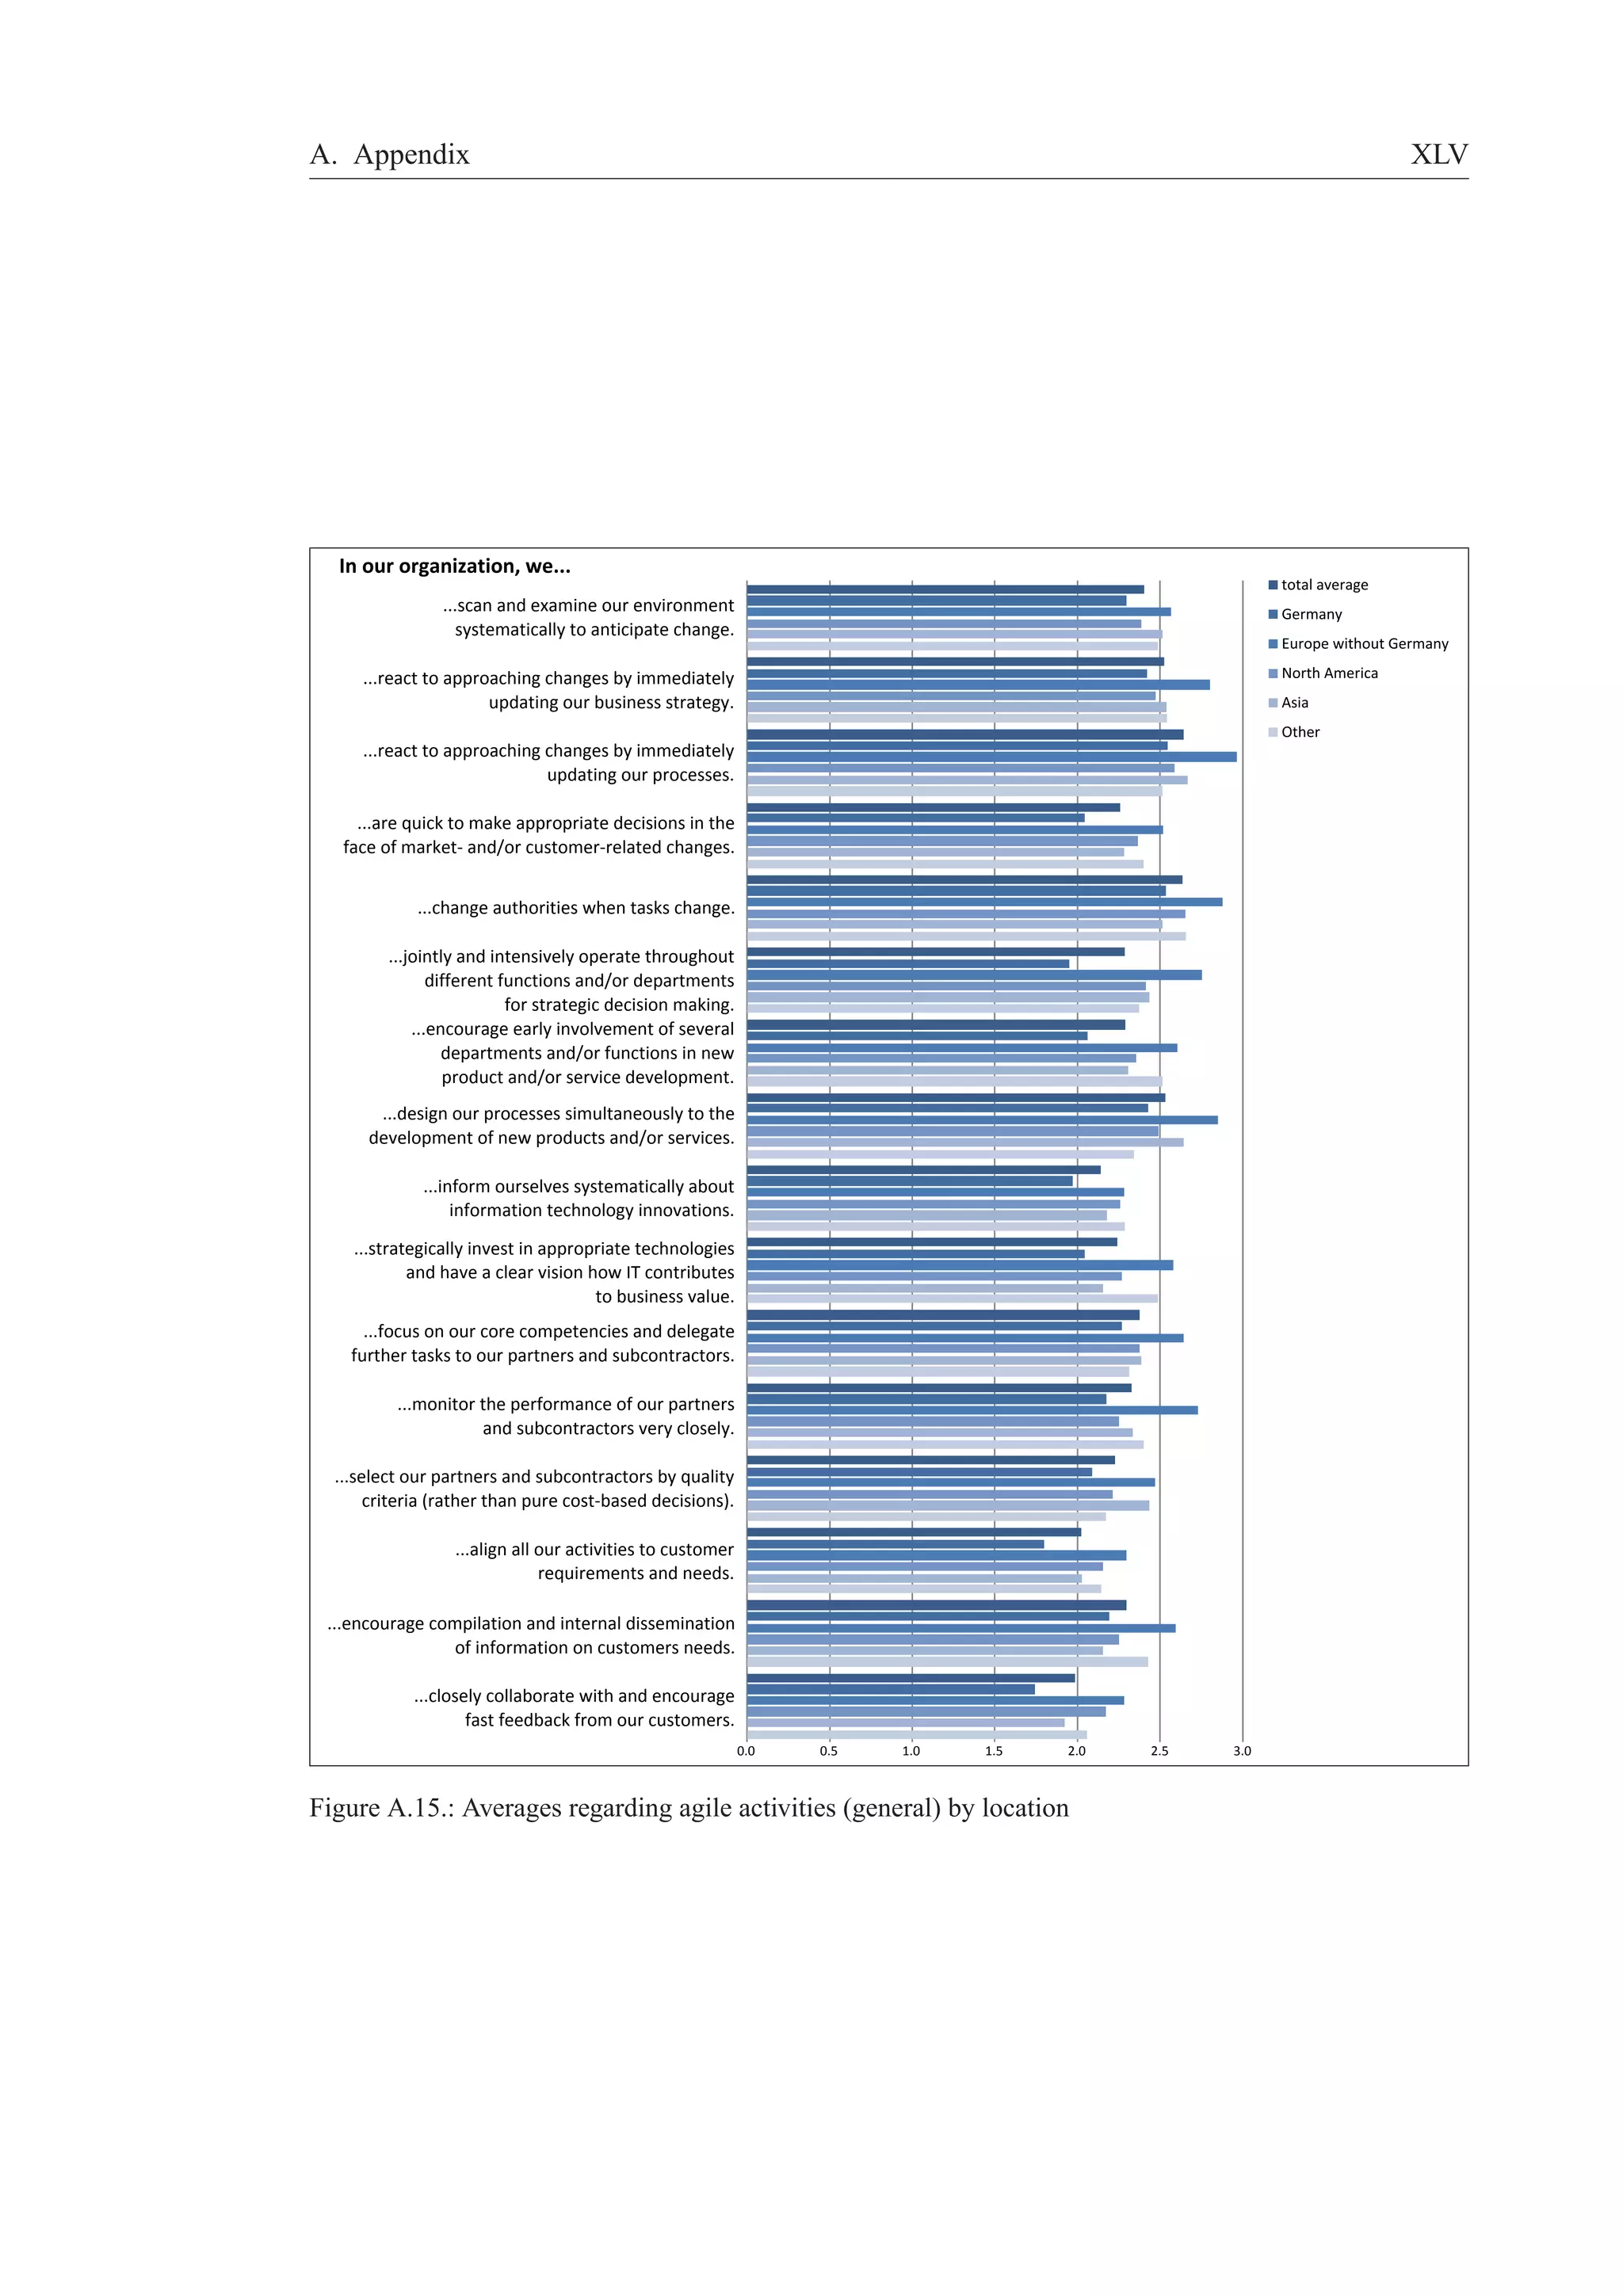
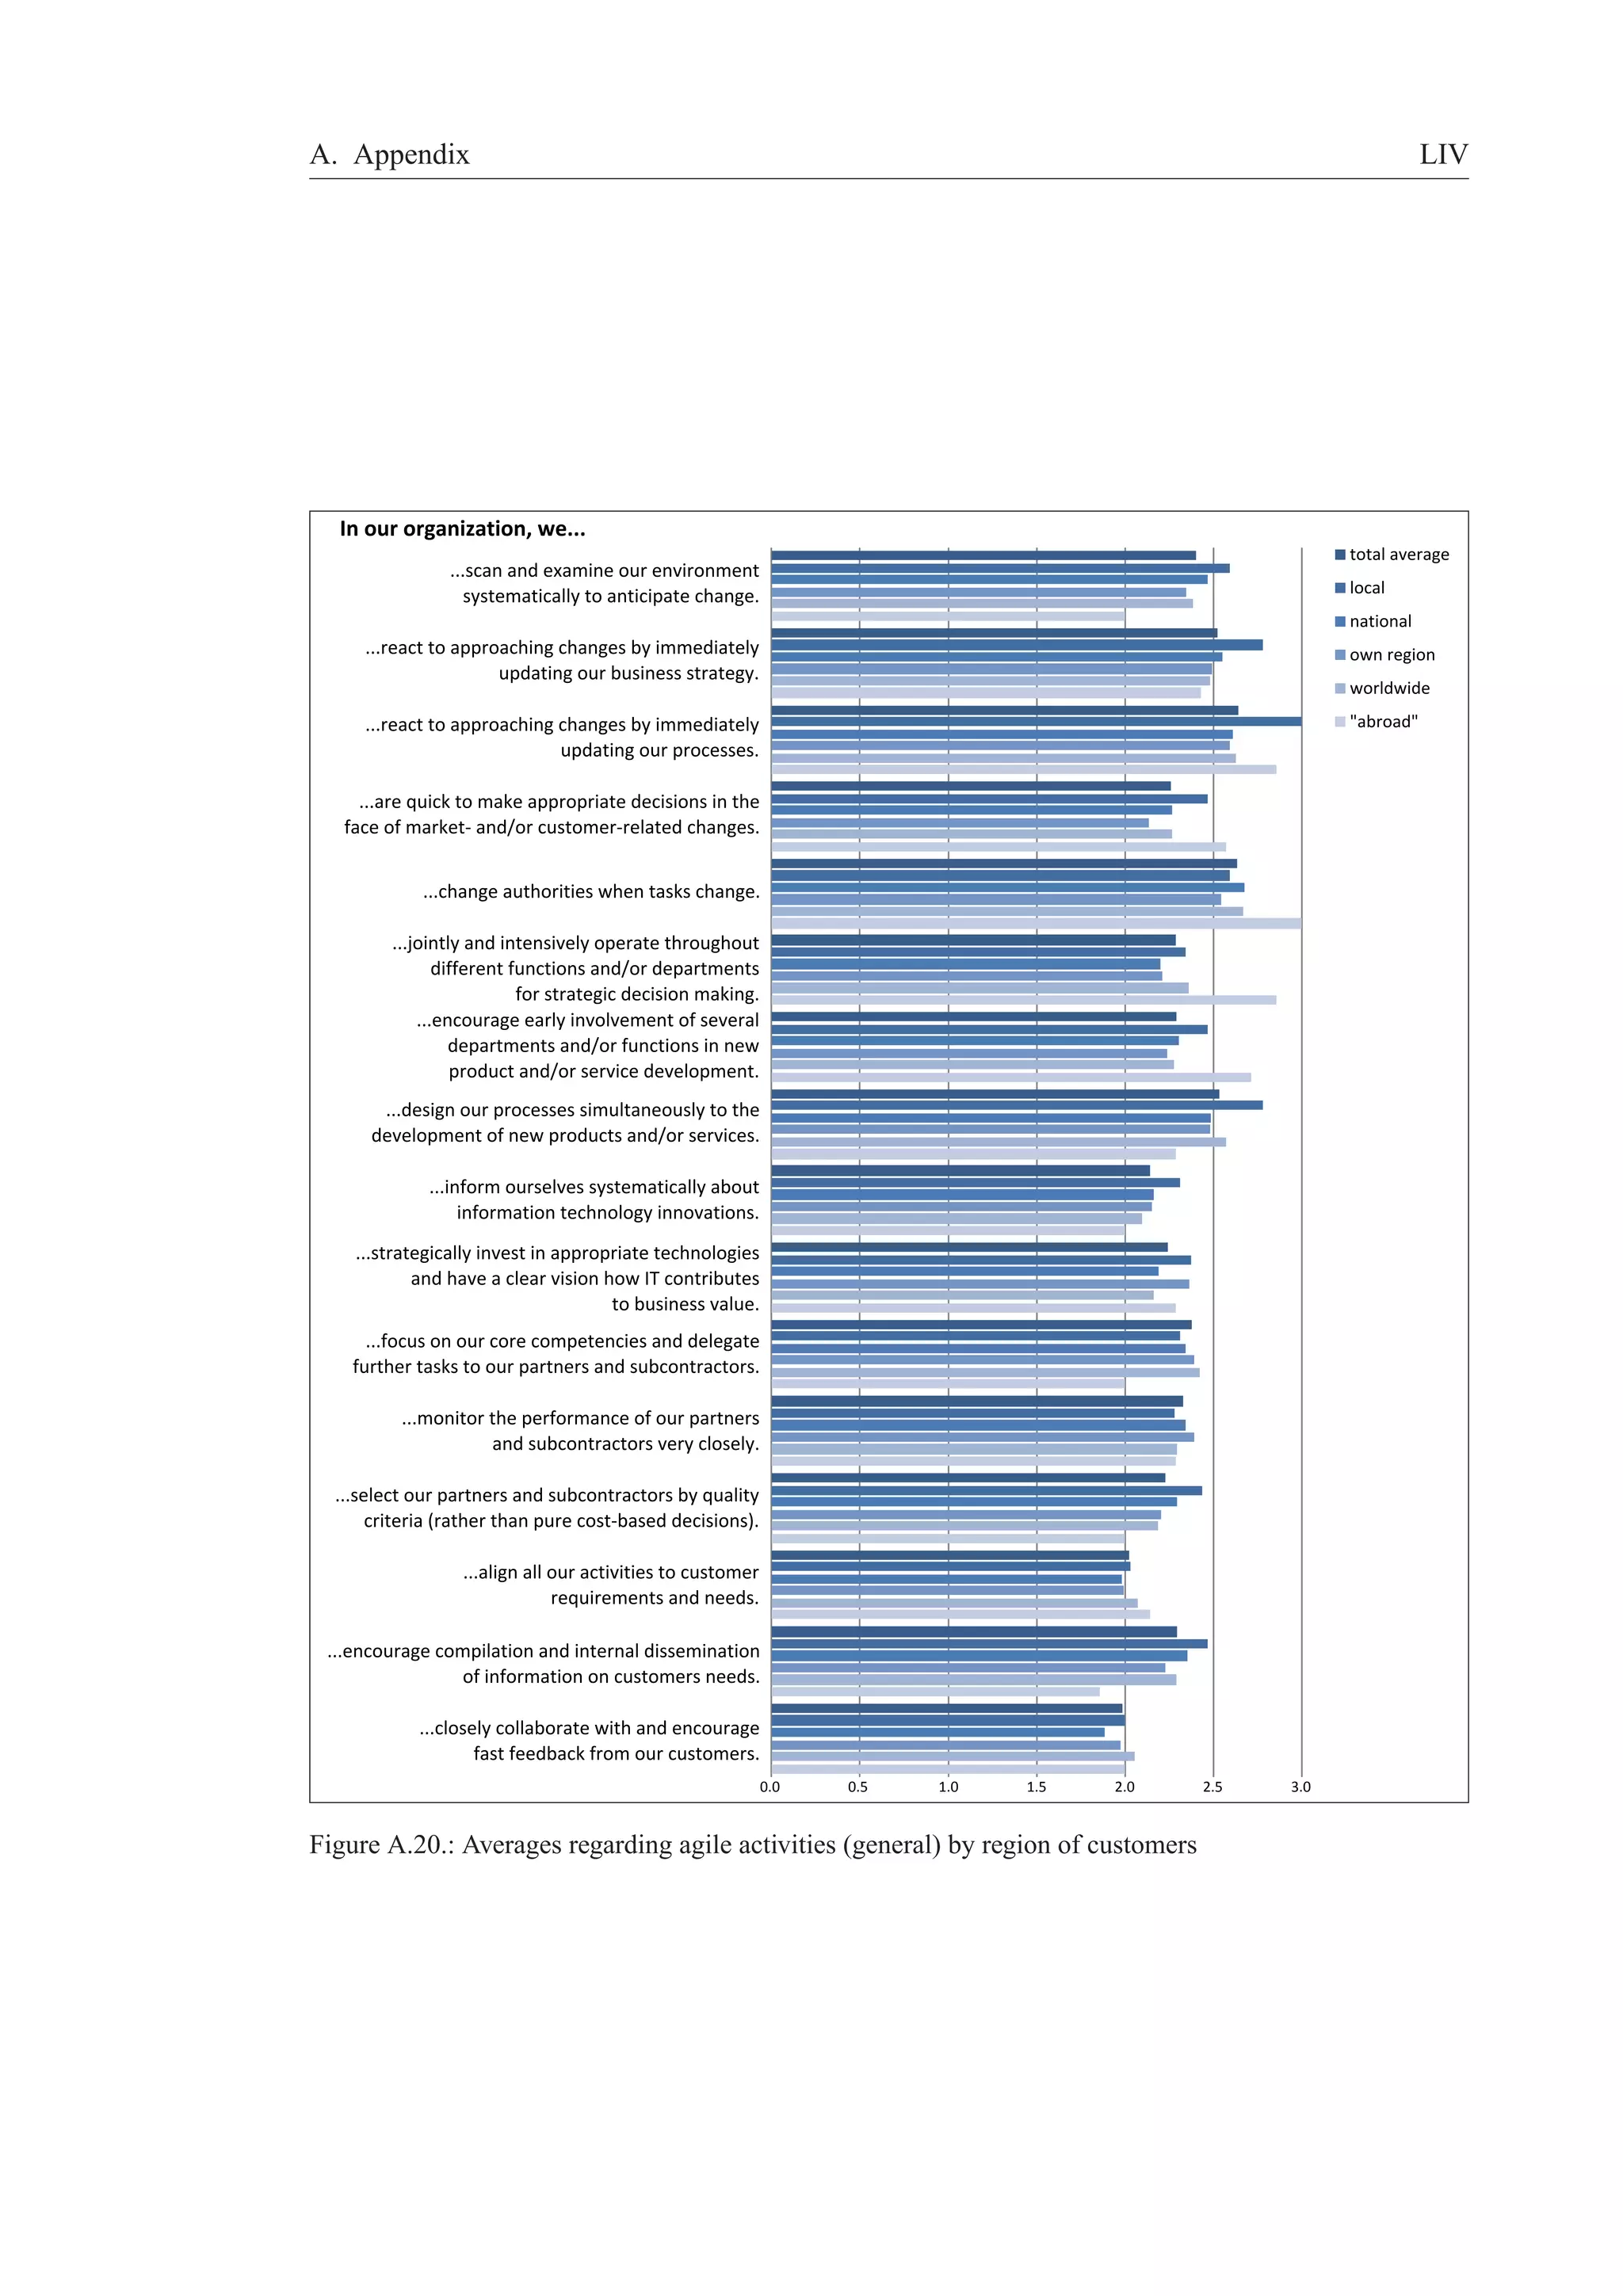
Activities – Organization in general
Please specify how often your organization carries out the following activities. [Scale: always–often–
sometimes–seldom–never]
Regarding our employees, we. . .
. . . manage proposals, new ideas, and solutions from all levels consequently.
. . . trust them to get their job done.
. . . offer incentives not only for individuals, but for the team and their contribution to the overall organiza-tion.
. . . offer incentives to encourage our employees to upgrade their skills and training.
. . . encourage also employees at lower levels to make decisions and take responsibility.
. . . develop employees skills with a view to the firm’s long-term future development.
In our organization, we. . .
. . . scan and examine our environment systematically to anticipate change.
. . . react to approaching changes by immediately updating our business strategy.
. . . react to approaching changes by immediately updating our processes.
. . . are quick to make appropriate decisions in the face of market- and/or customer-related changes.
. . . change authorities when tasks change.
. . . jointly and intensively operate throughout different functions and/or departments for strategic decision
making.
. . . encourage early involvement of several departments and/or functions in new product and/or service
development.
. . . design our processes simultaneously to the development of new products and/or services.
. . . inform ourselves systematically about information technology innovations.
. . . strategically invest in appropriate technologies and have a clear vision how IT contributes to business
value.
. . . focus on our core competencies and delegate further tasks to our partners and subcontractors.
. . . monitor the performance of our partners and subcontractors very closely.
. . . select our partners and subcontractors by quality criteria (rather than pure cost-based decisions).
. . . align all our activities to customer requirements and needs.
. . . encourage compilation and internal dissemination of information on customers needs.
. . . closely collaborate with and encourage fast feedback from our customers.
Other
Does your organization share additional activities, capabilities, values, etc. that make you more agile than
others? If so, you may specify them here, if you wish. [Text Field]
A.2.2. German Version
Allgemeine Informationen
Was sind die Hauptt¨atigkeitsbereiche Ihres Unternehmens? [Mehrfachantworten m¨oglich]](https://image.slidesharecdn.com/gelbe-reiheagility-survey-140826135420-phpapp02/75/WHAT-CONSTITUTES-AN-AGILE-ORGANIZATION-DESCRIPTIVE-RESULTS-OF-AN-EMPIRICAL-INVESTIGATION-48-2048.jpg)
![A. Appendix XII
• Programmierung und Softwareentwicklung
• IT-Dienstleistungen und Beratung
• DV-Anlagenwartung und -betrieb
• andere: [Textfeld]
Was ist Ihre Rolle im Unternehmen?
• Gesch¨aftsf¨uhrer (CEO)
• IT-Vorstand (CIO)
• Finanzvorstand (CFO)
• IT Manager, IKT Manager oder vergleichbar
• Unternehmensarchitekt, IT Architekt oder vergleichbar
• andere: [Textfeld]
Wo ist der Sitz Ihres Unternehmens (sollten Sie Niederlassungen in mehreren L¨andern haben, beziehen Sie
sich bitte auf den Hauptsitz)?
• Deutschland
• USA
• anderes: [Textfeld]
In welcher Region befinden sich Ihre Kunden? [Mehrfachantworten m¨oglich]
• regional
• national
• Europa
• Nordamerika
• Lateinamerika / Karibik
• Asien / Pazifik
• Afrika
• keine Antwort
Wie groß ist die ungef¨ahre Anzahl von Mitarbeitern in Ihrem Unternehmen?
• weniger als 10
• 10 bis 49
• 50 bis 249
• 250 bis 500
• mehr als 500
• keine Antwort
Werte und Prinzipien – Unternehmen
Bitte geben Sie an, in welchem Ausmaß die folgenden Aussagen die Werte und Prinzipien Ihres Unterneh-mens
widerspiegeln. [Skala: v¨ollig–¨uberwiegend–teilweise–wenig–gar nicht]
Unser Unternehmen sch¨atzt eine Unternehmenskultur, welche. . .
. . . Ver¨anderungen f¨ur Wettbewerbsvorteilen nutzbar macht.
. . . Teamarbeit als zentralen Bestandteil betrachtet.](https://image.slidesharecdn.com/gelbe-reiheagility-survey-140826135420-phpapp02/75/WHAT-CONSTITUTES-AN-AGILE-ORGANIZATION-DESCRIPTIVE-RESULTS-OF-AN-EMPIRICAL-INVESTIGATION-49-2048.jpg)
![A. Appendix XIII
. . . die Entscheidungen und Vorschl¨age von Mitarbeitern akzeptiert und unterst¨utzt.
. . . Experimentieren erlaubt und die Nutzung innovativer Ideen f¨ordert.
. . . Ver¨anderungen von Kundenanforderungen als Chancen betrachtet.
Unser Unternehmen bevorzugt. . .
. . . proaktive und kontinuierliche Verbesserung anstatt Krisenmanagement und “Brandbek¨ampfung”.
. . . die Eliminierung von Barrieren zwischen Individuen und/oder Abteilungen, z. B. durch flache Hierar-chien
oder einfache Strukturen.
. . . Kommunikation von Angesicht zu Angesicht zur Informationsweitergabe innerhalb des Unternehmens.
. . . Einfachheit, d. h. den Verzicht auf Merkmale bei Produkten und/oder Dienstleistungen, welche die
Kundenanforderungen ¨ubersteigen.
. . . ein sich ¨anderndes Marktumfeld (z.B. Wettbewerber, Pr¨aferenzen) zur Generierung neuer Chancen.
Bedingungen – Unternehmen
Bitte geben Sie an, in welchem Ausmaß die folgenden Gegebenheiten in Ihrem Unternehmen ausgepr¨agt
sind. [Skala: v¨ollig–¨uberwiegend–teilweise–wenig–gar nicht]
Unser Unternehmen hat. . .
. . . effektive Kommunikationsprozesse, sowohl “top-down” als auch “bottom-up”.
. . . ein gut ausgepr¨agtes Weiterbildungsprogramm f¨ur Mitarbeiter.
. . . Mitarbeiter, welche verstehen, wie ihre eigene Arbeit mit den Aktivit¨aten des Unternehmens zusam-menh
¨angt.
. . . eine Strategie, welche klar und leicht verst¨andlich ¨uber alle Hierarchieebenen kommuniziert wird.
. . . eine strategische Vision, die Spielraum f¨ur Markt¨anderungen von Anfang an ber¨ucksichtigt.
Unser Unternehmen besitzt Informationssysteme und Technologien, welche. . .
. . . unternehmensbezogene Informationen allen Mitarbeitern leicht zug¨anglich machen.
. . . Informationen zur Verf¨ugung stellen, welche unseren Mitarbeitern helfen, schnell auf Ver¨anderungen
zu reagieren.
. . . entsprechend unseren Bed¨urfnissen ausgestaltet sind und uns erlauben wettbewerbs- und ¨uberlebensf¨a-hig
zu bleiben.
. . . die Dezentralisierung von Entscheidungen erm¨oglichen.
. . . ¨uber verschiedene Abteilungen und/oder Bereiche des Unternehmens hinweg integriert sind.
. . . ¨uber verschiedene Abteilungen und/oder Bereiche des Unternehmens hinweg standardisiert oder ver-gleichbar
sind.
. . . uns die vollst¨andige Einbindung von Kunden und Partnern in unsere Prozesse erm¨oglichen.
F¨ahigkeiten – Mitarbeiter und Manager
Bitte geben Sie an, wie groß der Anteil Ihrer Mitarbeiter und Manager mit den folgenden F¨ahigkeiten ist.
[Skala: alle–viele–einige–wenige–keine]
Unsere Manager. . .
. . . pflegen einen informellen F¨uhrungsstil, welcher auf Mentoring und Vorbildfunktion beruht.](https://image.slidesharecdn.com/gelbe-reiheagility-survey-140826135420-phpapp02/75/WHAT-CONSTITUTES-AN-AGILE-ORGANIZATION-DESCRIPTIVE-RESULTS-OF-AN-EMPIRICAL-INVESTIGATION-50-2048.jpg)
![A. Appendix XIV
. . . verstehen den Wert von Investitionen in IT aus einer gesamtunternehmerischen Sicht.
. . . haben das Wissen und die F¨ahigkeiten, um Ver¨anderungen zu steuern.
. . . sind in der Lage, ¨Anderungen in Produkten und / oder Dienstleistungen schnell zu implementieren.
. . . erkennen zuk¨unftige Wettbewerbsvorteile, die sich aus innovativen Produkten, Dienstleistungen und /
oder Prozessen ergeben k¨onnen.
. . . k¨onnen ihre Ressourcen (Materialien, Finanzen, Mitarbeiter, . . . ) flexibel verteilen, um aufkommende
Chancen zu nutzen und Risiken zu minimieren.
. . . koordinieren die Verteilung von Informationen,Wissen und Kenntnissen unter denMitarbeitern zweck-m
¨aßig.
Unsere Mitarbeiter. . .
. . . sind in der Lage, mit einem Sinn f¨ur die kontinuierliche Verbesserung unserer Produkte, Dienstleistun-gen,
Prozesse und/oder Arbeitsmethoden zu agieren.
. . . sind in der Lage, die besten Chancen wahrzunehmen, zu identifizieren oder vorherzusehen, welche sich
in unserem Umfeld ergeben.
. . . sind in der Lage, die von Kunden geforderte Qualit¨at von Produkten und / oder Dienstleistungen zu
erf¨ullen.
. . . besitzen ein breites Spektrum an F¨ahigkeiten und k¨onnen f¨ur andere Aufgaben eingesetzt werden, falls
n¨otig.
. . . kommunizieren mit anderen vertrauensvoll, wohlwollend und wertsch¨atzend.
. . . sind bereit zu Lernen und ihr Wissen stets abzurufen, anzuwenden und weiterzuentwickeln.
. . . sind bereit von Kollegen zu lernen und ihr Wissen an andere weiterzugeben.
. . . erwerben und entwickeln technologische F¨ahigkeiten und Kenntnisse zielgerichtet.
. . . sind in der Lage, sich in verschiedenen Teamumgebungen neu zu organisieren, um ver¨anderten Anfor-derungen
und neuen Herausforderungen zu begegnen.
. . . sind intrinsisch motiviert.
. . . ¨ubernehmen Verantwortung und denken unternehmerisch.
Aktivit ¨aten – Mitarbeiter
Bitte geben Sie an, wie oft die folgenden Aktivit¨aten von Ihren Mitarbeitern ausgef¨uhrt werden. [Skala:
immer–oft–gelegentlich–selten–nie]
Unsere Mitarbeiter. . .
. . . arbeiten eng mit anderen Teams, Abteilungen und/oder Bereichen zusammen.
. . . organisieren sich in ihren Teams selbst¨andig.
. . . reflektieren in regelm¨aßigen Abst¨anden, wie ihr Team effektiver werden kann und passen ihr Verhalten
entsprechend an.
. . . arbeiten in kleinen Teams in ihren Projekten.
. . . bilden Teams, welche geografisch eng beisammen liegen.
. . . rotieren zwischen verschiedenen Aufgaben, T¨atigkeiten, Positionen oder Abteilungen.](https://image.slidesharecdn.com/gelbe-reiheagility-survey-140826135420-phpapp02/75/WHAT-CONSTITUTES-AN-AGILE-ORGANIZATION-DESCRIPTIVE-RESULTS-OF-AN-EMPIRICAL-INVESTIGATION-51-2048.jpg)
![A. Appendix XV
Aktivit ¨aten – Unternehmen allgemein
Bitte geben Sie an, wie oft die folgenden Aktivit¨aten in Ihrem Unternehmen ausgef¨uhrt werden. [Skala:
immer–oft–gelegentlich–selten–nie]
Mit Blick auf unsere Mitarbeiter. . .
. . . steuern wir Vorschl¨age, neue Ideen und L¨osungen aus allen Ebenen bis zur Umsetzung konsequent.
. . . vertrauen wir ihnen bei der Erledigung ihrer Arbeit.
. . . bieten wir Anreize, welche sich nicht nur an der individuellen, sondern auch an der Teamleistung und
dem Beitrag f¨ur das Gesamtunternehmen orientieren.
. . . bieten wir Anreize, welche Mitarbeiter ermutigen, ihre F¨ahigkeiten und Kenntnisse auszubauen.
. . . ermutigen wir auch die unteren Hierarchieebenen, Entscheidungen selbst zu treffen und Verantwortung
zu ¨ubernehmen.
. . . bilden wir Mitarbeiter mit einer langfristigen Perspektive f¨ur die Entwicklung des Unternehmens wei-ter.
In unserem Unternehmen. . .
. . . beobachten wir unsere Umgebung systematisch, um Ver¨anderungen zu prognostizieren.
. . . reagieren wir auf bevorstehende Ver¨anderungen, indem wir umgehend unsere Strategie anpassen.
. . . reagieren wir auf bevorstehende Ver¨anderungen, indem wir umgehend unsere Prozesse anpassen.
. . . f¨allen wir wichtige Entscheidungen schnell, um Ver¨anderungen imMarkt und/oder von Kundenbed¨urf-nissen
zu begegnen.
. . . passen wir Weisungsbefugnisse an, sobald sich Aufgaben ¨andern.
. . . arbeiten wir eng und intensiv ¨uber verschiedene Bereiche und/oder Abteilungen zusammen, um strate-gische
Entscheidungen zu treffen.
. . . unterst¨utzen wir die fr¨uhzeitige Einbindung verschiedener Bereiche und/oder Abteilungen in die Ent-wicklung
neuer Produkte und/oder Dienstleistungen.
. . . gestalten wir unsere Prozesse zeitgleich mit Entwicklung neuer Produkte und/oder Dienstleistungen.
. . . informieren wir uns systematisch ¨uber IT-Innovationen.
. . . investieren wir strategisch in angemessene Technologien und haben eine klare Vision, wie unsere IT
einen Wert schafft.
. . . fokussieren wir uns auf unsere Kernkompetenzen und delegieren andere Aufgaben an Partner und Sub-unternehmer.
. . . ¨uberpr¨ufen wir die Leistung unserer Partner und Subunternehmer sorgf¨altig.
. . . w¨ahlen wir unsere Partner und Subunternehmer vorrangig nach Qualit¨atskriterien aus (statt einer reinen
Kostenbetrachtung).
. . . richten wir alle Aktivit¨aten konsequent an Kundenanforderungen und -bed¨urfnissen aus.
. . . unterst¨utzen wir die Sammlung und interne Verbreitung von Informationen ¨uber Kundenbed¨urfnisse.
. . . arbeiten wir eng mit unseren Kunden zusammen und ermutigen sie zu schnellen R¨uckkopplungen.
Weiteres
Sind in Ihrem Unternehmen weitere T¨atigkeiten, F¨ahigkeiten, Werte, etc. vorhanden, welche Sie agiler ma-chen
als andere? Wenn ja, dann k¨onnen Sie hier weitere Angaben machen, sofern Sie w¨unschen. [Textfeld]](https://image.slidesharecdn.com/gelbe-reiheagility-survey-140826135420-phpapp02/75/WHAT-CONSTITUTES-AN-AGILE-ORGANIZATION-DESCRIPTIVE-RESULTS-OF-AN-EMPIRICAL-INVESTIGATION-52-2048.jpg)