Download to read offline


![35
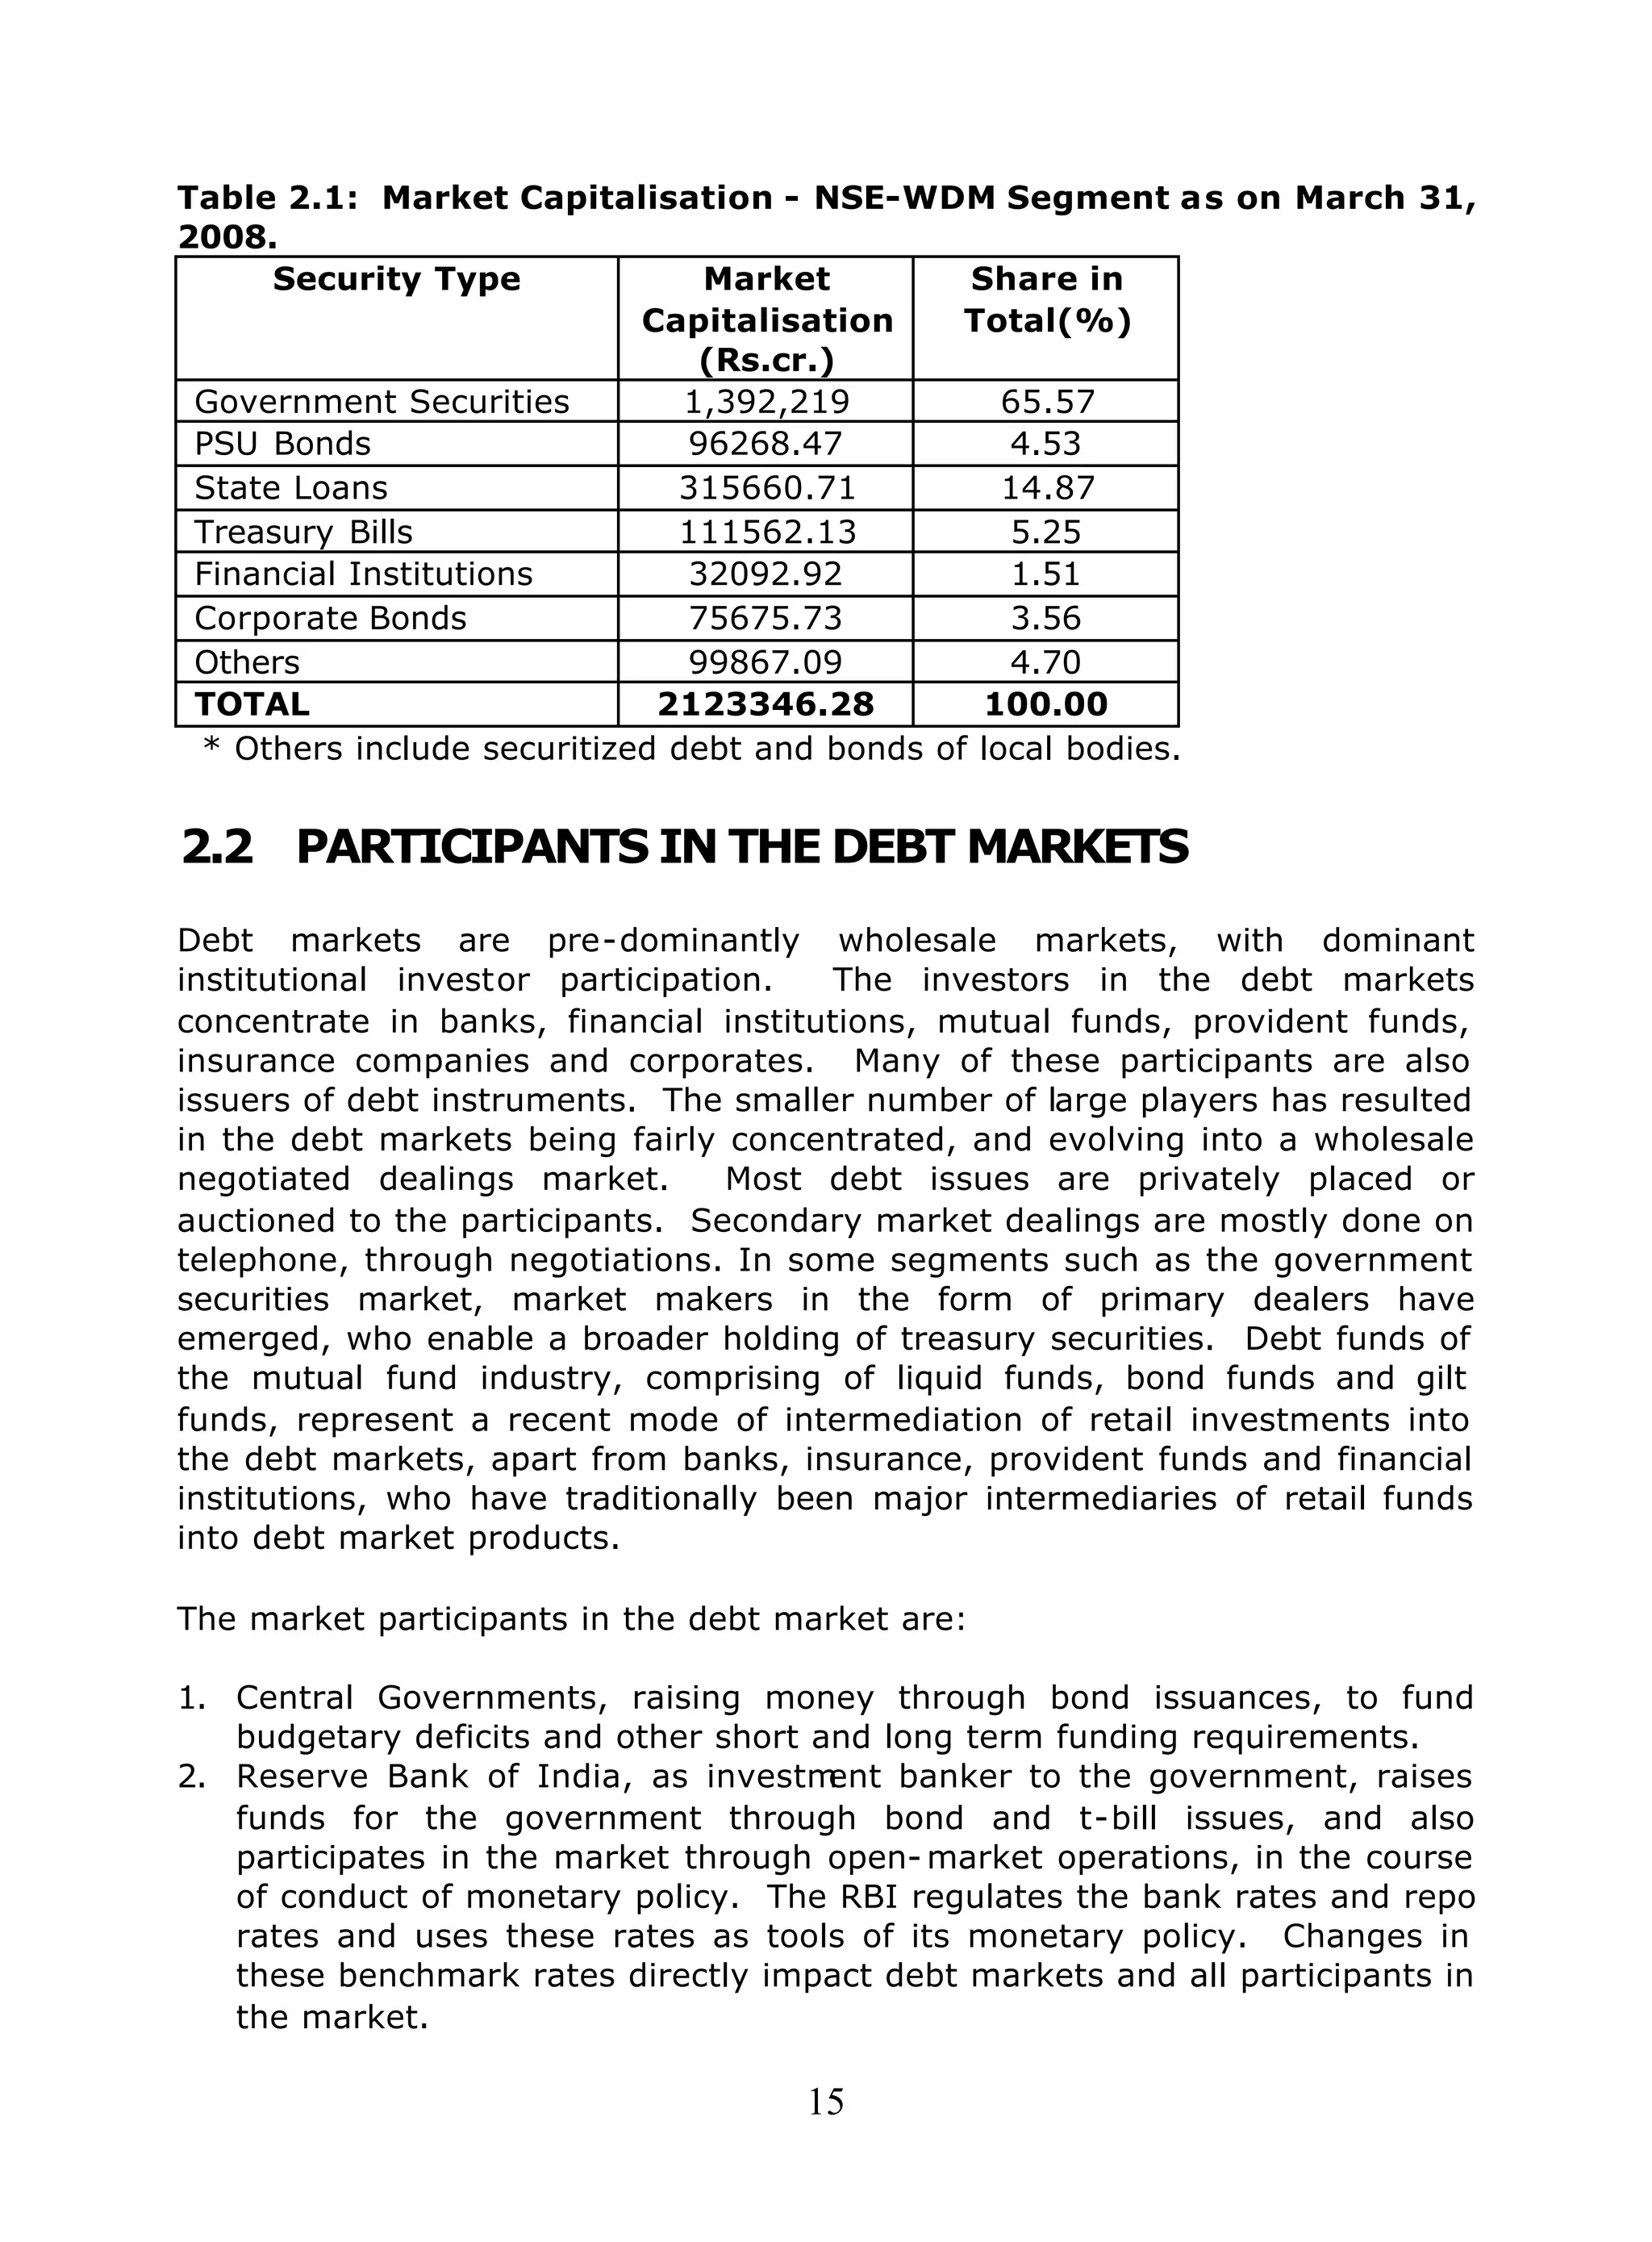
3.5 CONSTITUENT SGL ACCOUNTS
Subsidiary General Ledger (SGL) account is a facility provided by RBI to large
banks and financial institutions to hold their investments in government
securities and treasury bills in the electronic book entry form. Such
institutions can settle their trades for securities held in SGL through a
delivery-versus-payment (DvP) mechanism, which ensures simultaneous
movement of funds and securities. As all investors in government securities
do not have access to the SGL system, RBI has permitted such investors to
open a gilt with any entity authorized by RBI for this purpose and thus avail
of the DvP settlement. RBI has permitted NSCCL, NSDL, CDSL,SHCIL, banks
and PDs to offer constituent SGL account facility to an investor who is
interested in participating in the government securities market.
The facilities offered by the constituent SGL accounts are dematerialisation,
re- materialisation, buying and selling of transactions, corporate actions, and
subscription to primary market issues. All entities regulated by RBI [including
FIs, PDs, cooperative banks, RRBs, local area banks, NBFCs] should
necessarily hold their investments in government securities in either SGL
(with RBI) or CSGL account.
3.6 PRIMARY DEALERS
Primary dealers are important intermediaries in the government securities
markets introduced in 1995. In order to broad base the Primary Dealership
System, banks were permitted to undertake Primary Dealership business
departmentally in 2006-07. There are now 19 primary dealers in the debt
markets. They act as underwriters in the primary debt markets, and as
market makers in the secondary debt markets, apart from enabling the
participation of a number of constituents in the debt markets.
The objectives of setting up the system of primary dealers are 2
:
i. To strengthen the infrastructure in the government securities market in
order to make it vibrant, liquid and broad-based;
ii. To develop underwriting and market making capabilities for government
securities outside the Reserve Bank, so that the Reserve Bank could
gradually shed these functions;
iii. To improve secondary market trading system that would contribute to
price discovery, enhance liquidity and turnover and encourage voluntary
holding of government securities among a wider investor base; and
iv. To make primary dealers an effective conduit for conducting open market
operations.
2
The following sections on primary dealers and satellite dealers have been downloaded from
www.rbi.org.in.](https://image.slidesharecdn.com/fimmda-101119095005-phpapp01/75/Fimmda-36-2048.jpg)


![52
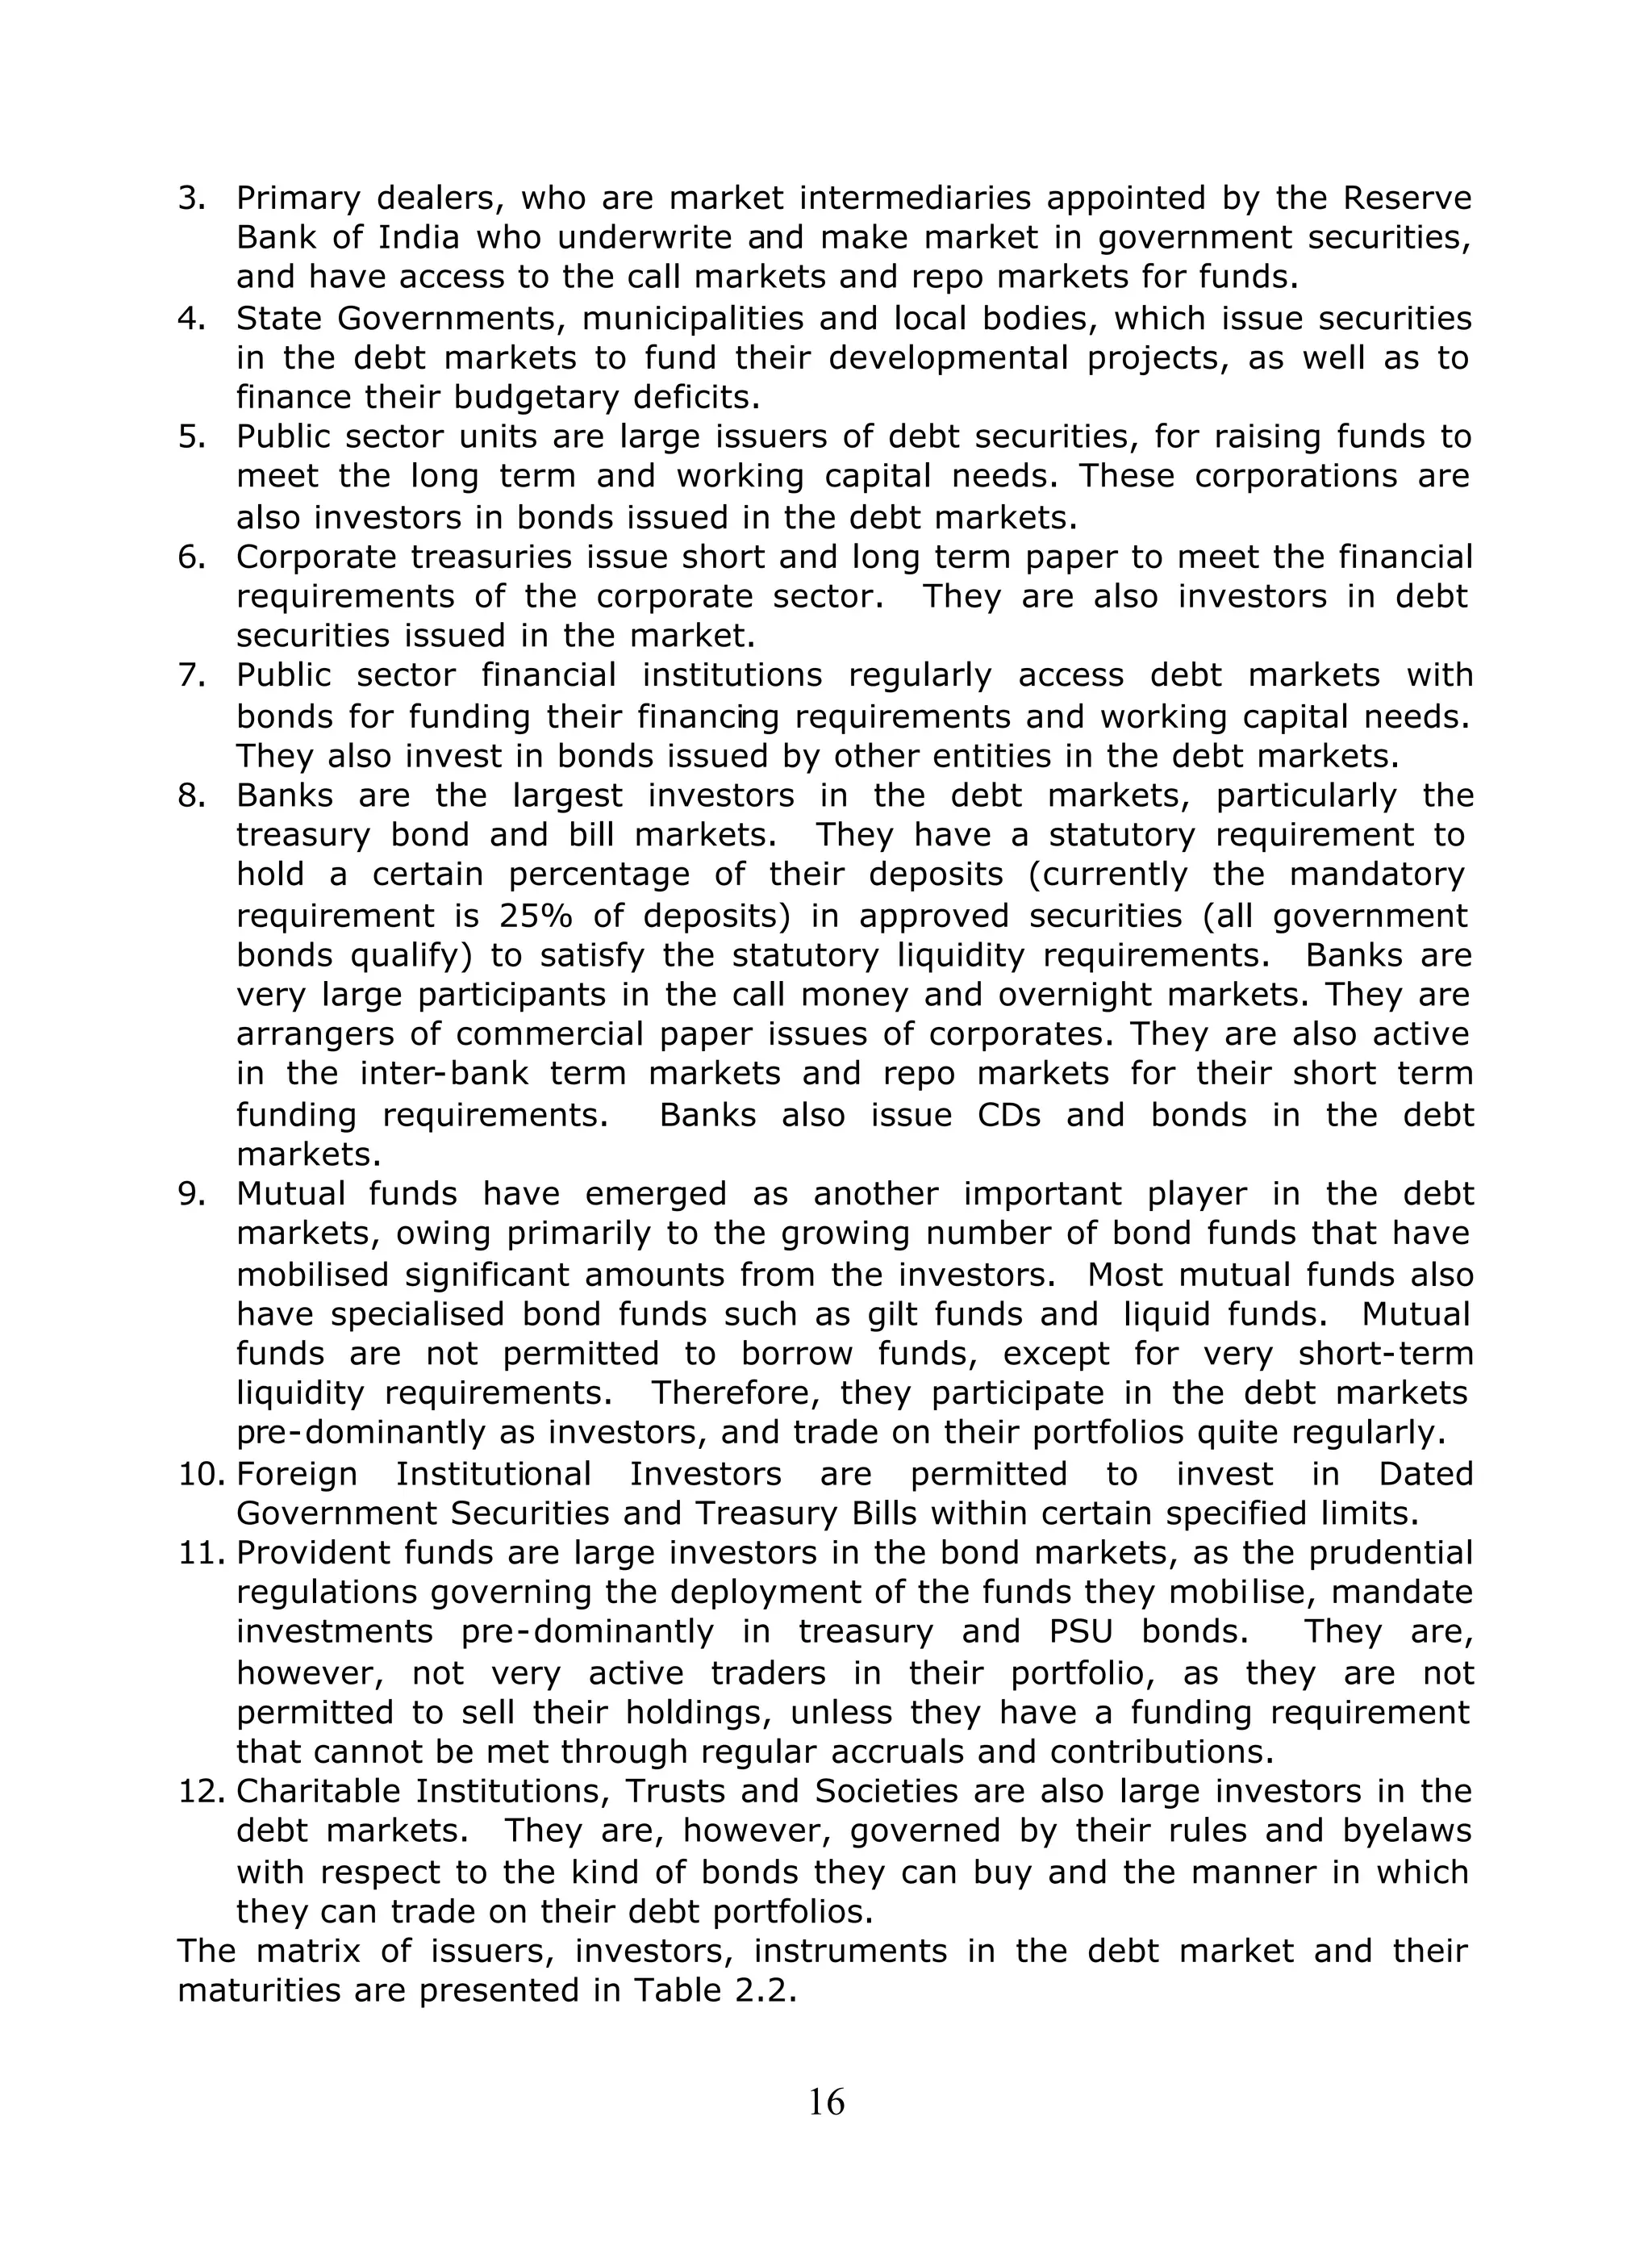
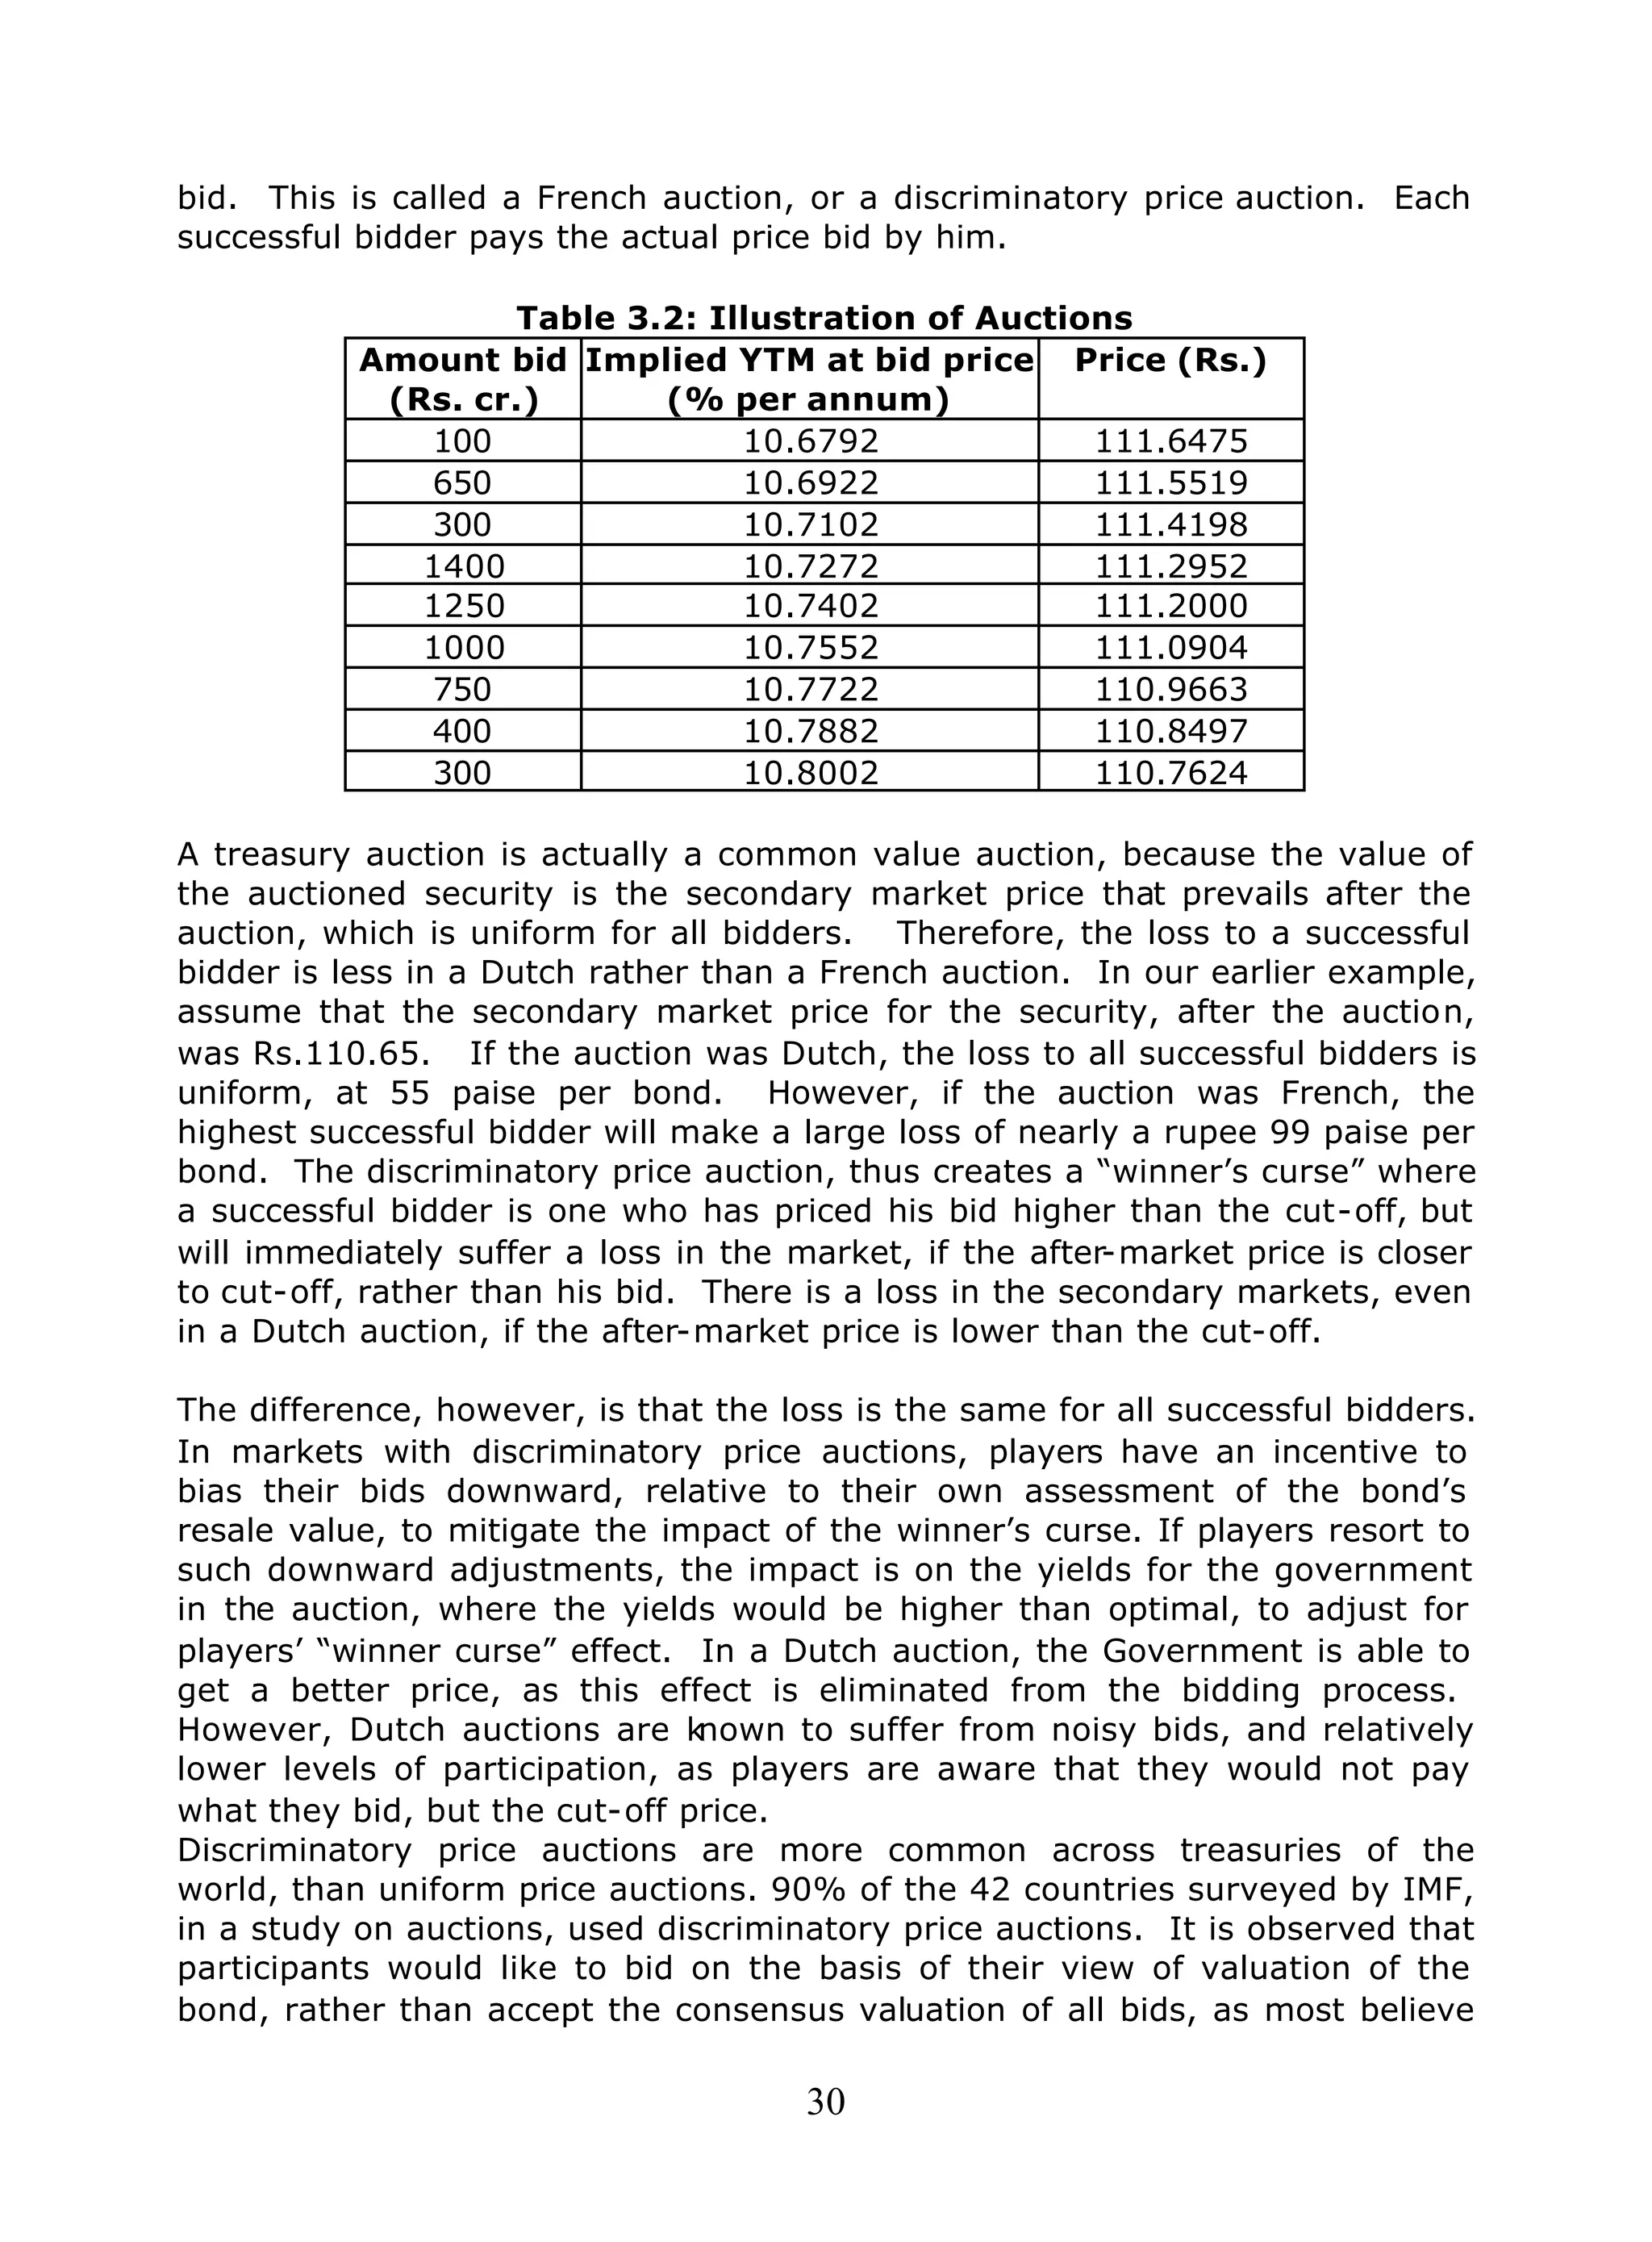
Model Questions
1. A treasury bill maturing on 28-Jun-2002 is trading in the market
on 3-Jul-2001 at a price of Rs. 92.8918. What is the discount rate
inherent in this price?
Answer:
The yield is computed as:
= [(100-price)*365]/ (Price * No of days to maturity)
= [(100-92.8918)*365]/ (92.8918*360) = 7.7584%
2. What is the price at which a treasury bill maturing on 23rd March
2002 would be valued on July 13, 2001 at a yield of 6.8204%?
Answer:
The price can be computed as
= 100/ {1+ [yield% * (No of days to maturity/365)]}
= 100/ {1+ [6.8204 %*( 253/365)]} = Rs. 95.4858
3. What is the day count convention in the treasury bill markets?
a. 30/360
b. Actual/Actual
c. Actual/360
d. Actual/365
Answer: d](https://image.slidesharecdn.com/fimmda-101119095005-phpapp01/75/Fimmda-53-2048.jpg)


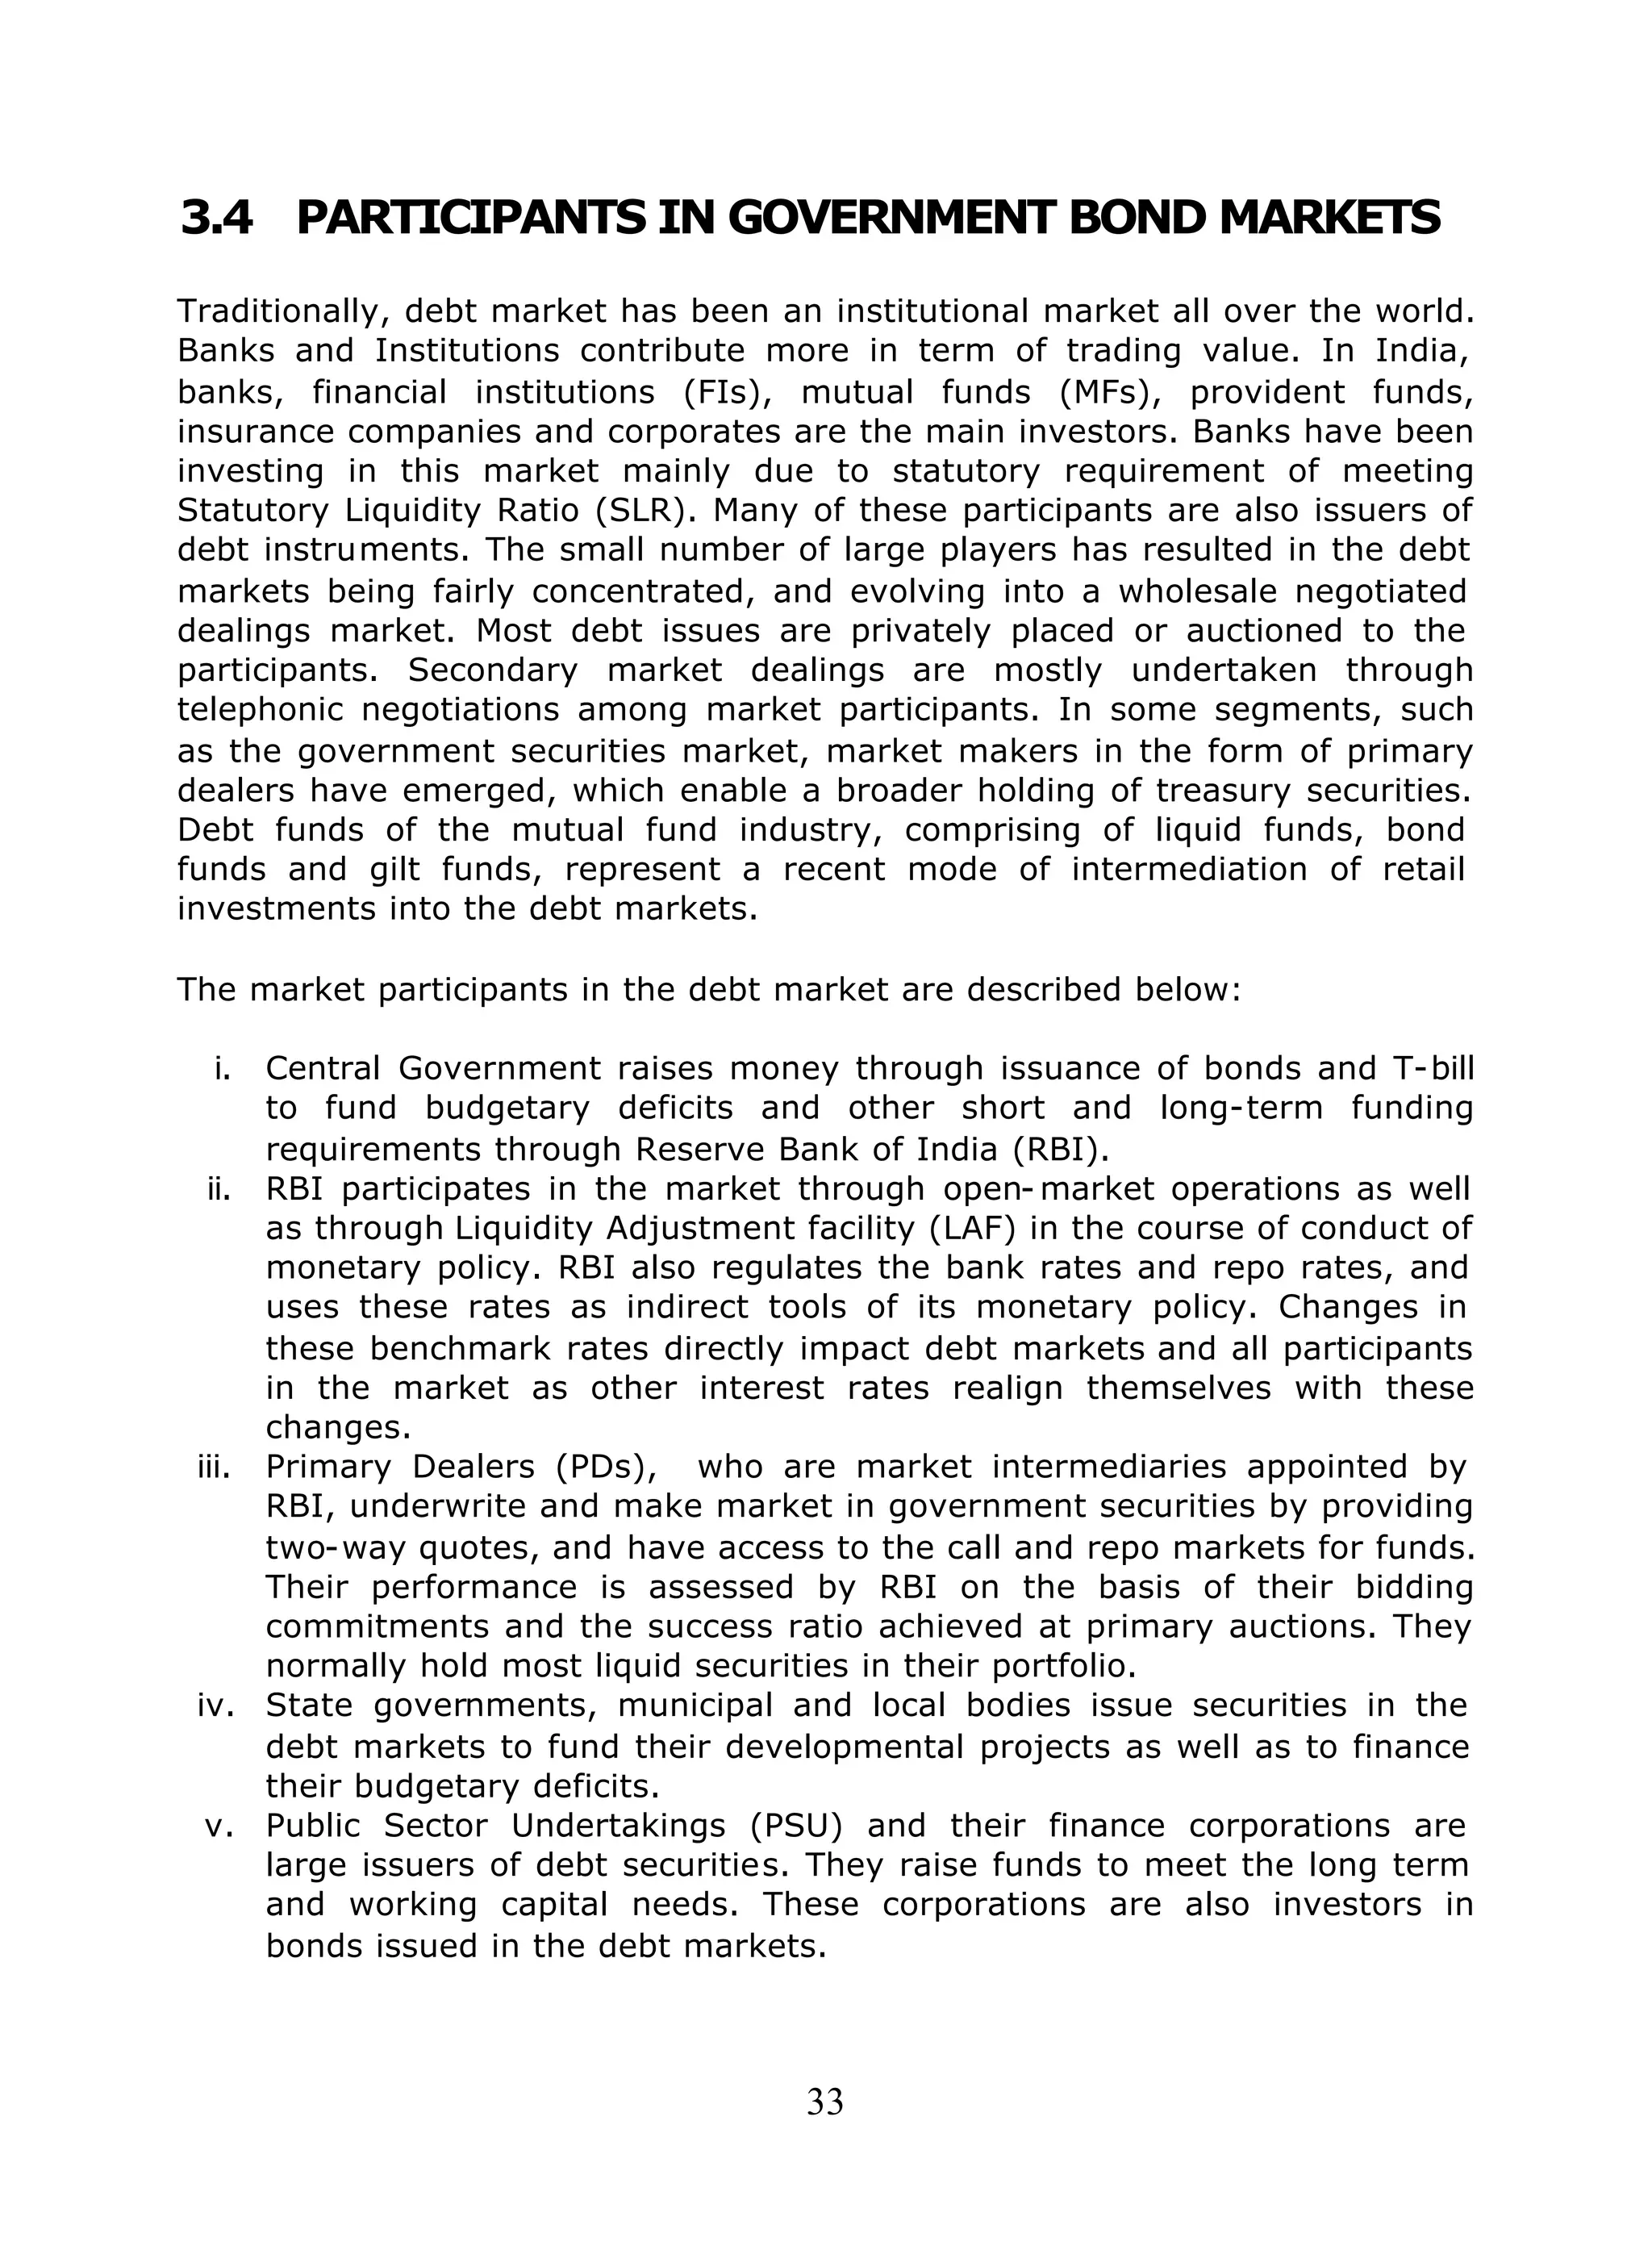
![164
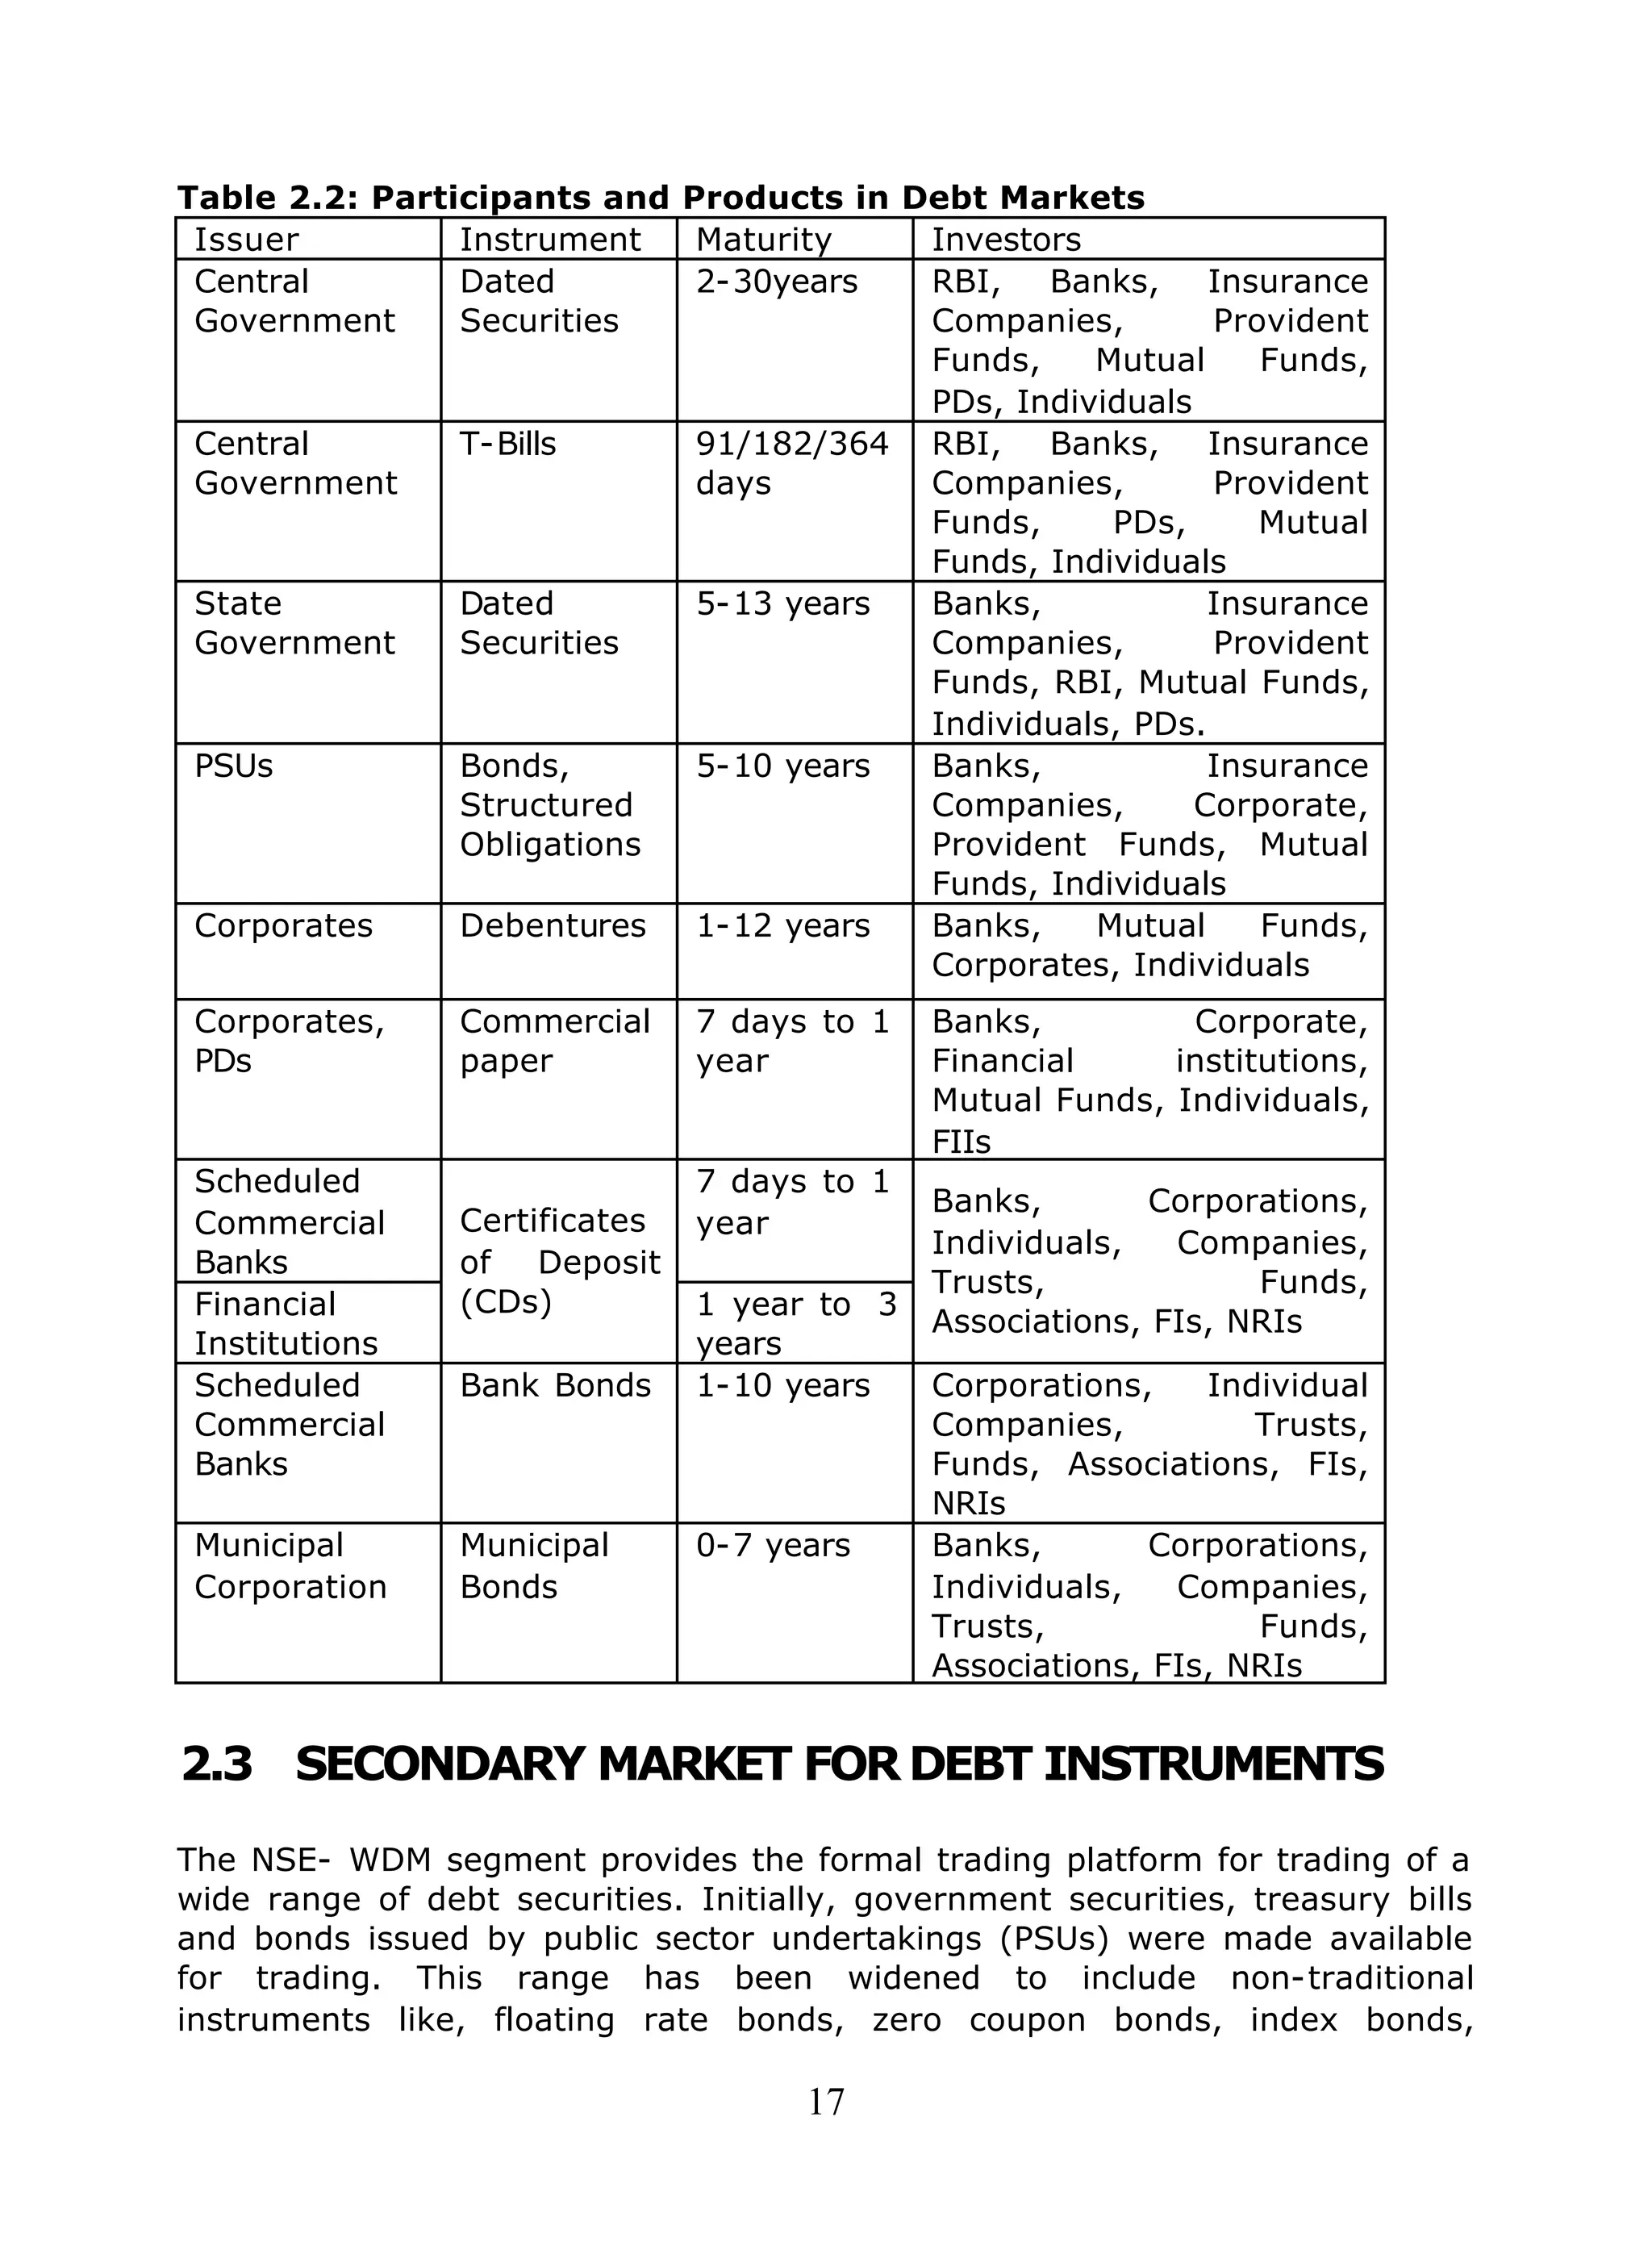
Table 13.4: Coupon days for settlement date February 5, 2001
Name of the
Security
Maturity
Date
Number
of
coupons
until
maturity
Number of
days in the
coupon
period
Number of
days from
previous
coupon
to settlement
Number of
days from
settlement to
next coupon
CG 12.5% 2004 23-Mar-04 7 180 132 48
CG 11.68% 2006 10-Apr-06 11 180 115 65
CG 11.5% 2008 23-May-08 15 180 72 108
CG 11.3 % 2010 28-Jul-10 19 180 7 173
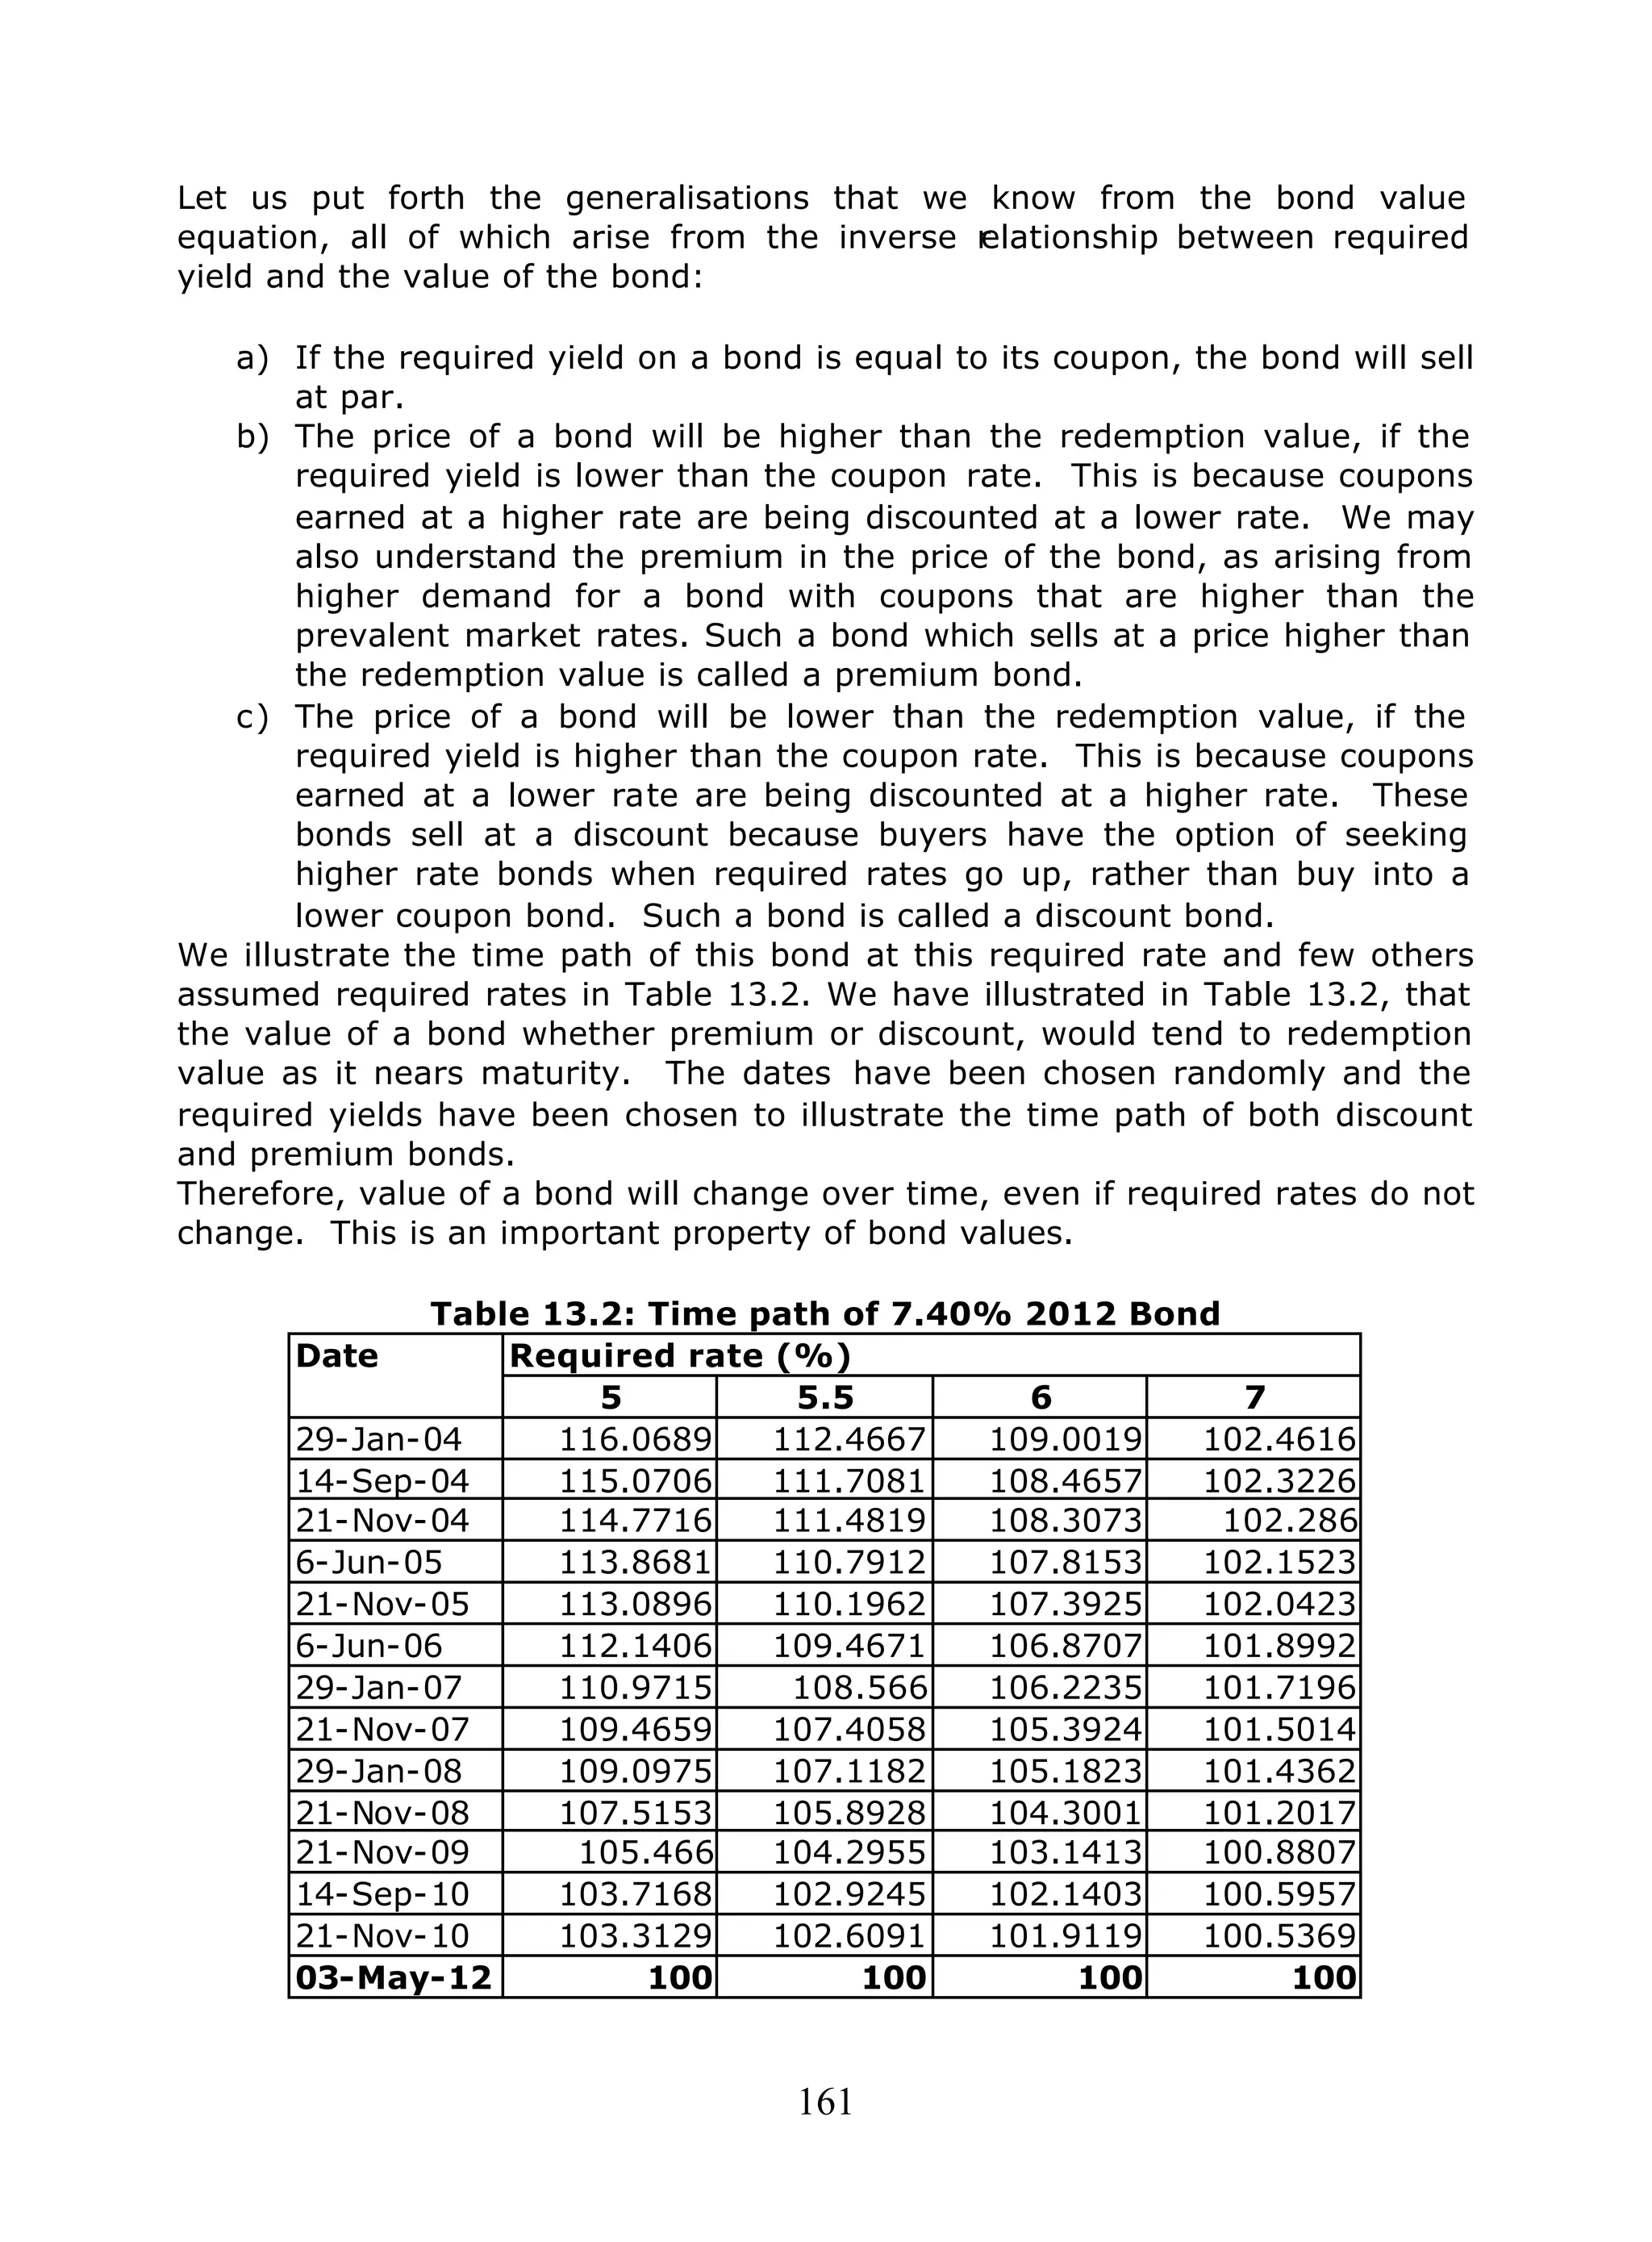
In order to value a bond, on a settlement date that is not a coupon date, we
have to re-cast the bond valuation equation 13.1, as follows:
)]/()1[()]/(1[
2
)/(
1
0
)1(
.........
)1()1( dicpdncn
n
dicpdncdicpdnc
r
c
r
c
r
c
P +−+
++
+
+
= …………(13.2)
Where c1, c2 .. cn are expected cash flows from the bond. Given the
redemption value, coupon rate and frequency of coupons, we can compute
these cash flows.
dnc is the number of days to the next coupon
dicp is the days in the coupon period
Since the first cash flow c1, is only dnc/dicp periods away from the settlement
date, we discount it only for that period. For the subsequent cashflows, we
can generalise the period for which discounting is to be done, as [(n-1) +
dnc/dicp]. We can use the “price” function in Excel, in order to use equation
13.2 in actual valuation of a bond. Alternatively, we can use the coupon
functions to find out the values in equation 13.2 and value the bond using the
PV function.
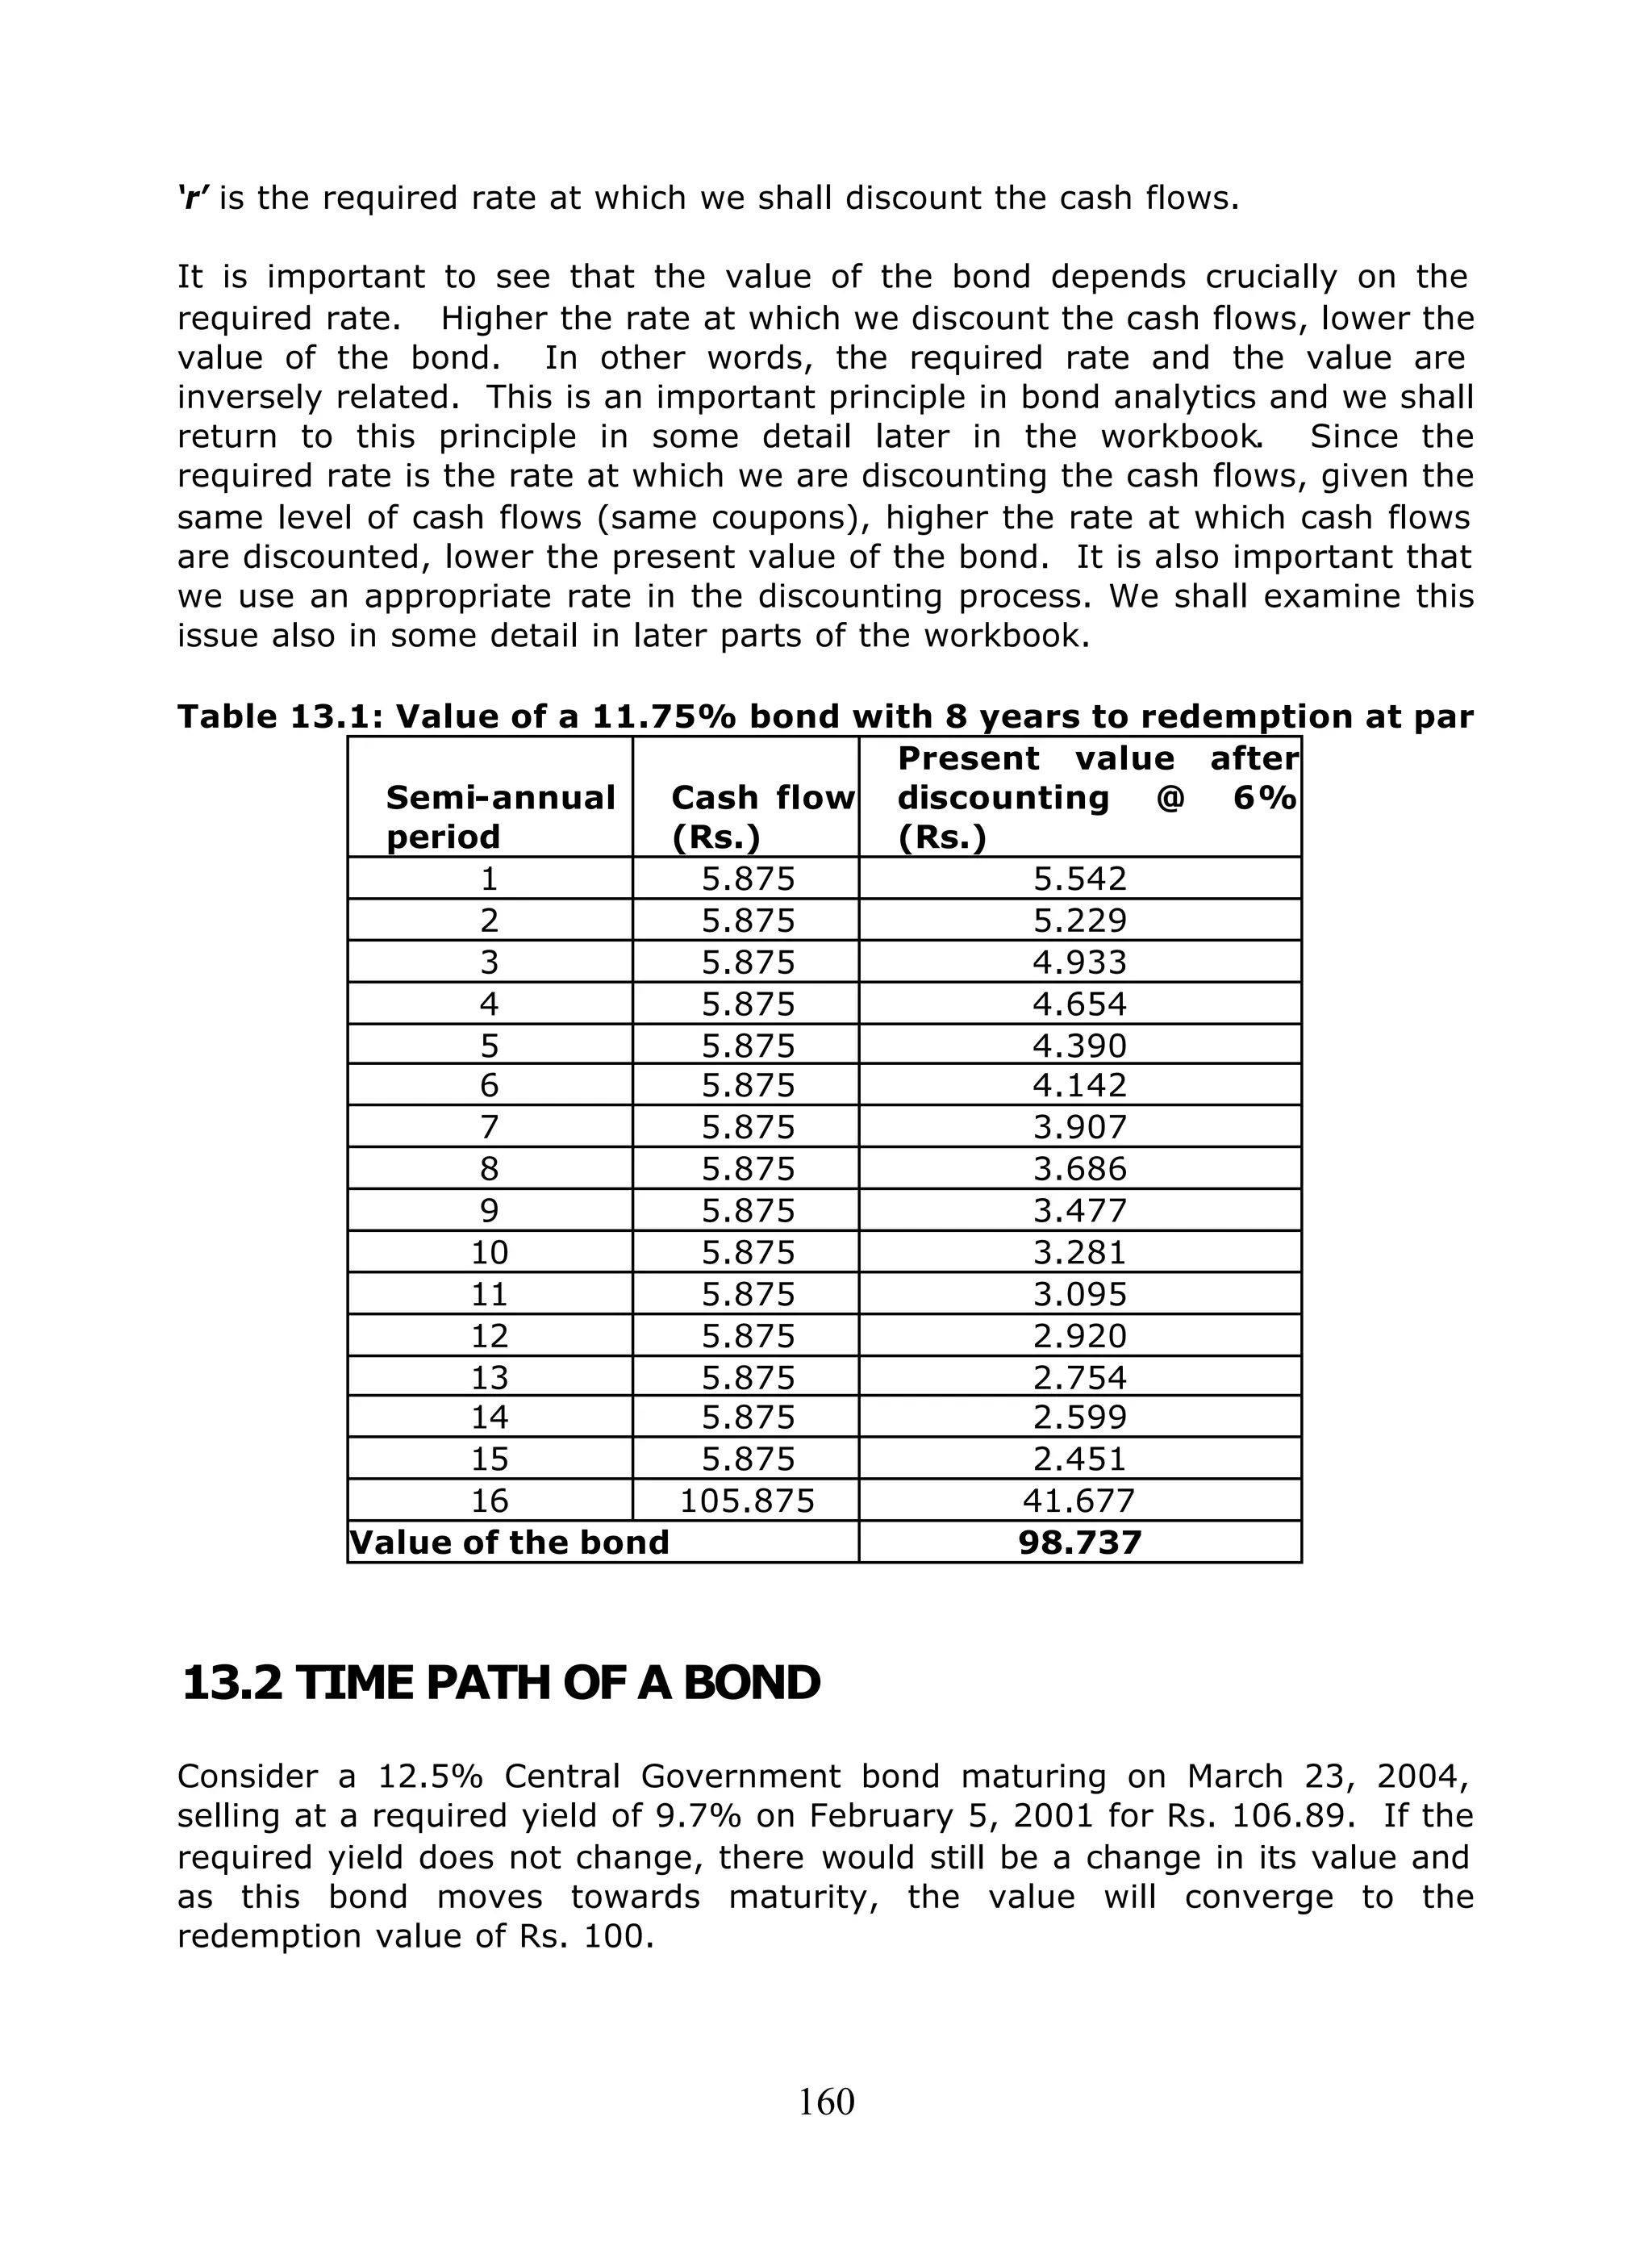
The value of the same bond, by merely varying the day count convention
(change the basis in Excel to 1, 2 and 3) can vary to Rs. 99.0136, Rs.
99.0143 ands. 99.0134 respectively.
Using Excel, readers can check the impact of changes in the day count
convention and the frequency of coupon payments on the value of the bond.
Are there any generalisations here?](https://image.slidesharecdn.com/fimmda-101119095005-phpapp01/75/Fimmda-165-2048.jpg)

![185
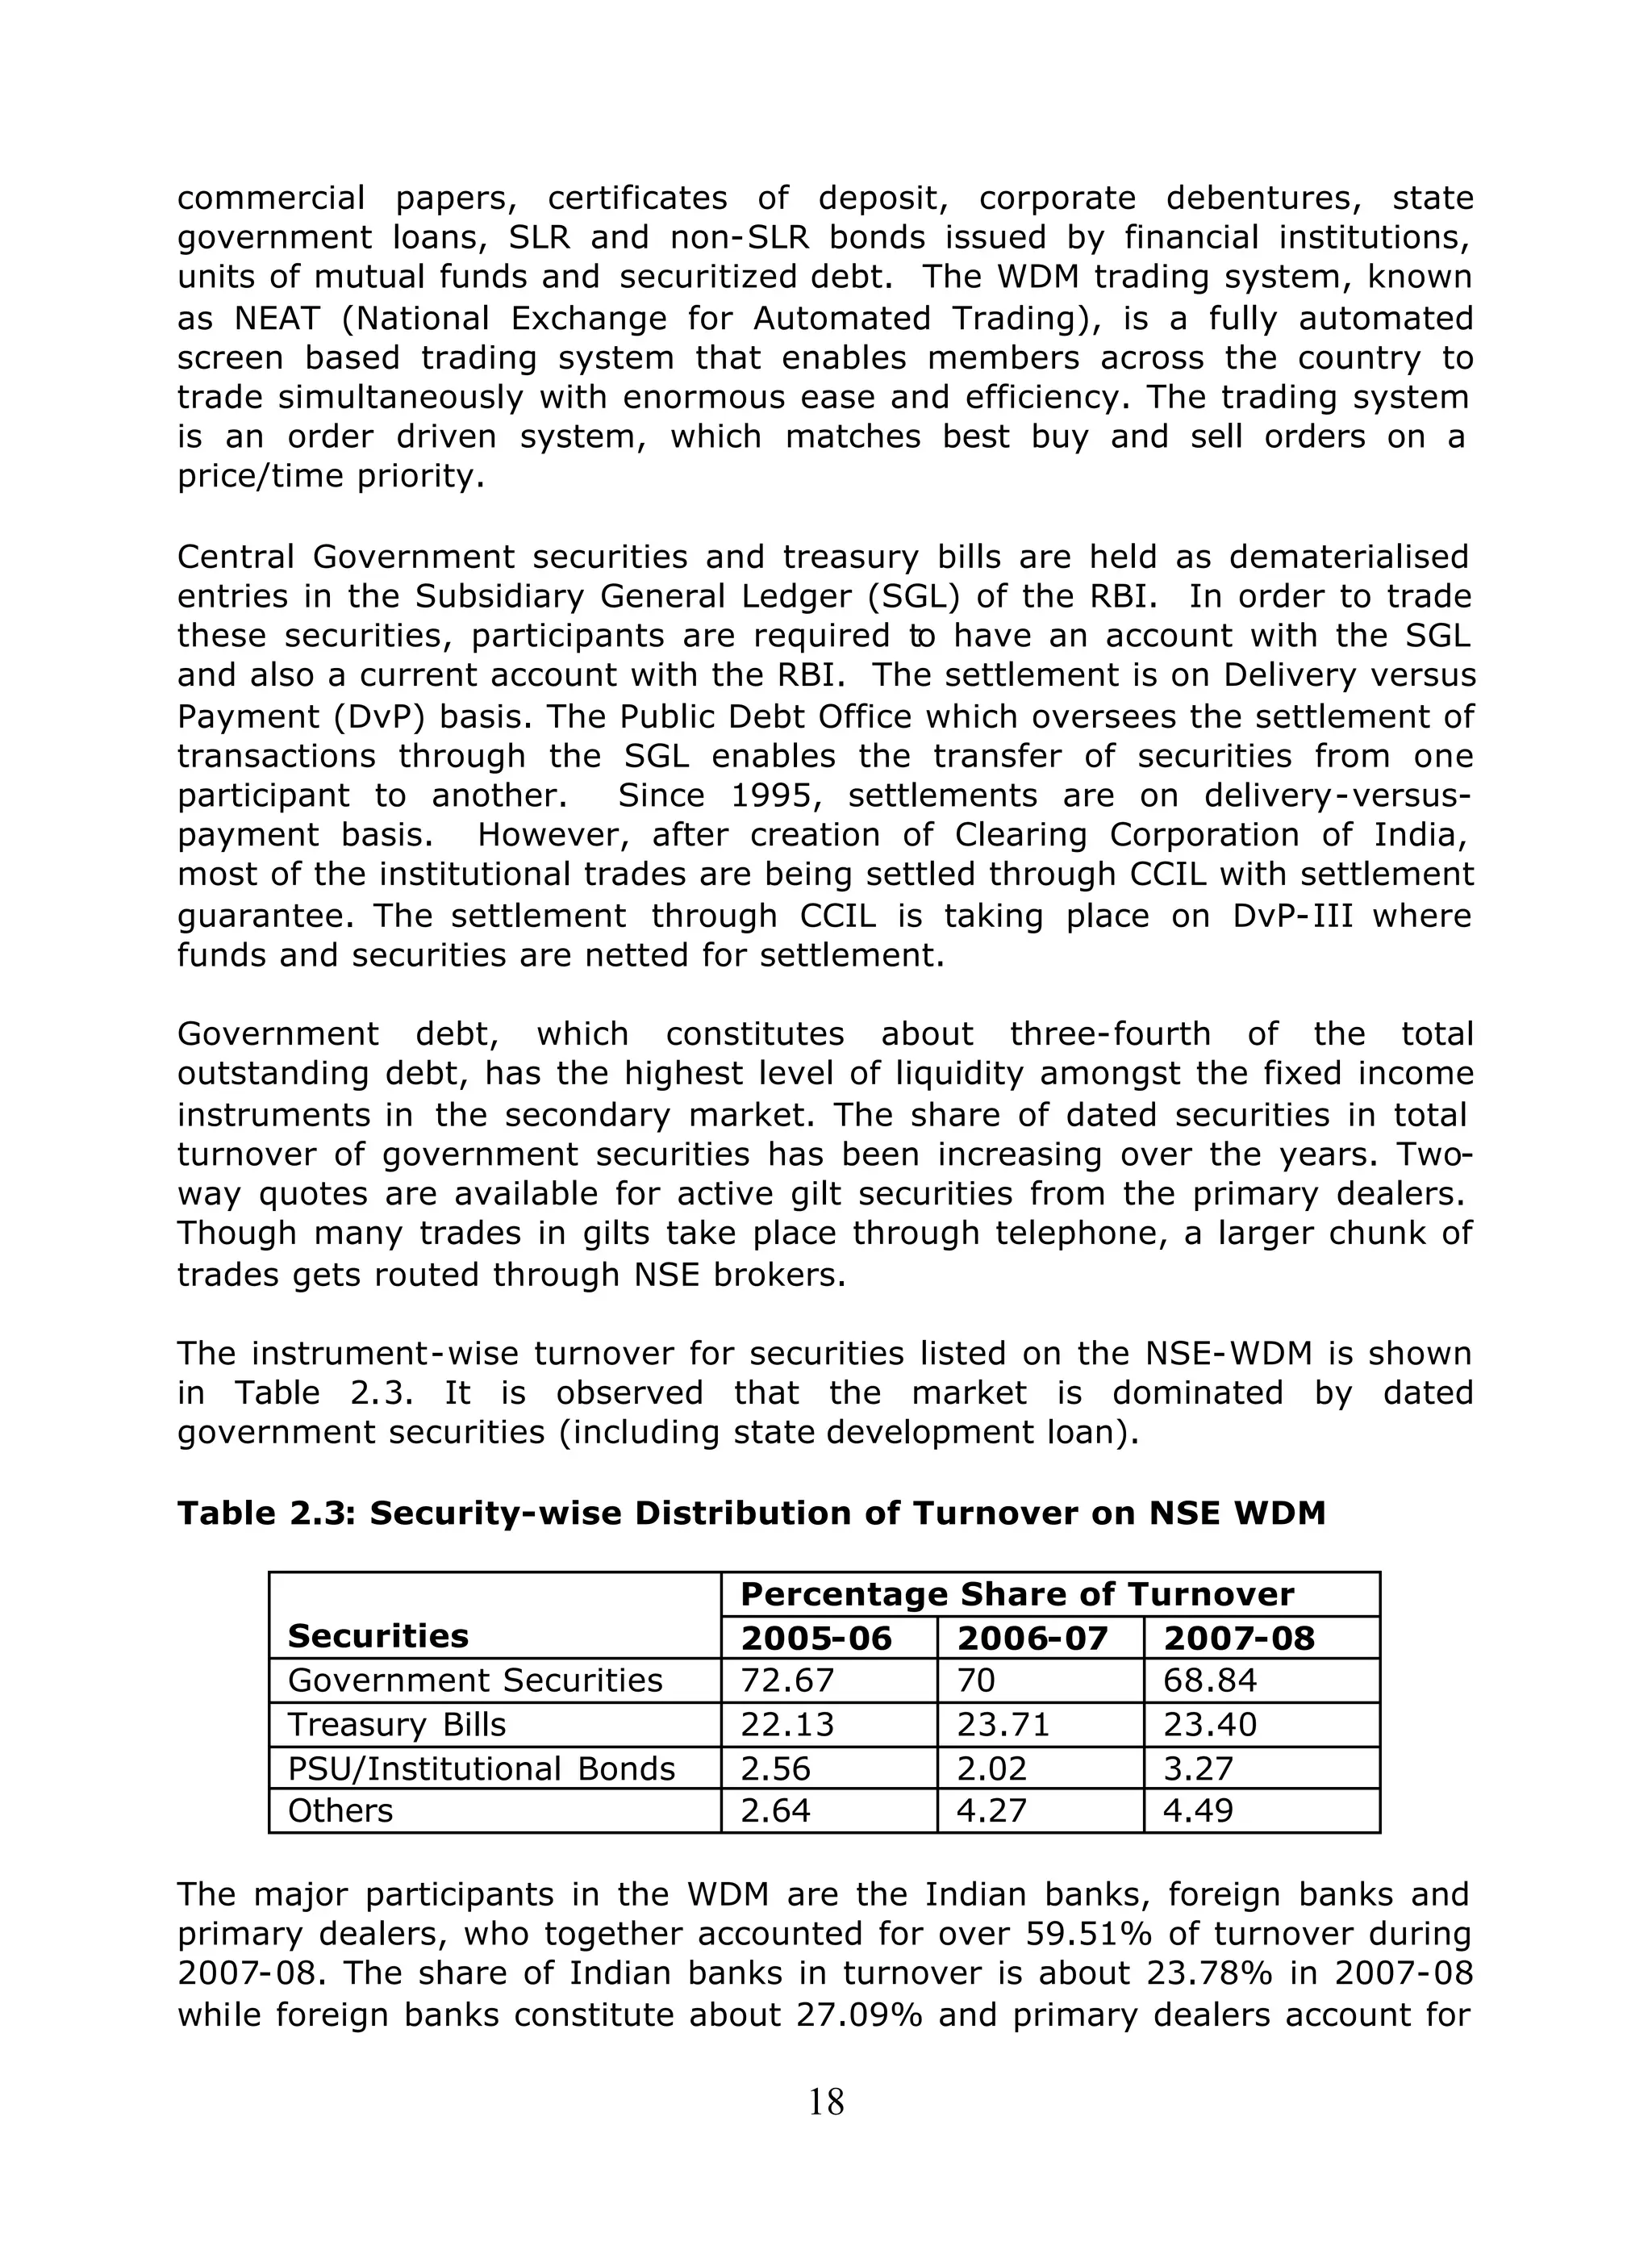
= 6.542 + [(6.675-6.542)] x [(42-40)/(52-40)]
= 6.56416%
3. The bootstrapping technique is sensitive to the liquidity and depth in
the market. In a market with few trades, and limited liquidity,
bootstrapping is only an approximation of the true term structure, due
to simple assumptions (like linear interpolation) made for linking up
rates for one tenor and the rates for another. It is not uncommon for
some to use more sophisticated non-linear interpolations.
14.3 ALTERNATE METHODOLOGIES TO ESTIMATE THE
YIELD CURVE
In the estimation of the yield curve from a set of observed market prices, the
following are important considerations:
a. The spot rates and the yield curve that is estimated should have a
close fit with market prices. That is, the prices estimated by the
model and the prices actually prevalent in the market should have a
close fit.
b. The mo del must apply equally well to bonds which are not part of the
sample used for estimation. That is, if a very close fit is sought to be
achieved, it may come at the cost of the model not being able to value
out-of-sample bonds. The model would have incorporated “noise” in
the estimation.
c. The estimated yield curve should be smooth, such that the spot and
forward rates derived from them do not show excessive volatility.
A number of mathematical techniques are used to generate a fitted yield
curve from a set of observed interest rate points. They involve optimality
criteria consistent with the assumptions regarding the term structure of
interest rates.
14.3.1 NSE –ZCYC (Nelson Seigel Model)
In the Indian markets, term structure estimation has been done, and is
disseminated every day by the National Stock Exchange. The Zero Coupon
Yield Curve (ZCYC) published by the NSE, uses the Nelson-Seigel
methodology. 12 The Nelson-Siegel formulation specifies a parsimonious
representation of the forward rate function given by
)]/exp()/[()/exp(),( 210 ττβτββ mmmbmf −∗+−∗+=
……………..(14.4)
12
The paper (Gangadhar Darbha, et al, 2000) that describes the methodology can be downloaded
from www.nse.co.in `products`zcyc. The following section is extracted from this paper.](https://image.slidesharecdn.com/fimmda-101119095005-phpapp01/75/Fimmda-186-2048.jpg)
![186
where ‘m’ denotes maturity and b=[ β0, β1, β2 and τ] are parameters to be
estimated.
Since the model is based on the expectations hypothesis, it develops the term
structure from the no-arbitrage relationship between spot and forward rates.
The forward rate function can be mathematically manipulated (integrated) to
obtain the relevant spot rate function, the term structure:
)/exp()//()]/exp(1[)(),( 2210 τβττβββ mmmbmr −∗−−−∗++= …………………(
14.5)
In the spot rate function, the limiting value of r(m,b) as maturity gets large is
β0 which therefore depicts the long term component (which is a non-zero
constant). The limiting value as maturity tends to zero is β0 + β1, which
therefore gives the implied short-term rate of interest.
With the above specification of the spot rate function, the PV relation can now
be specified using the discount function given by
∗
−=
100
),(
exp),(
mbmr
bmd …………………..(14.6)
The present value arrived at is the estimated/model price (p_est) for each
bond. It is common to observe secondary market prices (pmkt) that deviate
from this value. For the purpose of empirical estimation of the unknown
parameters in term structure equation above, we postulate that the observed
market price of a bond deviates from its underlying valuation by an error
term ei, which gives us the estimable relation:
iii eestppmkt += _ ……………………(14.7)
This equation is estimated by minimising the sum of squared price errors. The
steps followed in the estimation procedure are as follows:
i. A vector of starting parameters (β0, β1, β2 and τ) is selected,
ii. The discount factor function is determined using these starting
parameters,
iii. This is used to determine the present value of the bond cash flows and
thereby to determine a vector of starting ‘model’ bond prices,
iv. Numerical optimization procedures are used to estimate a set of
parameters (under a given set of constraints viz. non-negativity of long
run and short run interest rates) that minimise the sum of squared price
errors,
v. The estimated set of parameters are used to determine the spot rate
function and therefrom the ‘model’ prices (this is the first set of results
we compute for each day),
vi. These ‘model’ prices are used to compute associated ‘model’ YTMs for
each bond (this is the second set of results).
Plots of the estimated term structure for any particular day can be obtained
by following the procedure below:](https://image.slidesharecdn.com/fimmda-101119095005-phpapp01/75/Fimmda-187-2048.jpg)
![190
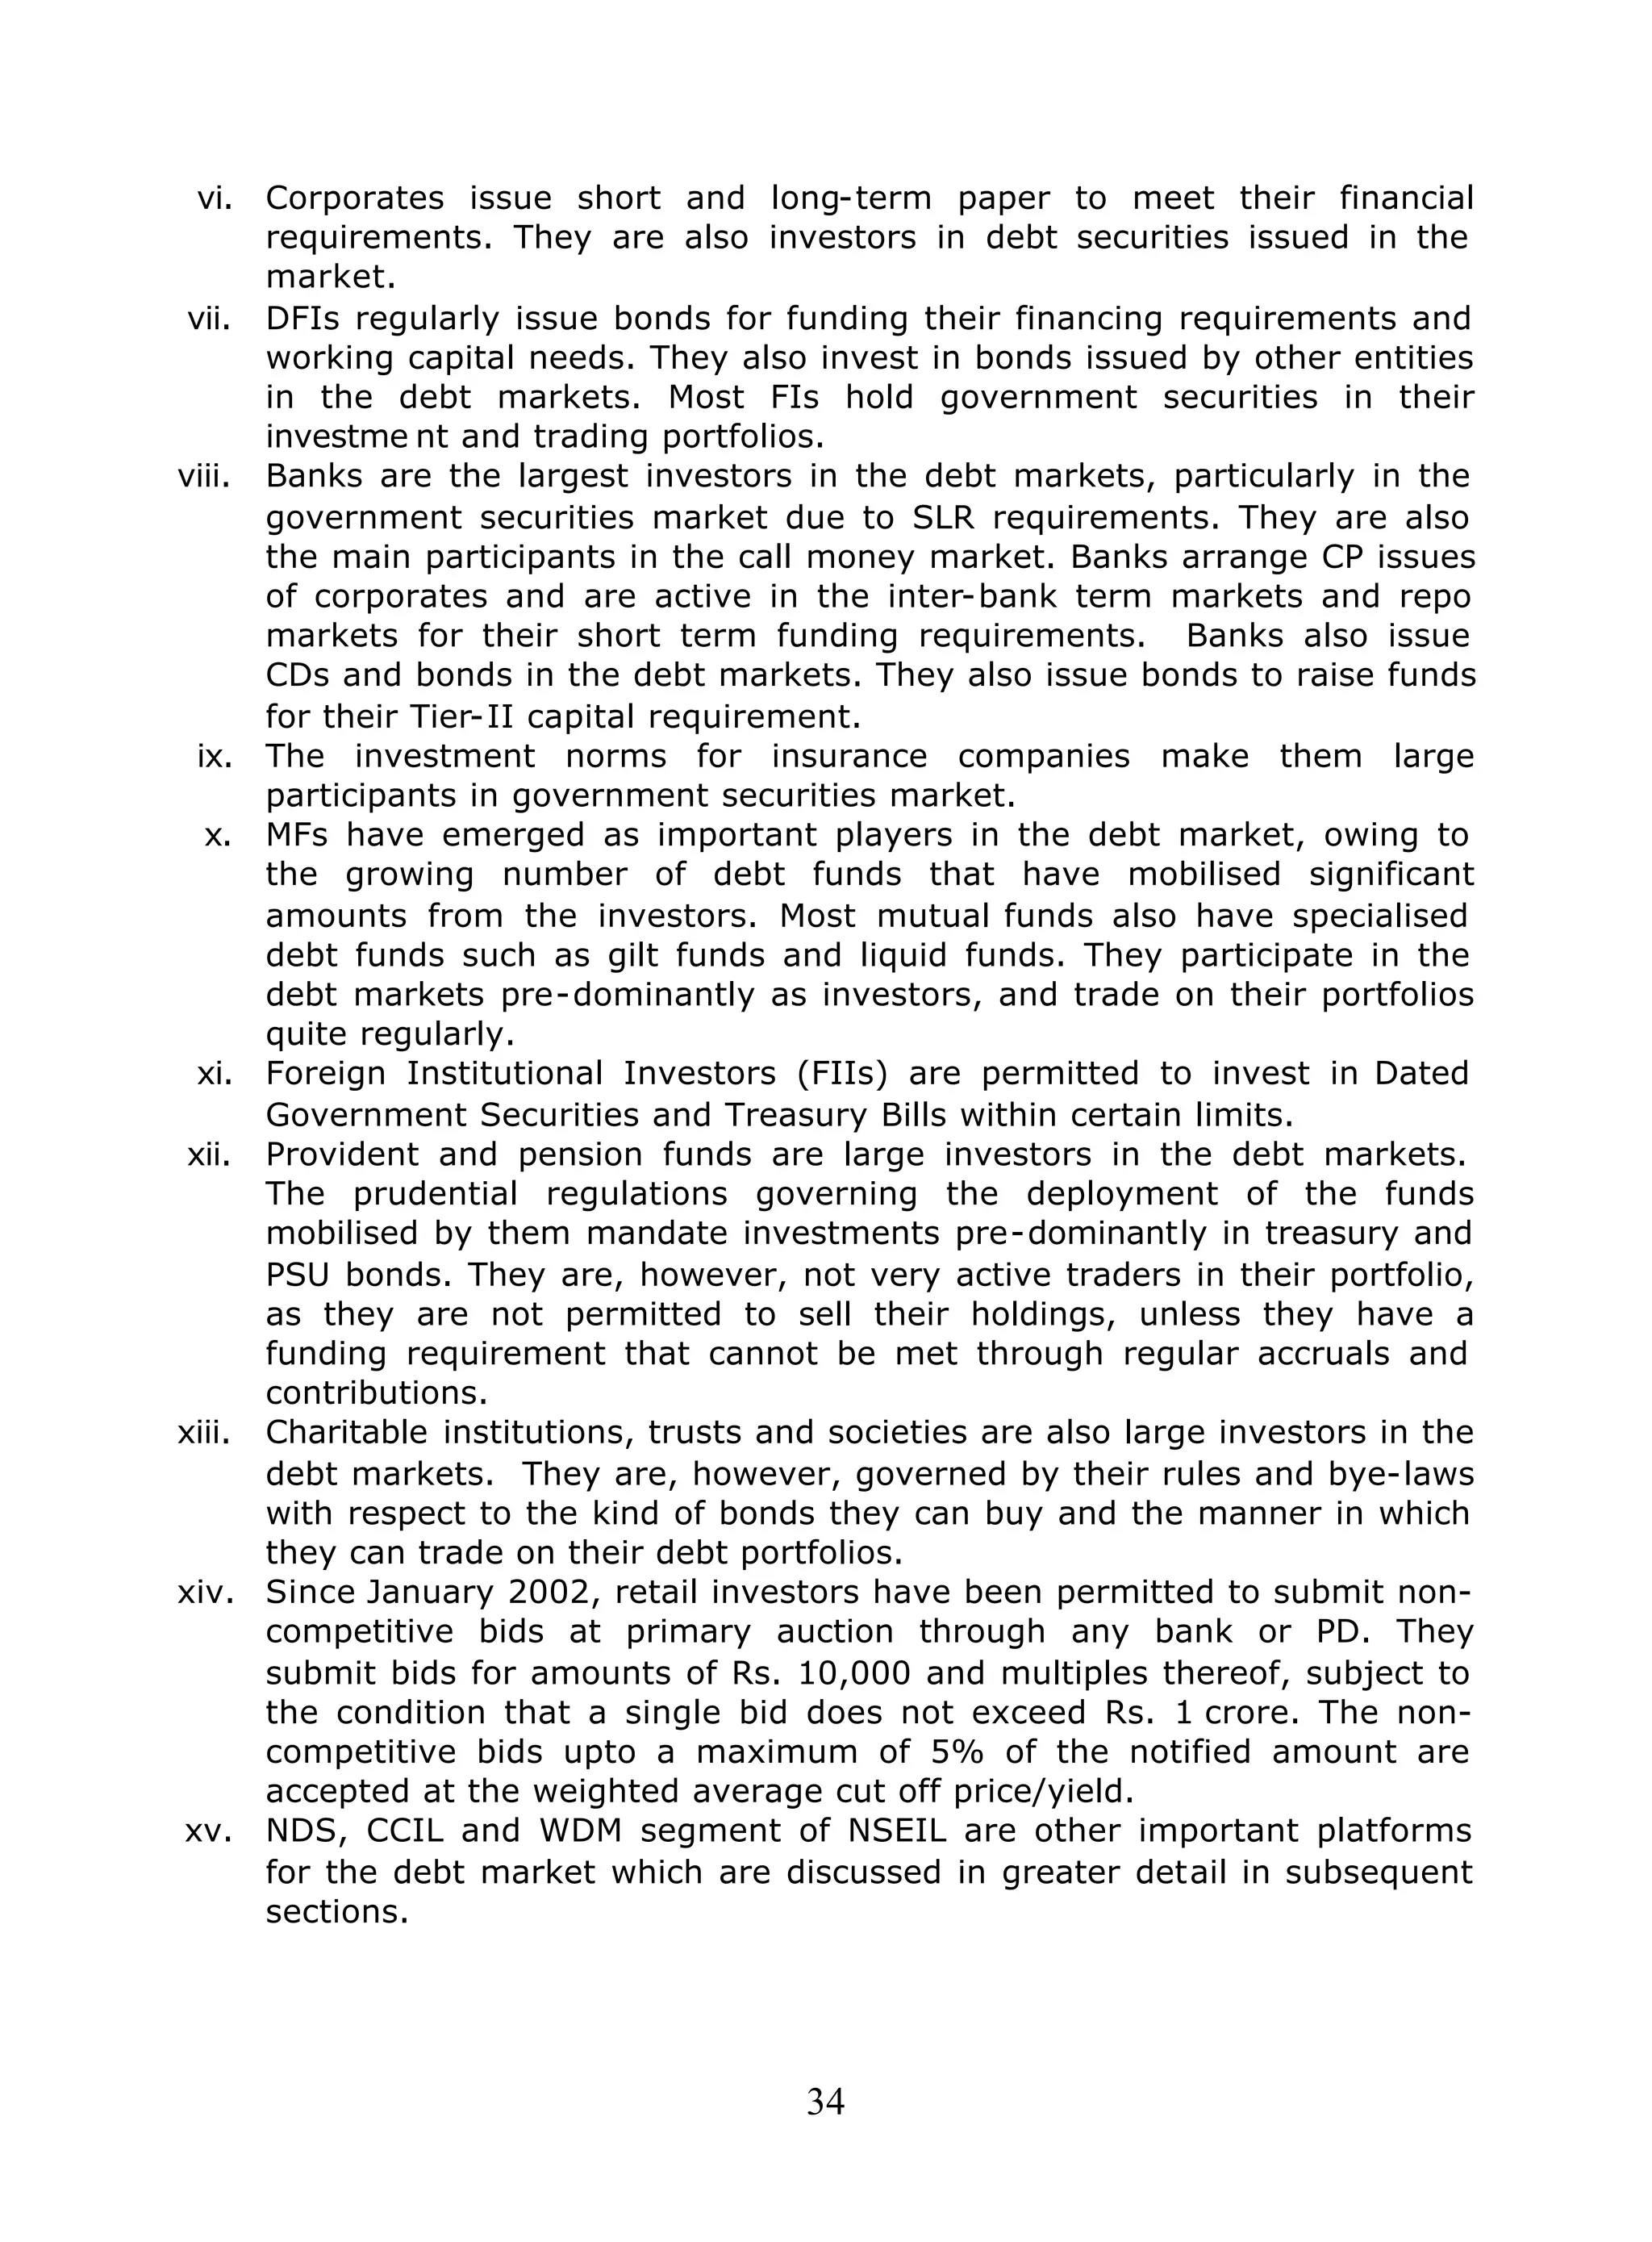
Model Questions
1. The NSE ZCYC estimates for July 11, 2001 are as follows:
Beta 0 = 11.4652
Beta 1 = -2.2510
Beta 2 = -10.7202
Tau = 1.4197
What is the spot rate for a term to maturity of 3.5 years?
Answer:
We use the ZCYC valuation equation (14.5)
)/exp()//()]/exp(1[)(),( 2210 τβττβββ mmmbmr −∗−−−∗++=
We can take the values provided by NSE to an Excel Spreadsheet, and key in
the formula above, substituting 3.5 for m in the equation, and substituting
the NSE estimates for B0, B1 and B2 and Tau. We then get
= 11.4652 + ((-2.2510-10.7202)*(1-exp(-3.5/1.4197))/(3.5/1.4197)-(-
10.7202*exp(-3.5/1.4197))
= 7.56185%
2. If there are 2 bonds trading in the market as follows, on July 11,
2001 as detailed below:
i. 11.98% 2004 (Maturity 8-Sep-2004): Rs. 111.8
ii. 11.19% 2005 (Maturity 12 Aug 2005): Rs. 111.83
What is the linearly interpolated rate for 3.5 years, using the above
data?
Answer:
Using the Yield function, we can find out the YTM of the above bonds as
7.6917% and 7.7524% respectively. Using the yearfrac function, we can
find the term to maturity of these bonds as 3.1583 years and 4.0861 years
respectively. To find the YTM for a 3.5 year bond, we can do a linear
interpolation, as follows:
= 7.6917 + (7.7524-7.6917)*((3.5-3.1583)/(4.0861-3.1583))
= 7.7141%
3. If the yield curve is upward sloping, which of the following is
false?
a. The market expects short term interest rates to increase.
b. The liquidity premium is increasing with increase in tenor.
c. There is an excess of demand over supply in shorter maturities.
d. The interest rates are positively related to term, along the yield
curve.
Answer: c](https://image.slidesharecdn.com/fimmda-101119095005-phpapp01/75/Fimmda-191-2048.jpg)


![222
b) If the hedge is not found to be "highly effective" no set off will
be allowed and the underlying securities will be marked to
market as per the norms applicable to their respective
investment category.
c) Trading position in futures is not allowed. However, a hedge
may be temporarily rendered as not “highly effective”. Under
such circumstances, the relevant futures position will be
deemed as a trading position. All deemed trading positions
should be marked to market as a portfolio on a daily basis and
losses should be provided for and gains, if any, should be
ignored for the purpose of Profit & Loss Account. SCBs and
AIFIs should strive to restore their hedge effectiveness at the
earliest.
d) Any gains realized from closing out / settlement of futures
contracts can not be taken to Profit & Loss account but carried
forward as "Other Liability" and utilized for meeting
depreciation provisions on the investment portfolio.
vii) Capital adequacy : The net notional principal amount in respect of
futures position with same underlying and settlement dates should
be multiplied by the conversion factor given below to arrive at the
credit equivalent:
Original Maturity Conversion Factor
Less than one year 0.5 per cent
One year and less than two years 1.0 per cent
For each additional year 1.0 per cent
The credit equivalent thus obtained shall be multiplied by the
applicable risk weight of 100%.
viii) ALM classification: Interest rate futures are treated as a
combination of a long and short position in a notional government
security. The maturity of a future will be the period until delivery or
exercise of the contract, as also the life of the underlying
instrument. For example, a short position in interest rate future for
Rs. 50 crore [delivery date after 6 months, life of the notional
underlying government security 3½ years] is to be reported as a
risk sensitive asset under the 3 to 6 month bucket and a risk
sensitive liability in four years i.e. under the 3 to 5 year bucket.](https://image.slidesharecdn.com/fimmda-101119095005-phpapp01/75/Fimmda-223-2048.jpg)


![234
PVBP
Also called the Price Value of a Basis Point or Dollar Value of 01. This is one
way of quantifying the sensitivity of a bond to changes in the interest rates. If
the current price of the bond is P(0) and the price after a one basis point rise
in rates is P(1) then PVBP is -[P(1)-P(0)]. This can be estimated with the help
of the modified duration of a bond, as (Price of the bond * modified duration*
.0001)
Repo
Repo or Repurchase Agreements are short-term money market instruments.
Repo is nothing but collateralized borrowing and lending. In a repurchase
agreement securities are sold in a temporary sale with a promise to buy back
the securities at a future date at specified price. In reverse repos securities
are purchased in a temporary purchase with a promise to sell it back after a
specified number of days at a pre-specified price. When one is doing a repo, it
is reverse repo for the other party
Reverse Repo
See Repo
Risk Free Rate
An interest rate given out by an investment that has a zero probability of
default. Theoretically this rate can never exist in practice but sovereign debt
is used as the nearest proxy.
SGL
Subsidiary General Ledger Account is the demat facility for government
securities offered by the Reserve Bank of India. In the case of SGL facility the
securities remain in the computers of RBI by credit to the SGL account of the
owner. RBI offers SGL facility only to banks and primary dealers.
SLR
This is the acronym for Statutory Liquidity Ratio. That part of their Net
Demand and Time liabilities (NDTL) that a bank is required by law to be kept
invested in approved securities is known as SLR. The approved securities are
typically sovereign issues. The maintenance of SLR ensures a minimum
liquidity in the bank's assets.
Spread
Spread is the difference between two rates of interests. It is often generalised
to imply the difference between either price or yield. Spreads can be between
two risk classes or can be between tenors in the same risk class. For example
130 bps between AAA and GOI means a 1.30% spread between a AAA issue
and that made by the Government of India. 5 paisa spread between bid and
ask means that in the two way price quoted the difference between the buy
and sell price is 5 paisa 60 bps spread between 3 month T Bill over 10 Year](https://image.slidesharecdn.com/fimmda-101119095005-phpapp01/75/Fimmda-235-2048.jpg)


The document provides information about copyright and ownership of the content in the book titled "Debt Instruments and the Indian Debt Market". It states that the book, including all text, graphics, images, and data is the property of National Stock Exchange of India. The content from the book cannot be copied, reproduced, sold or used for commercial purposes without permission. It also cannot be stored or transmitted electronically or otherwise.


