Download to read offline


![Academic Version
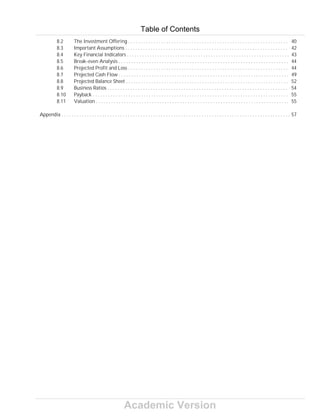
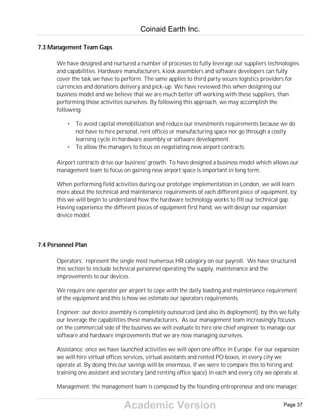
time a passenger has between she has checked-in and the flight departs. We call this variable
"elapsed time".
Elapsed time = Boarding time - Check-in time (result in minutes);
We will say that the variable "elapsed time" has a Uniform distribution divided in four groups
with .25 probability of success on each case.
U [0,25;4] ~ x1,x2,x3,x4 (x being the group of passengers ordered by their 'elapsed time');
• The first group represents passenger that have arrived with 02:00-01:30 hours before
departure,
• the second group represent those passenger who have arrived with 01:30-01:00,
• the third group with 01:00-00:30 and,
• the last goup has just half an hour of time left to board the plain after checked in.
Our hypothesis is that the usage probability depends on the spare time passengers have once at
the airport, and that the this distribution is uniform (therefore, we are assuming that prior to use
our currency exchange services or to use our donation rechanneling services, users will - only -
take into consideration the correct timing of their own flight schedule).
The probability of success or probability of usage, for each group (x1....x4) can be expressed by
this the function f(xi) = 1/3^xi
"Elapsed time" f(xi)
02:00-01:30................................... 1/3
01:30-01:00................................... 1/9
01:00-00:30................................... 1/27
00:30-00:00................................... = 1/81
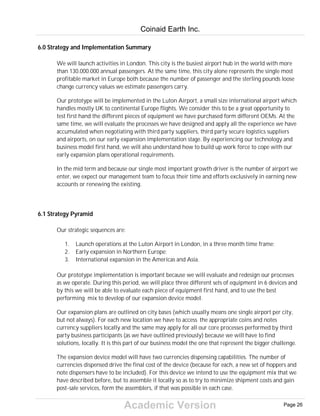
f(xi) represents the probability of usage per group, and since each 'elapsed time' group of
passengers is uniformally distributed into 4 groups, the probability for each group is 0,25. Hence,
when we are trying to estimate our total transactions in relation to the size market, we multiply
the probability of each group times its probability of usage and this times the 'total potential
passengers' and the 'average value of loose change' that they carry ('size of the market').
Therefore, on an airport with 18 million passenger a year, about half, 9 million, depart form that
destination to another. Hence the probability of usage could be expressed using the following
mathematical equation:
Probability of usage = .25*1/3+.25*1/9+.25*1/27+.25*1/81
Since the average loose change carried by passenger is 3 pounds, the total transactions we expect
to perform are calculated the following way:
Coinaid Earth Inc.
Page 32](https://image.slidesharecdn.com/coinaidearthpilot-101110075941-phpapp02/85/Coinaid-earth-pilot-36-320.jpg)
![Academic Version
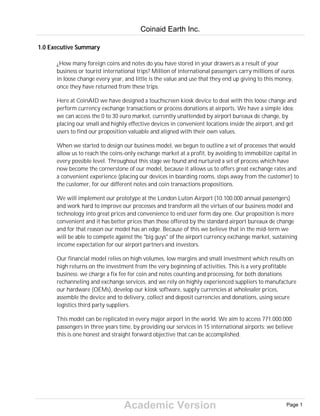
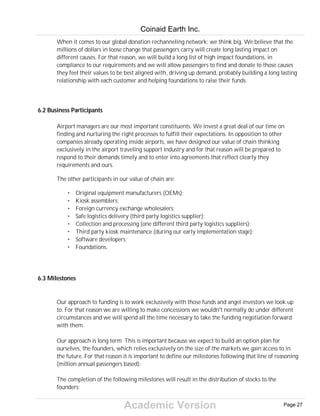
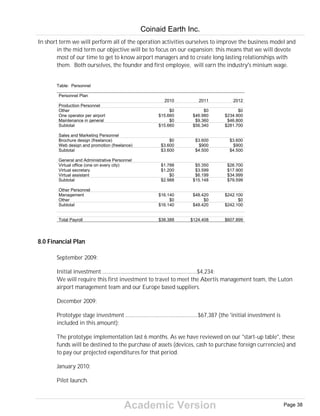
= ( .25*1/3+.25*1/9+.25*1/27+.25*0 ) * 3 * (Total Potential Customers);
To estimate our income, we would have to apply our service fee to the total number of transaction
performed. If we would charge 12,5% fee for coins and notes counting and processing, the
equation would look like this:
= [ ( .25*1/3+.25*1/9+.25*1/27+.25*0 ) * 3 * Total Potential Customers ] * 0.125;
When estimating our income on a particular region, northern Europe for example, the equation
would be the following:
= [ 3 * ( (0.0528902 * U.K.) + (0.05649635 * Scandinavian) ) ] * 0.125.
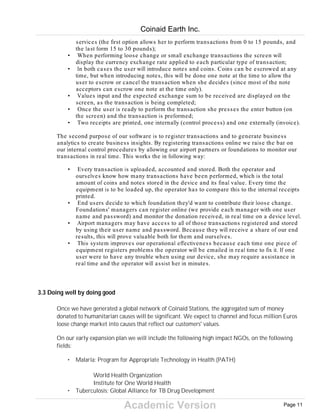
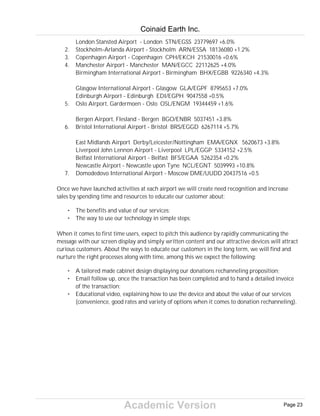
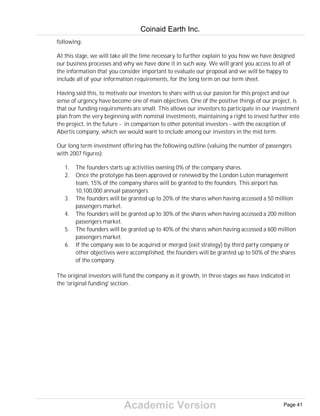
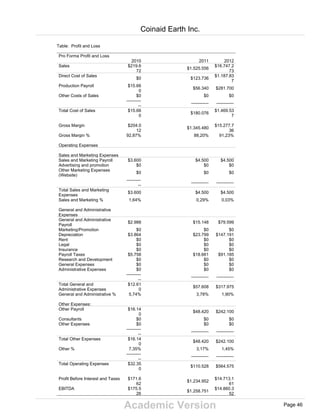
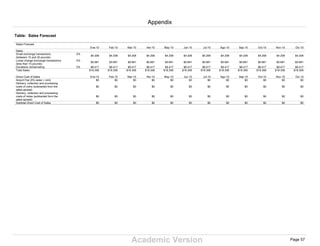
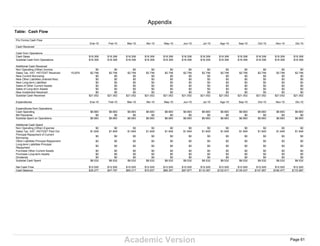
Table: Sales Forecast
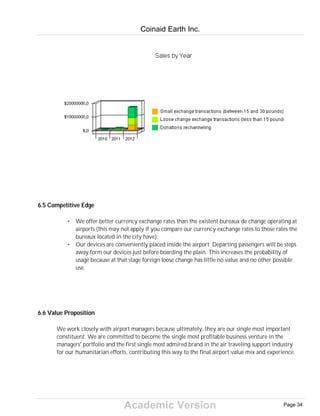
Sales Forecast
2010 2011 2012
Sales
Small exchange transactions
(between 15 and 30 pounds)
$50.496 $350.473 $3.849.695
Loose change exchange
transactions (less than 15 pounds)
$68.172 $473.155 $5.197.272
Donations rechanneling $101.004 $701.928 $7.700.306
Total Sales $219.672 $1.525.556 $16.747.273
Direct Cost of Sales 2010 2011 2012
Airport Fee (5% sales + rent) $0 $123.736 $1.187.837
Delivery, collection and processing
costs of coins (subtracted from the
sales spread)
$0 $0 $0
Delivery, collection and processing
costs of notes (subtracted form the
sales spread)
$0 $0 $0
Subtotal Direct Cost of Sales $0 $123.736 $1.187.837
Coinaid Earth Inc.
Page 33](https://image.slidesharecdn.com/coinaidearthpilot-101110075941-phpapp02/85/Coinaid-earth-pilot-37-320.jpg)
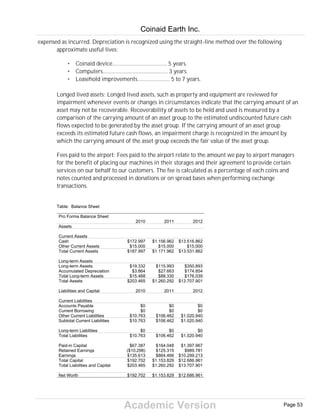

This document outlines the business plan for Coinaid Earth Project, which aims to install coin exchange machines around the world to facilitate donations for environmental causes. The key aspects of the plan are: 1. The company will install coin exchange machines in high traffic locations like airports and train stations that will allow travelers to exchange coins for bills and donate the cash value to environmental charities. 2. The machines will be funded through an investment offering and will generate revenue through exchange fees from users. 3. Financial projections estimate the company will break even within 3 years and become profitable thereafter, with strong growth potential as more machines are installed globally.


![NPY Rule Book [constitution] catsi act approved at 14.11.08](https://cdn.slidesharecdn.com/ss_thumbnails/npyrulebookconstitutioncatsiactapprovedat14-11-08-120524022757-phpapp02-thumbnail.jpg?width=640&height=640&fit=bounds)


