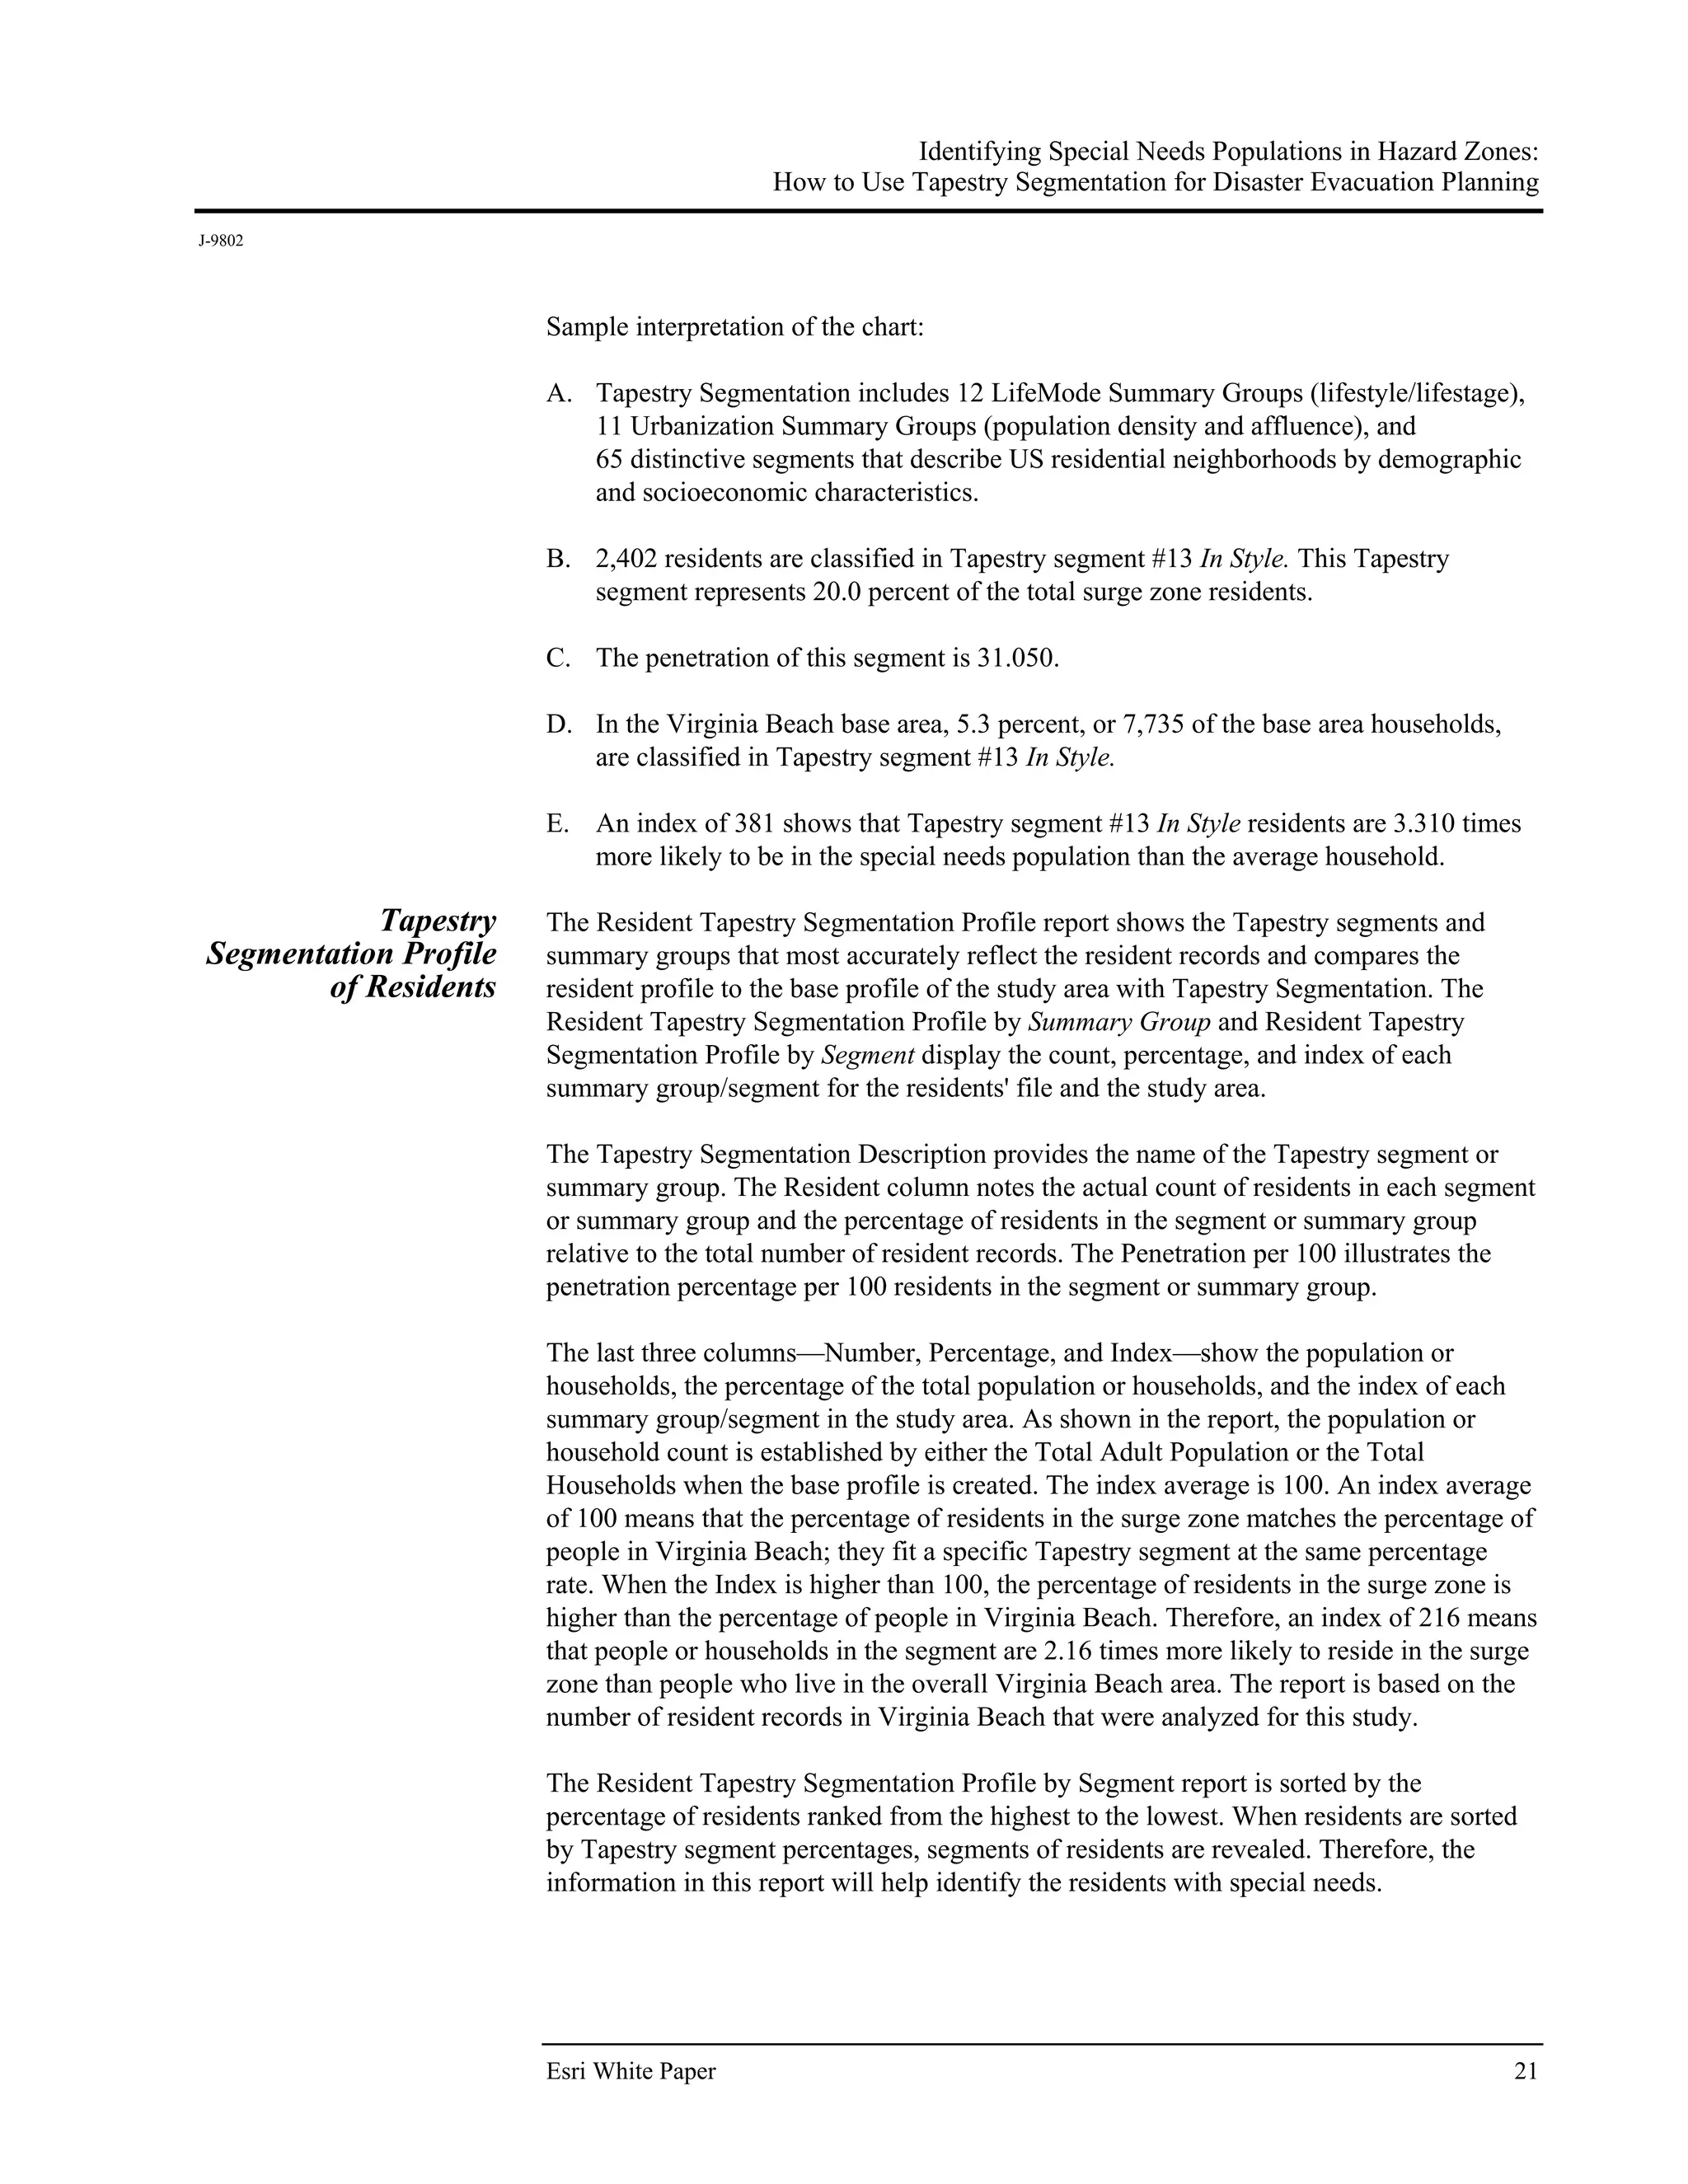
Download to read offline
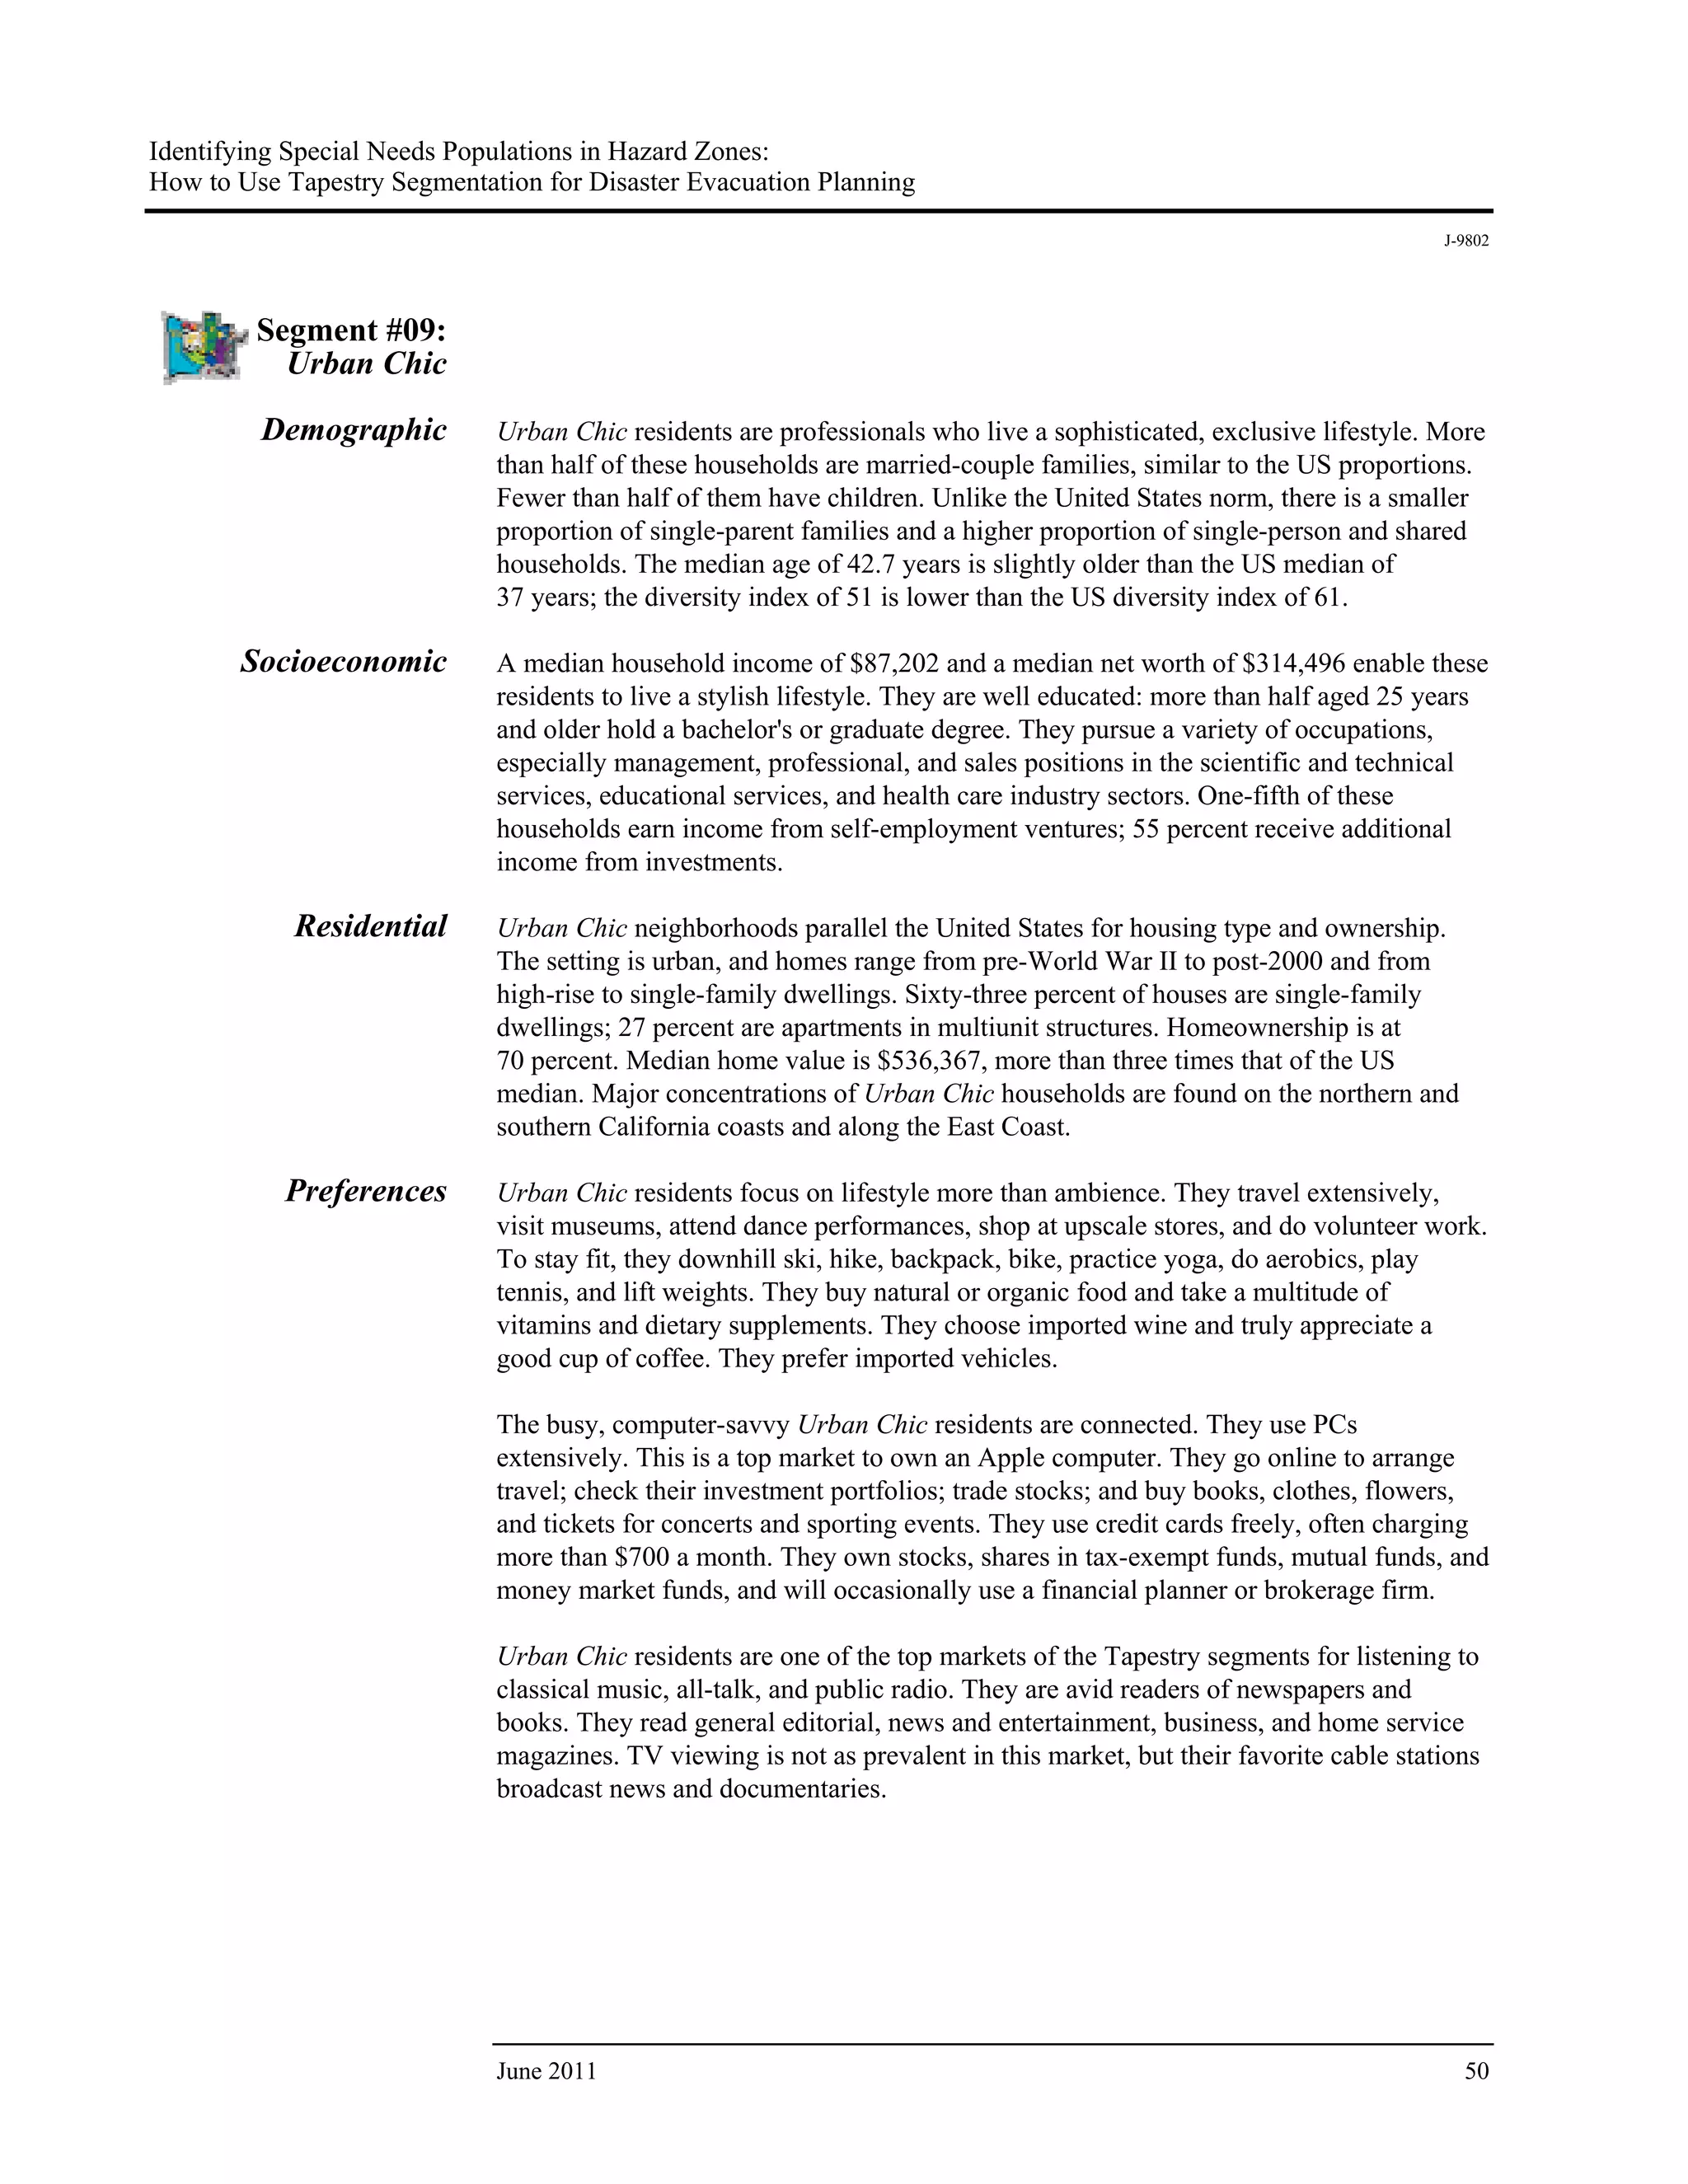
![Identifying Special Needs Populations in Hazard Zones:
How to Use Tapestry Segmentation for Disaster Evacuation Planning
J-9802
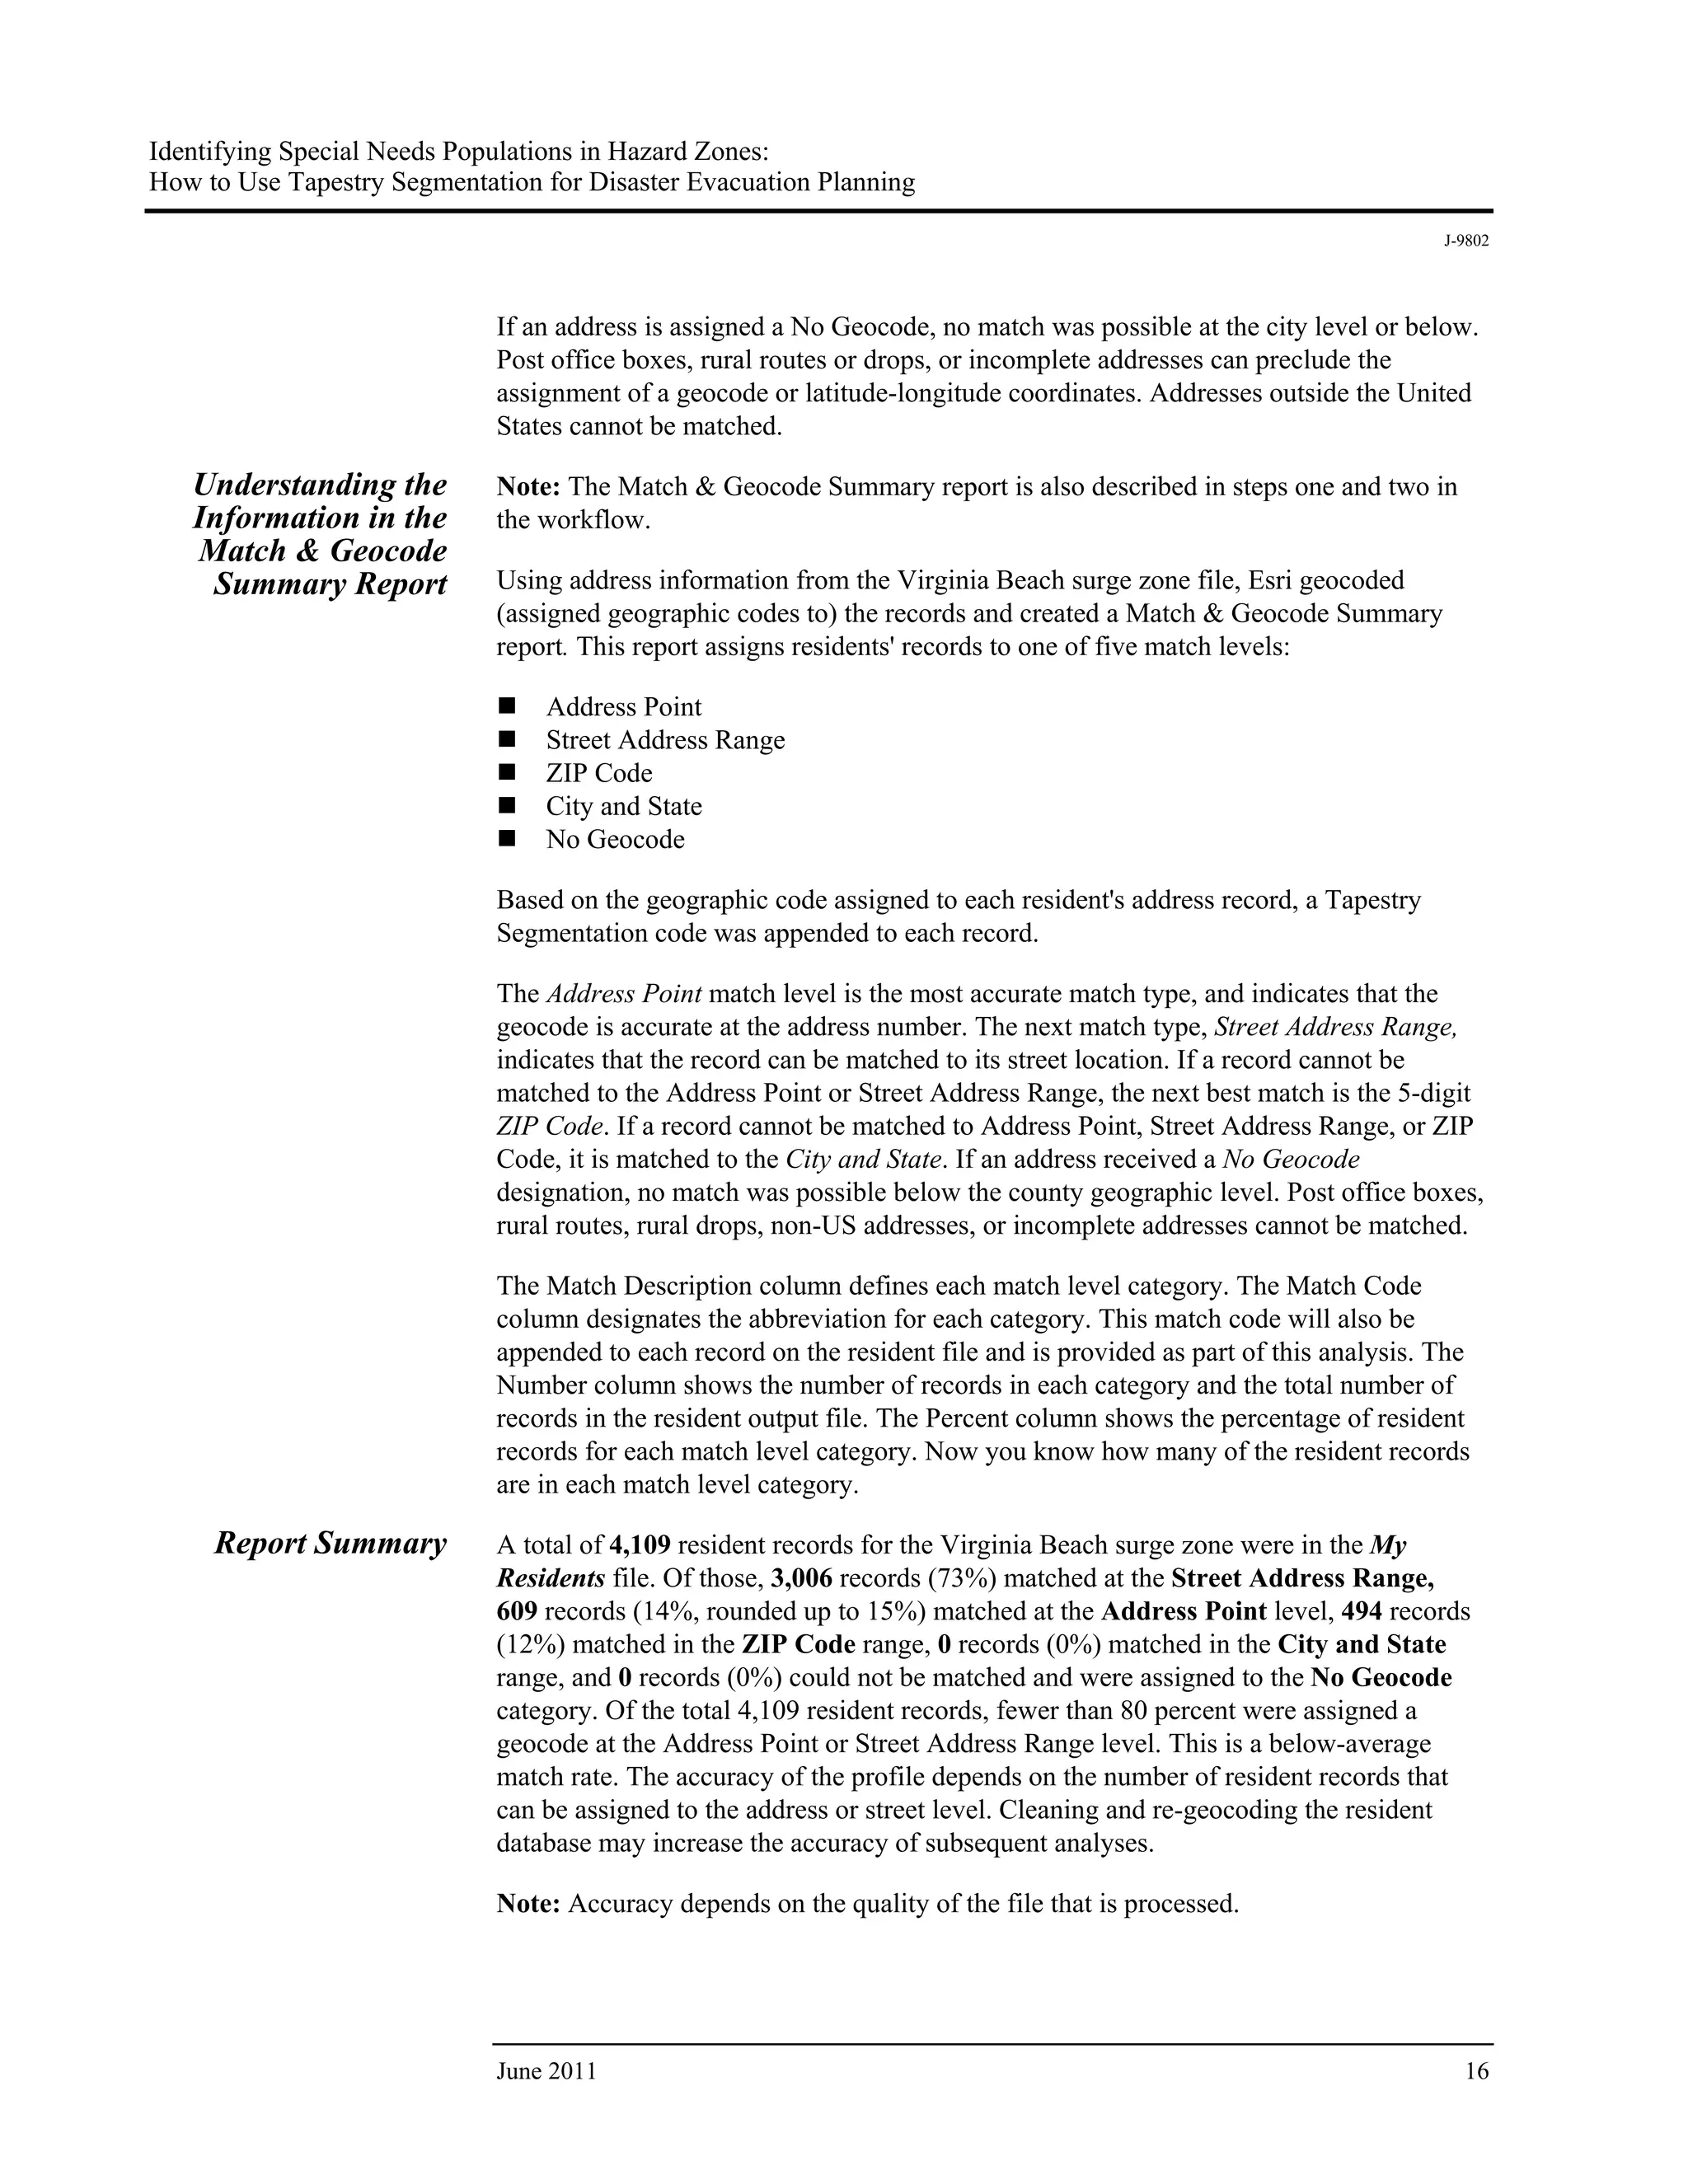
Records that were not matched at the designated level are noted at the bottom of the
report.
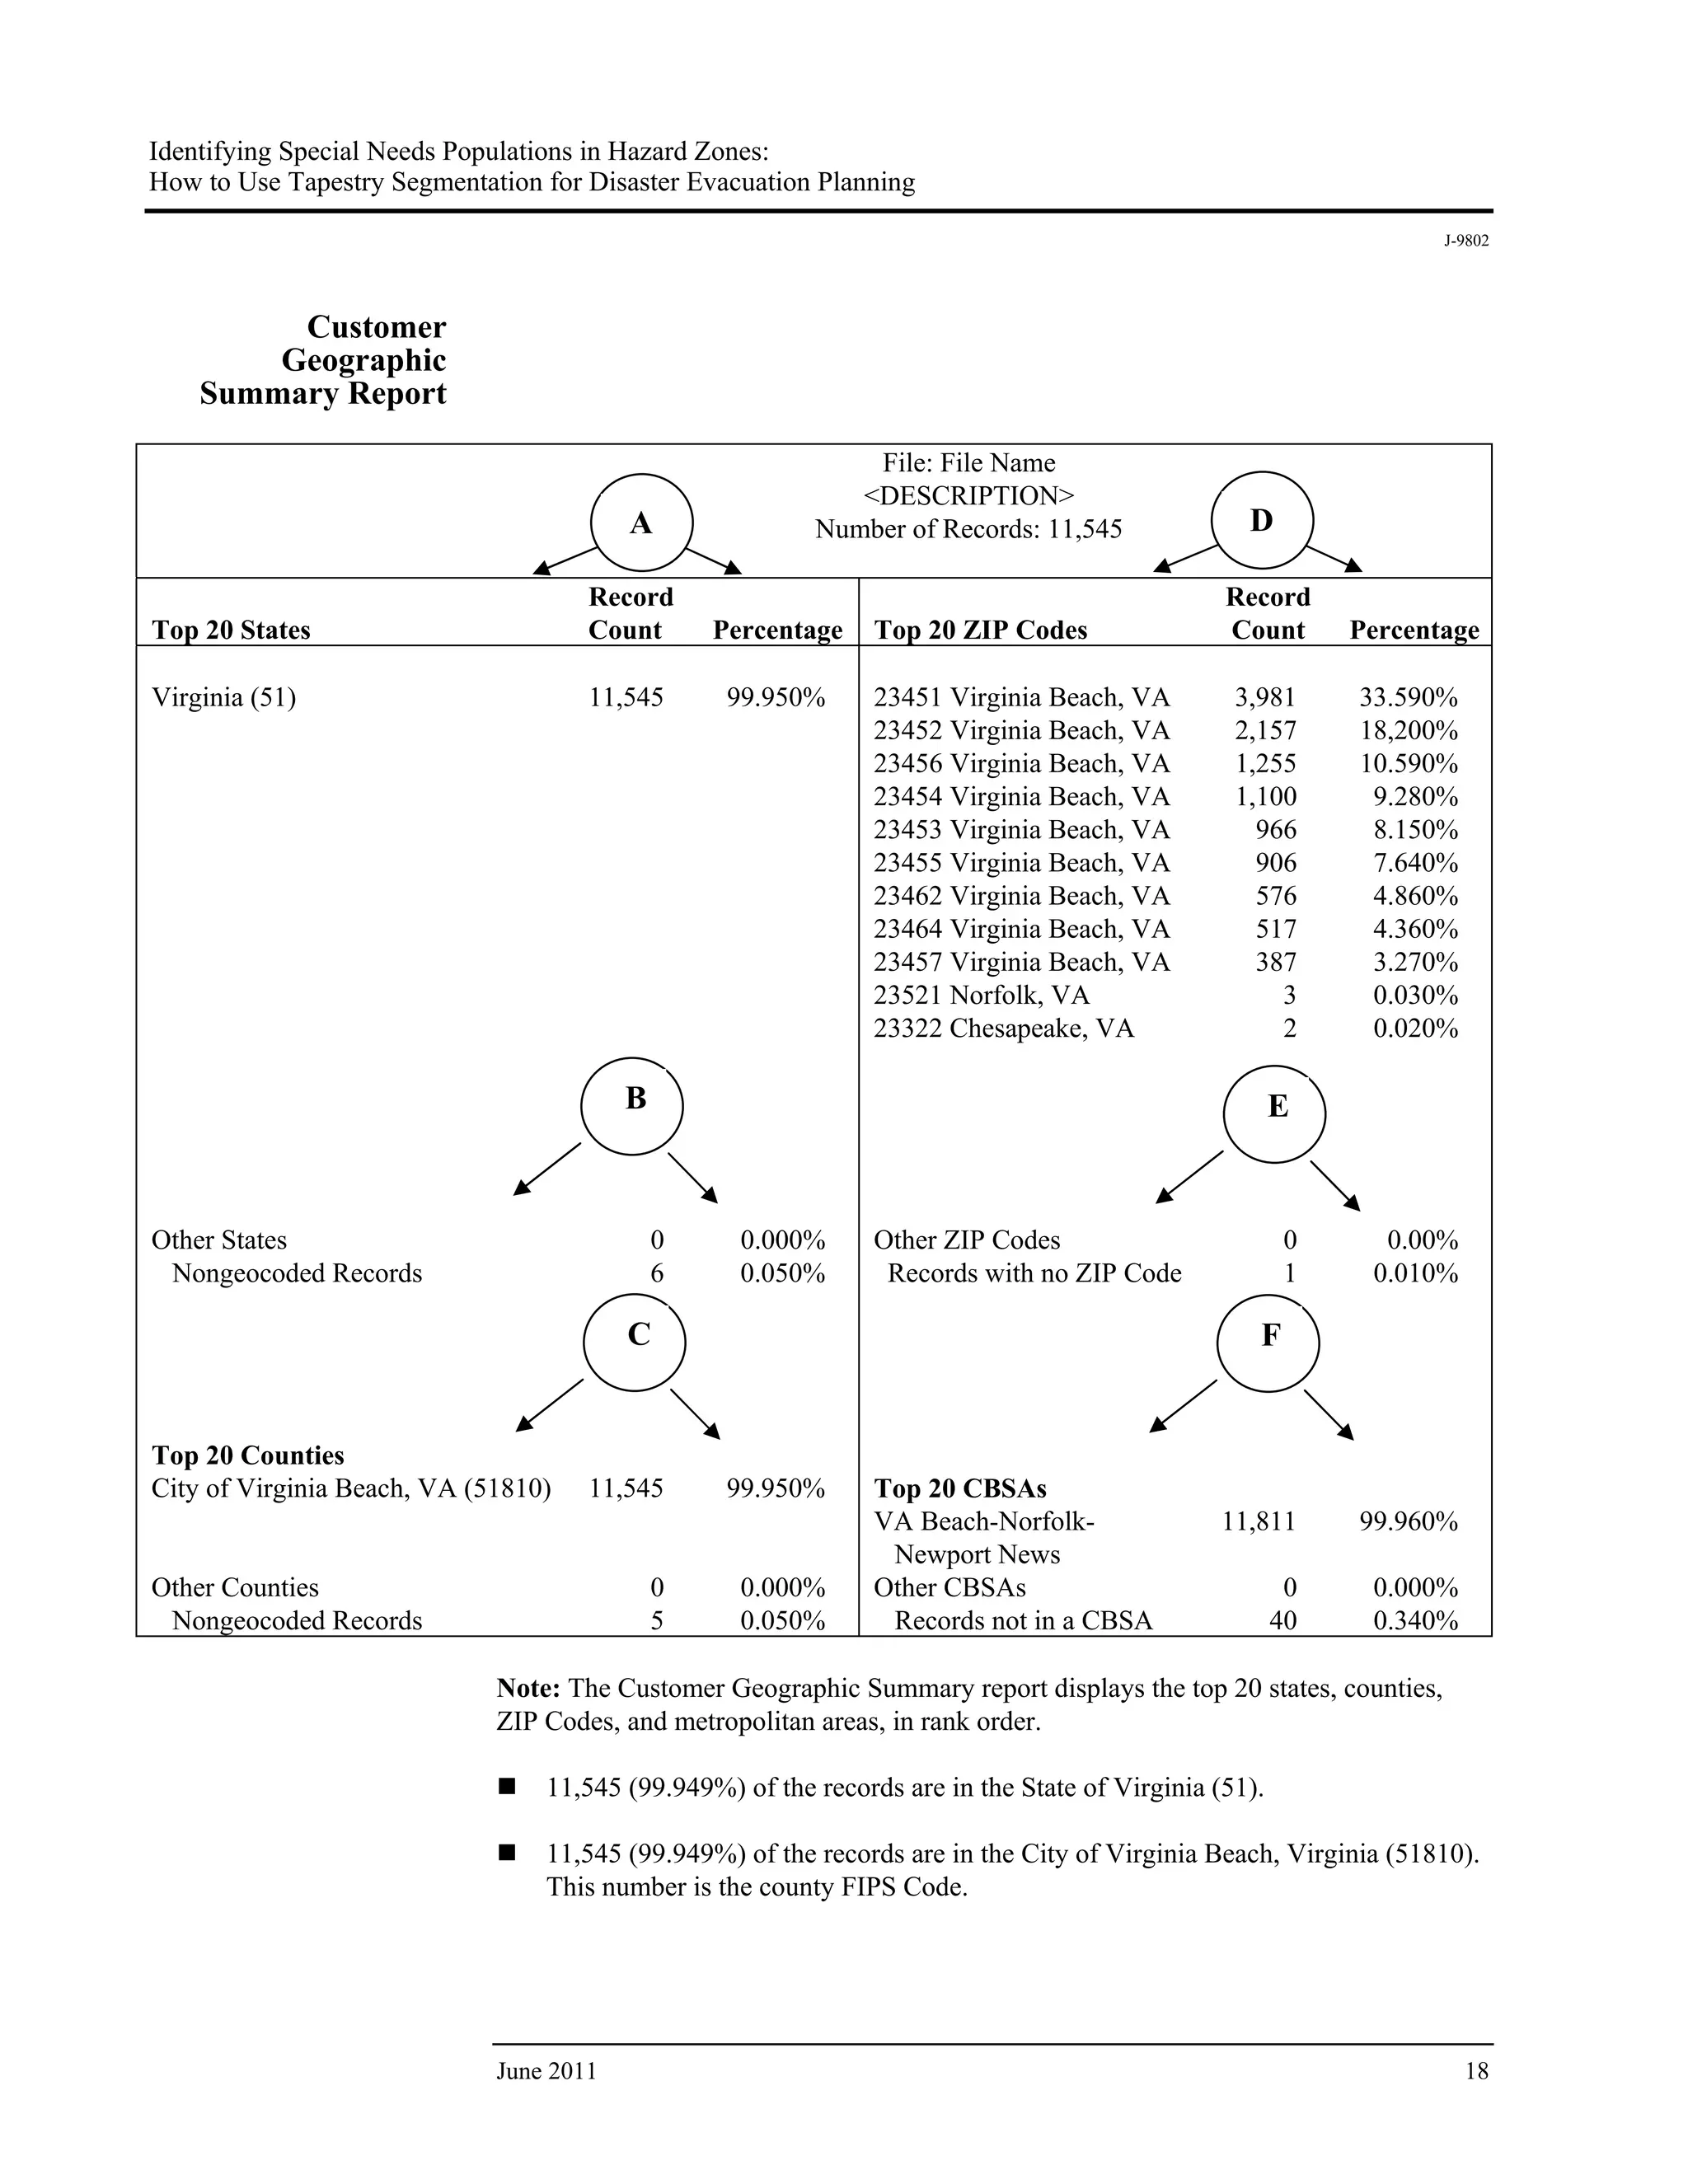
23451, Virginia Beach, Virginia, is the top-ranked ZIP Code. 3,981 (33.592%) of the
records are in this ZIP Code.
Other than the top 20 ZIP Codes, no other ZIP Codes (0.000%) are represented in the
file.
11,811 (99.662%) of the records are located in the Virginia Beach-Norfolk-Newport
News, Virginia-North Carolina metropolitan area (47260).
Geographic Resident
Summary Report
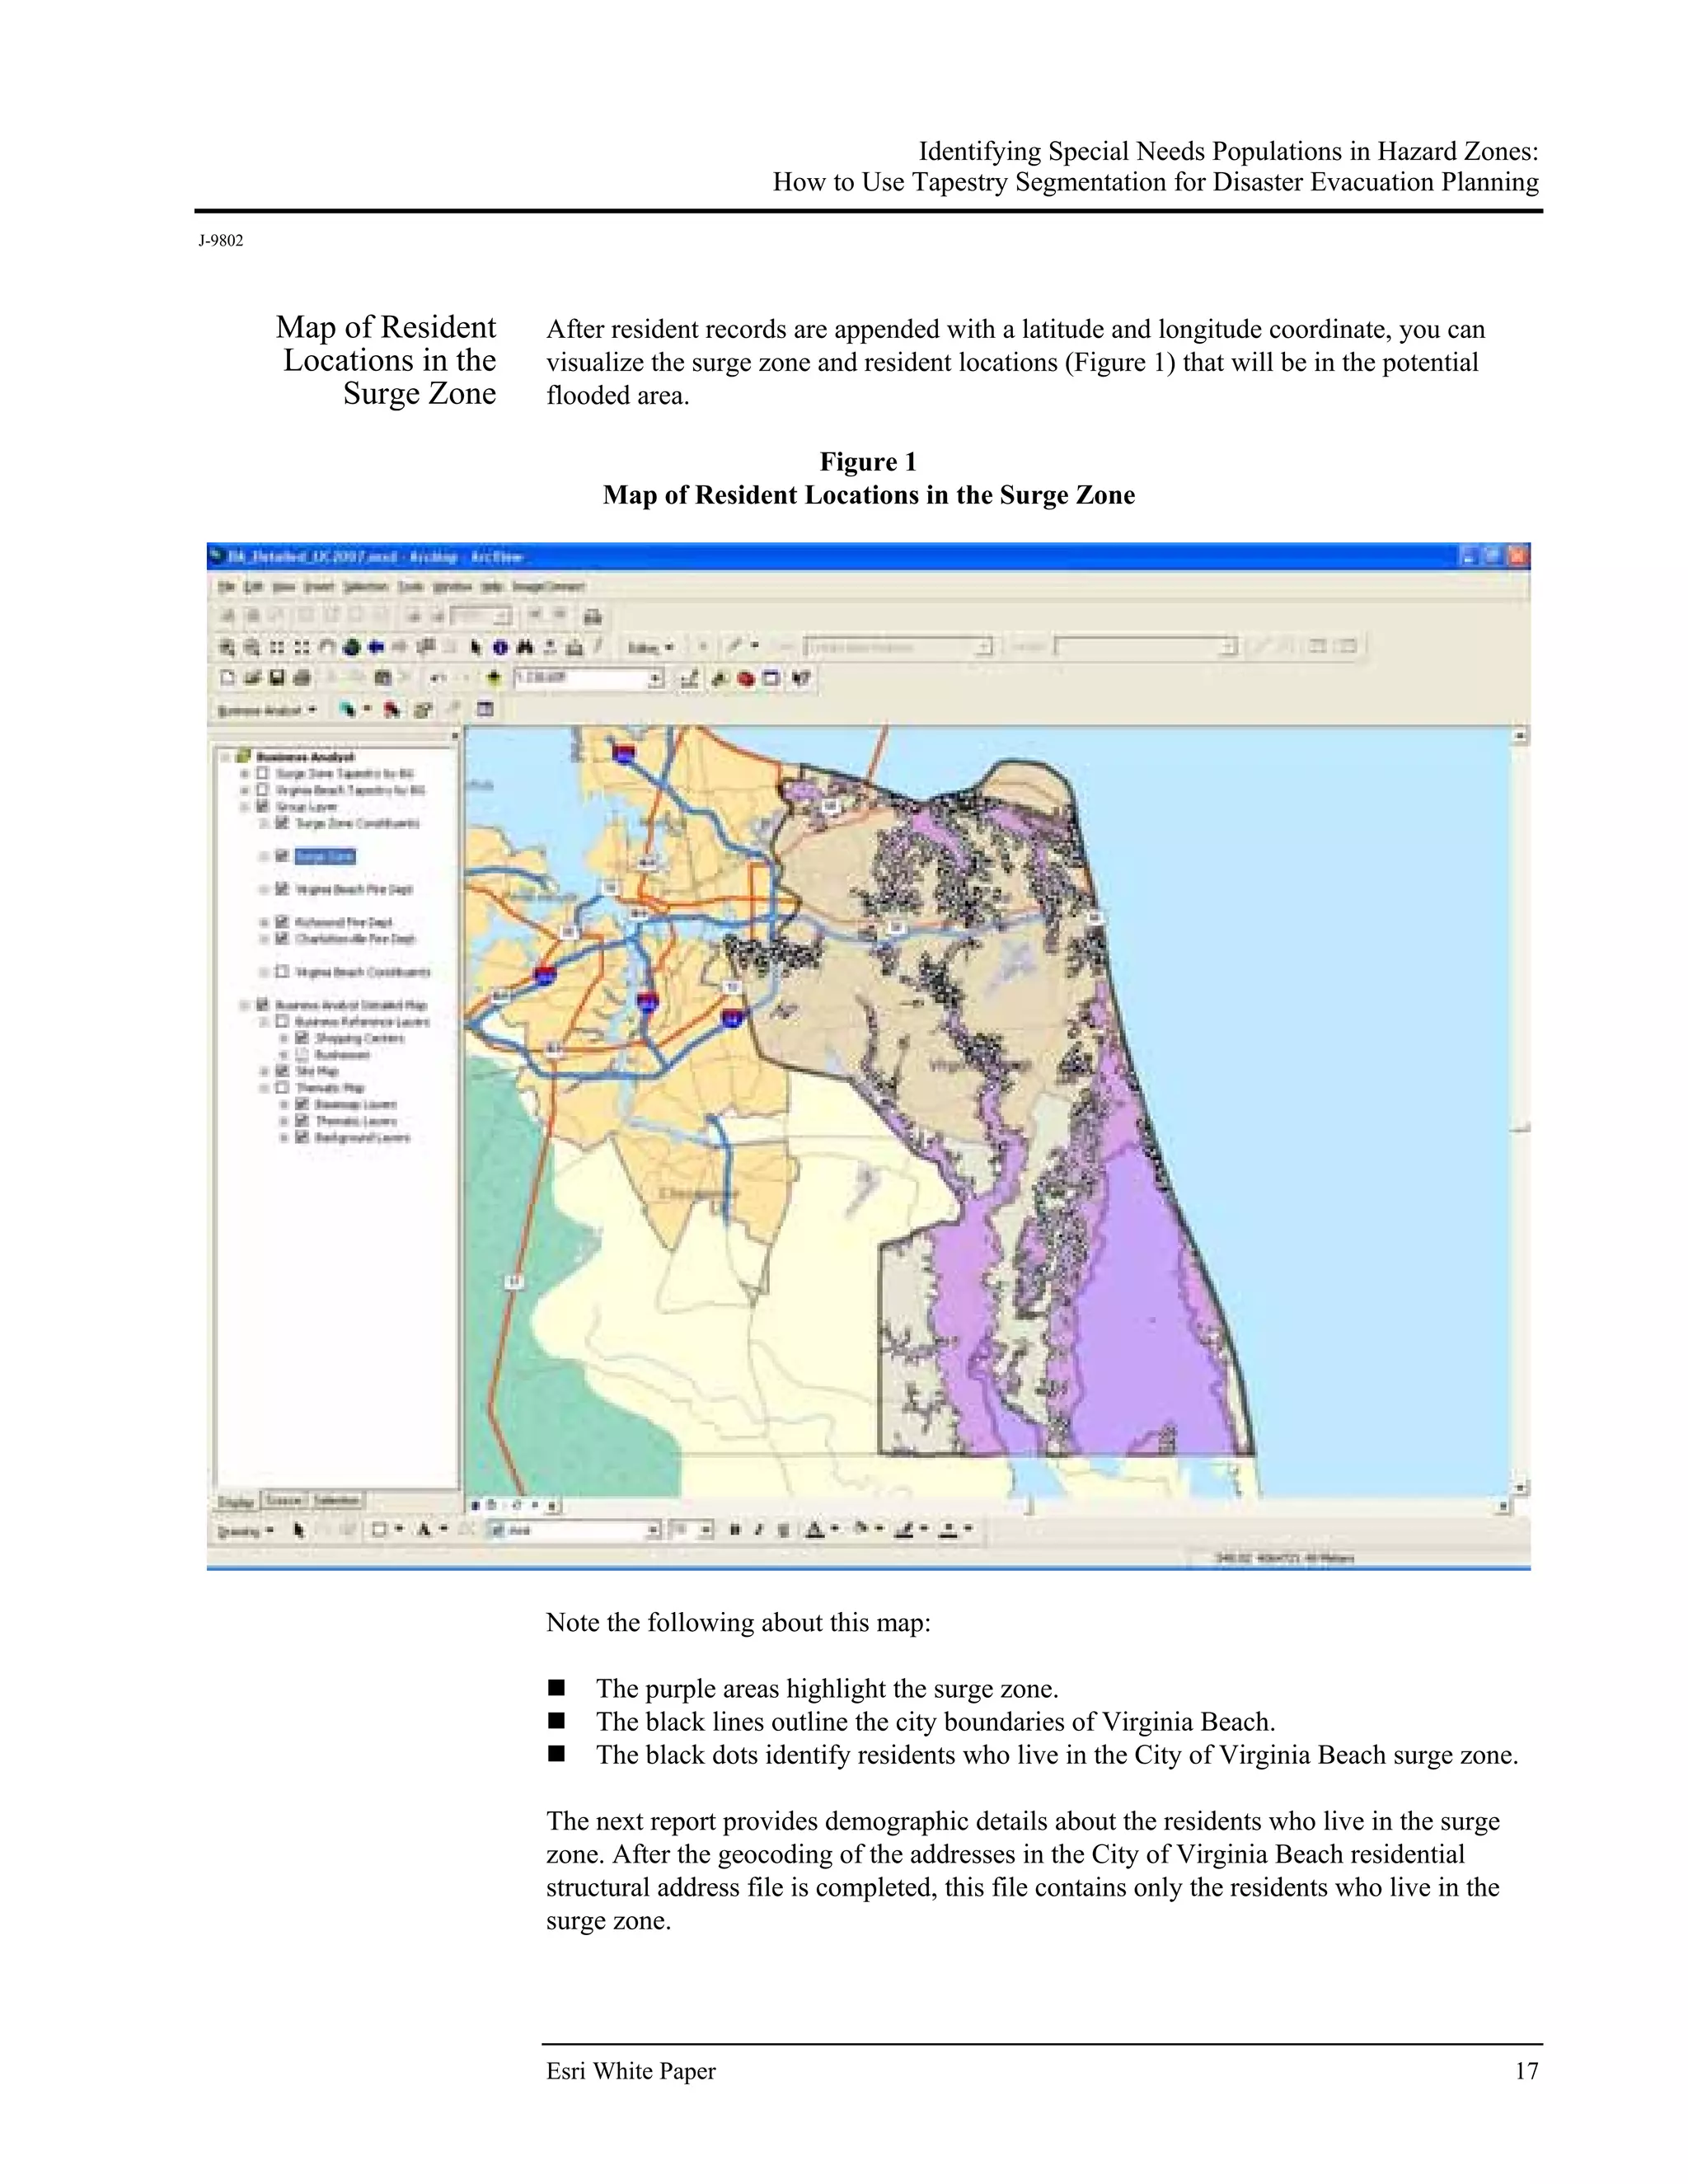
Understanding Knowing about the neighborhoods where the special needs populations live is another
Where Residents Live important aspect of understanding their requirements before, during, and after an
evacuation. It is necessary to learn about local commuting patterns, locations of shopping
districts, and other factors that will impact an evacuation. Knowing about the
neighborhoods where the residents live enables you to target public service
announcement (PSA) messages, such as community service direct mail campaigns to
residents in specific geographic areas, instead of mailing one message to the entire city.
You can use the information in this report to identify neighborhoods where most of the
current residents live. To find the top 20 geographic areas in Virginia Beach, this report
summarizes the resident records at the state, county, ZIP Code, and core-based statistical
area (CBSA) geographic levels. Each record is assigned at the state, county, ZIP Code,
and CBSA geographic levels according to a point-in-polygon approach based on the
record's latitude and longitude. [Note: The Locator (LOC_NAME) field in the output file
identifies the match levels of the latitude and longitude for every address record.] Each
geographic level is analyzed according to the record count and percentages of the match
levels. Records that are not matched are noted at the end of each section.
This report lists the percentages of residents who live in each geographic area, ranked
high to low, based on results from the geocoding process. This information reveals where
you should concentrate community service PSA messaging efforts.
Esri White Paper 19](https://image.slidesharecdn.com/tapestry-segmentation-for-disaster-120430160128-phpapp01/75/Identifying-Special-Needs-Populations-in-Hazard-Zones-24-2048.jpg)
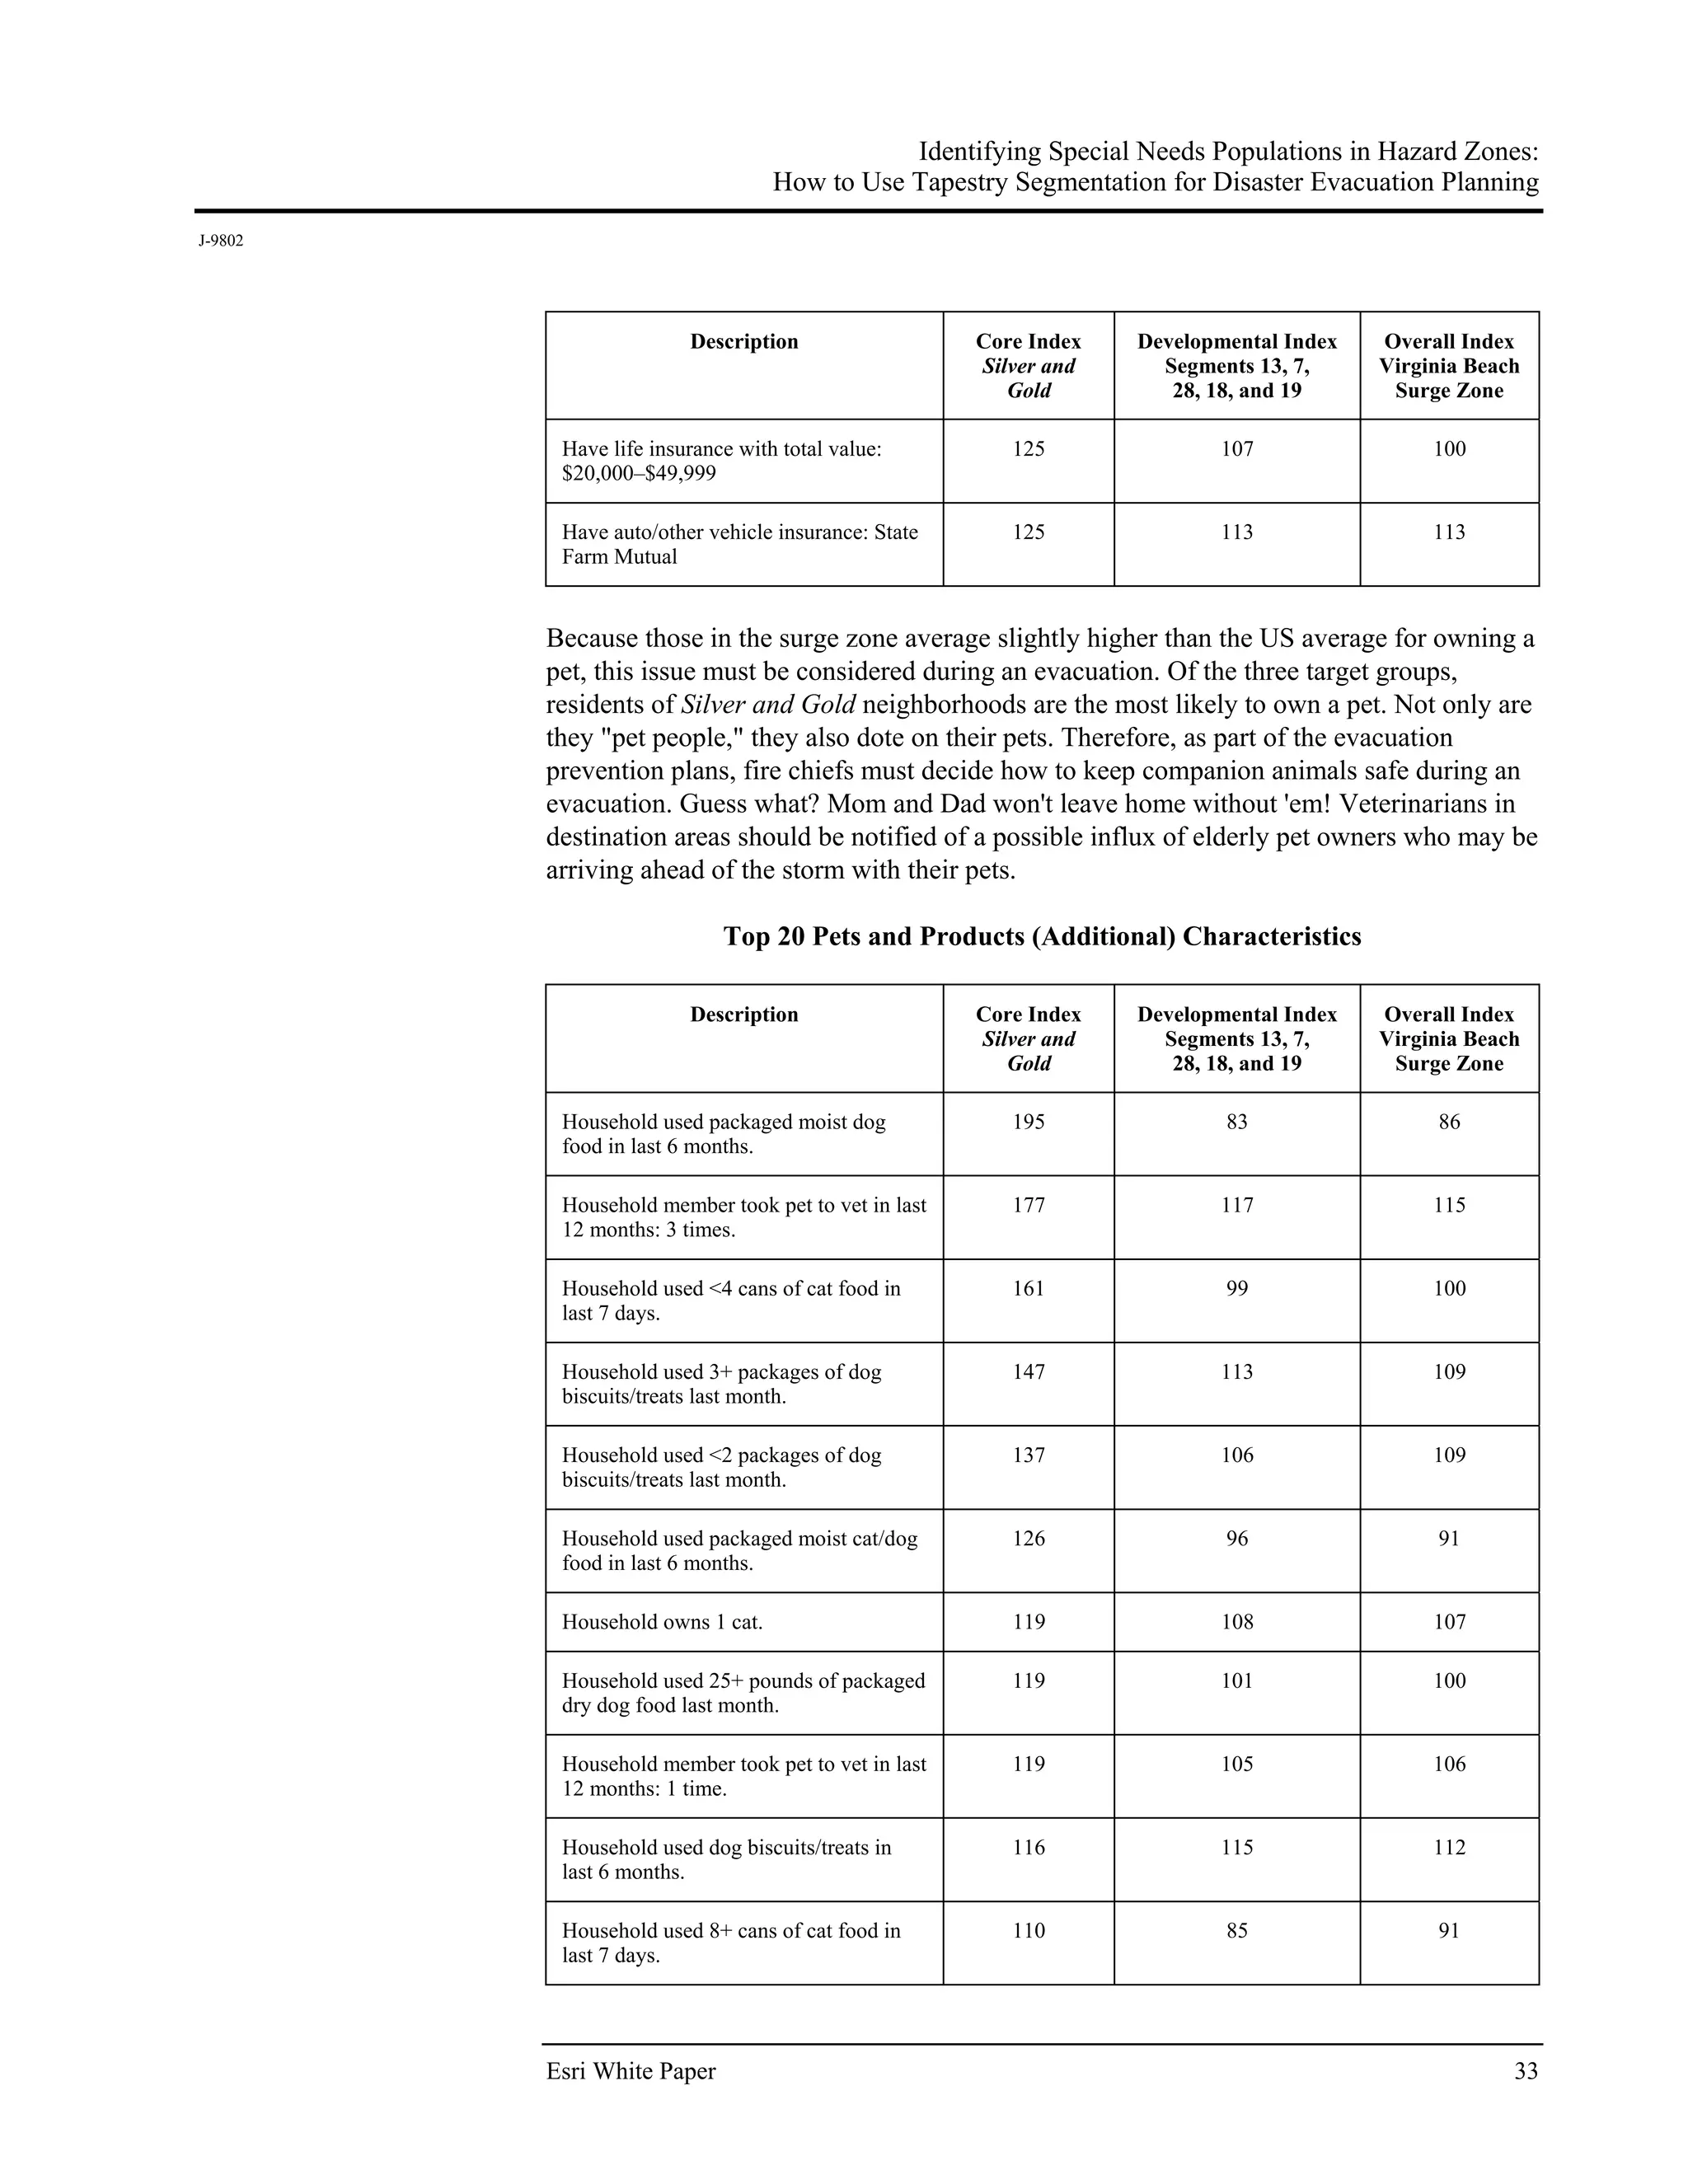
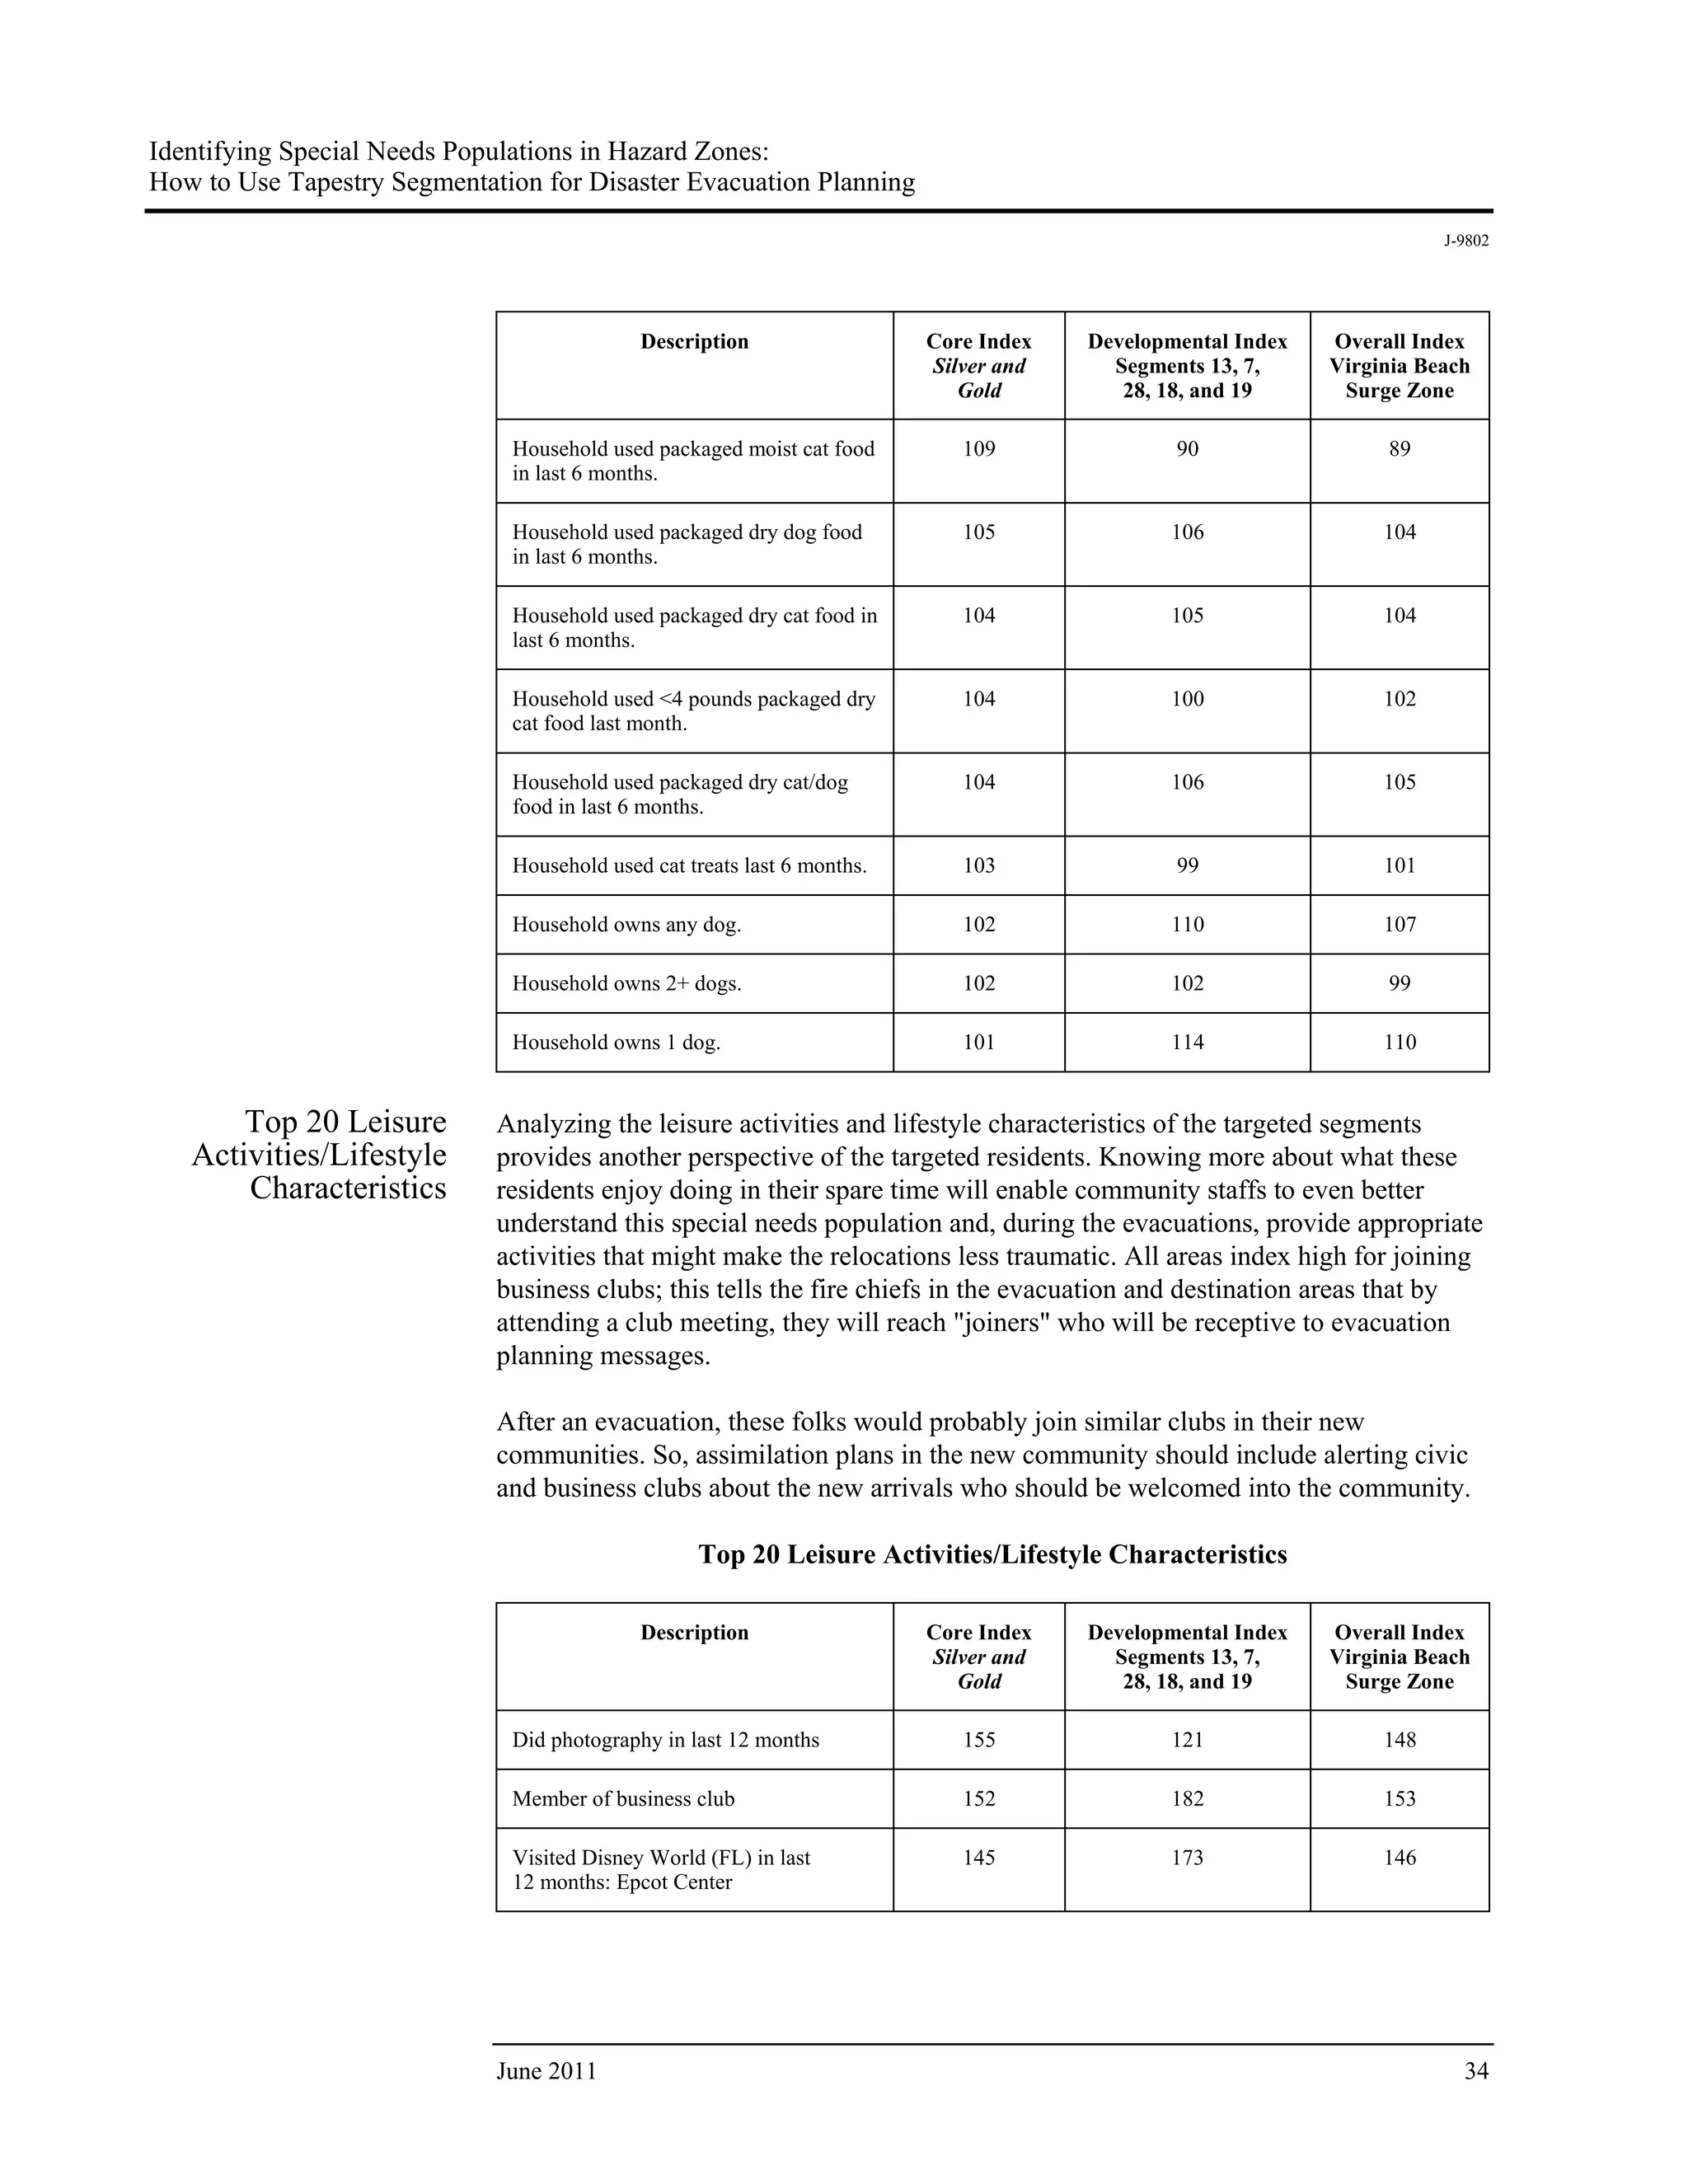
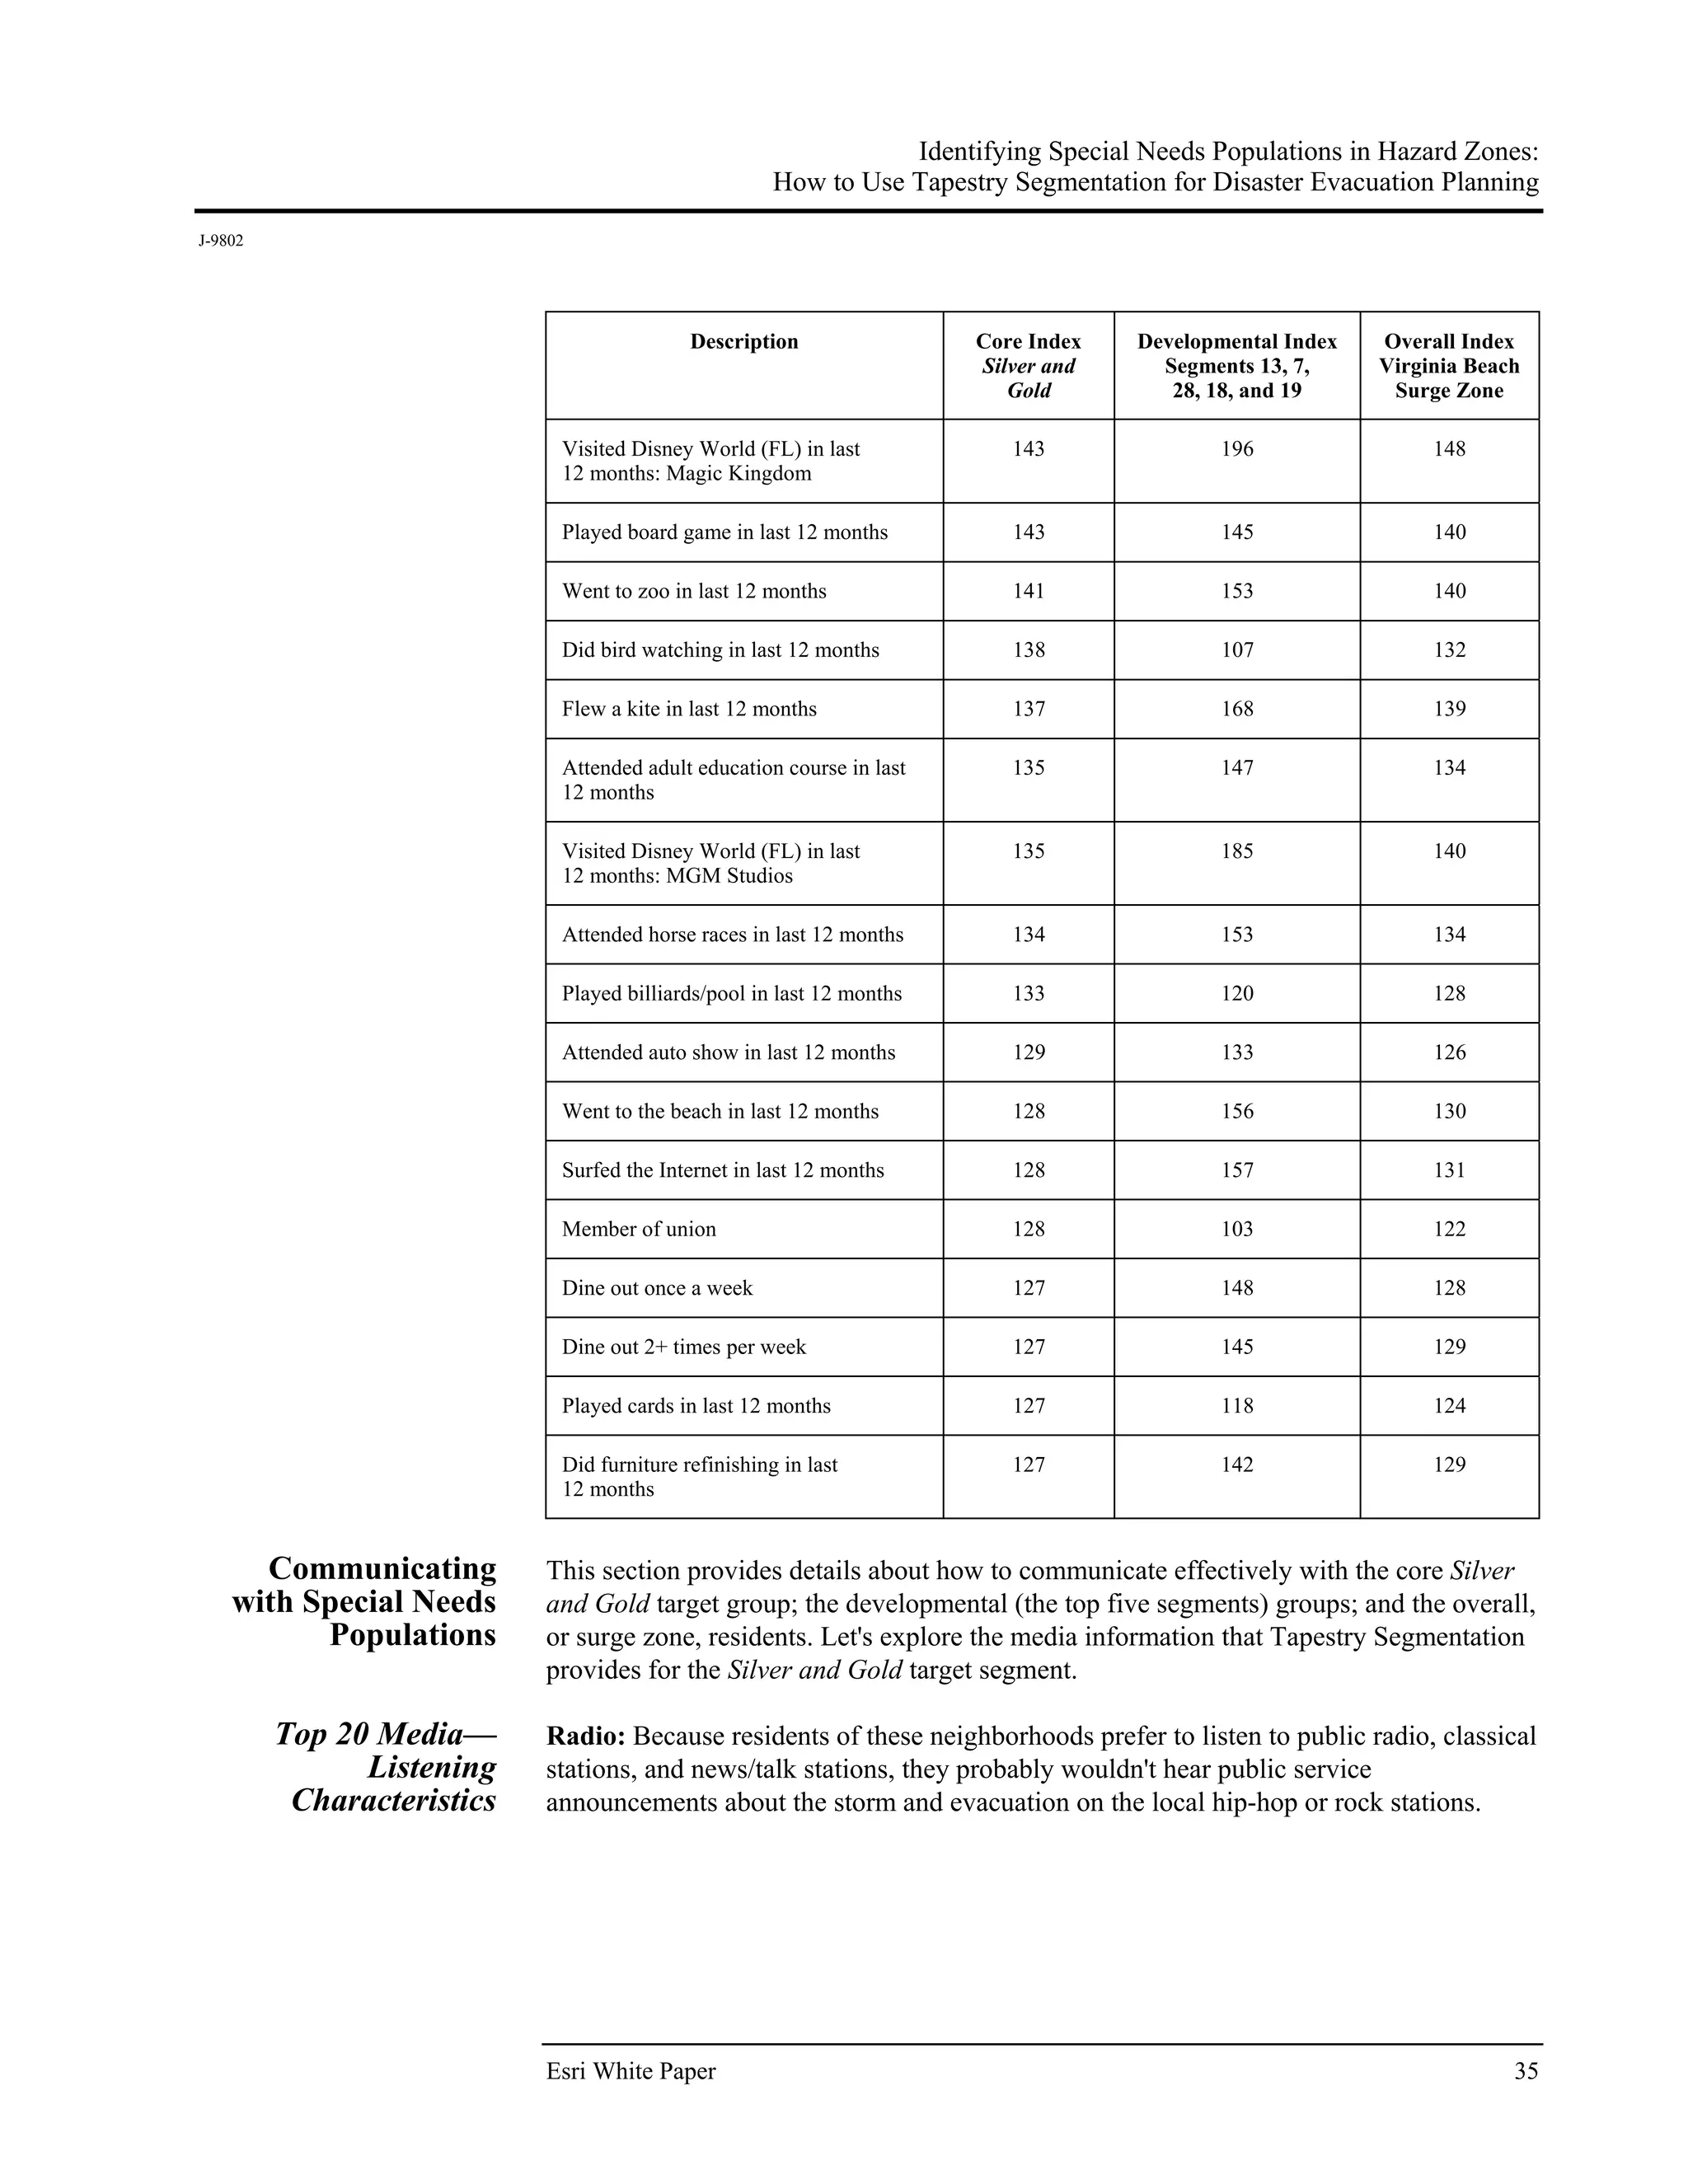
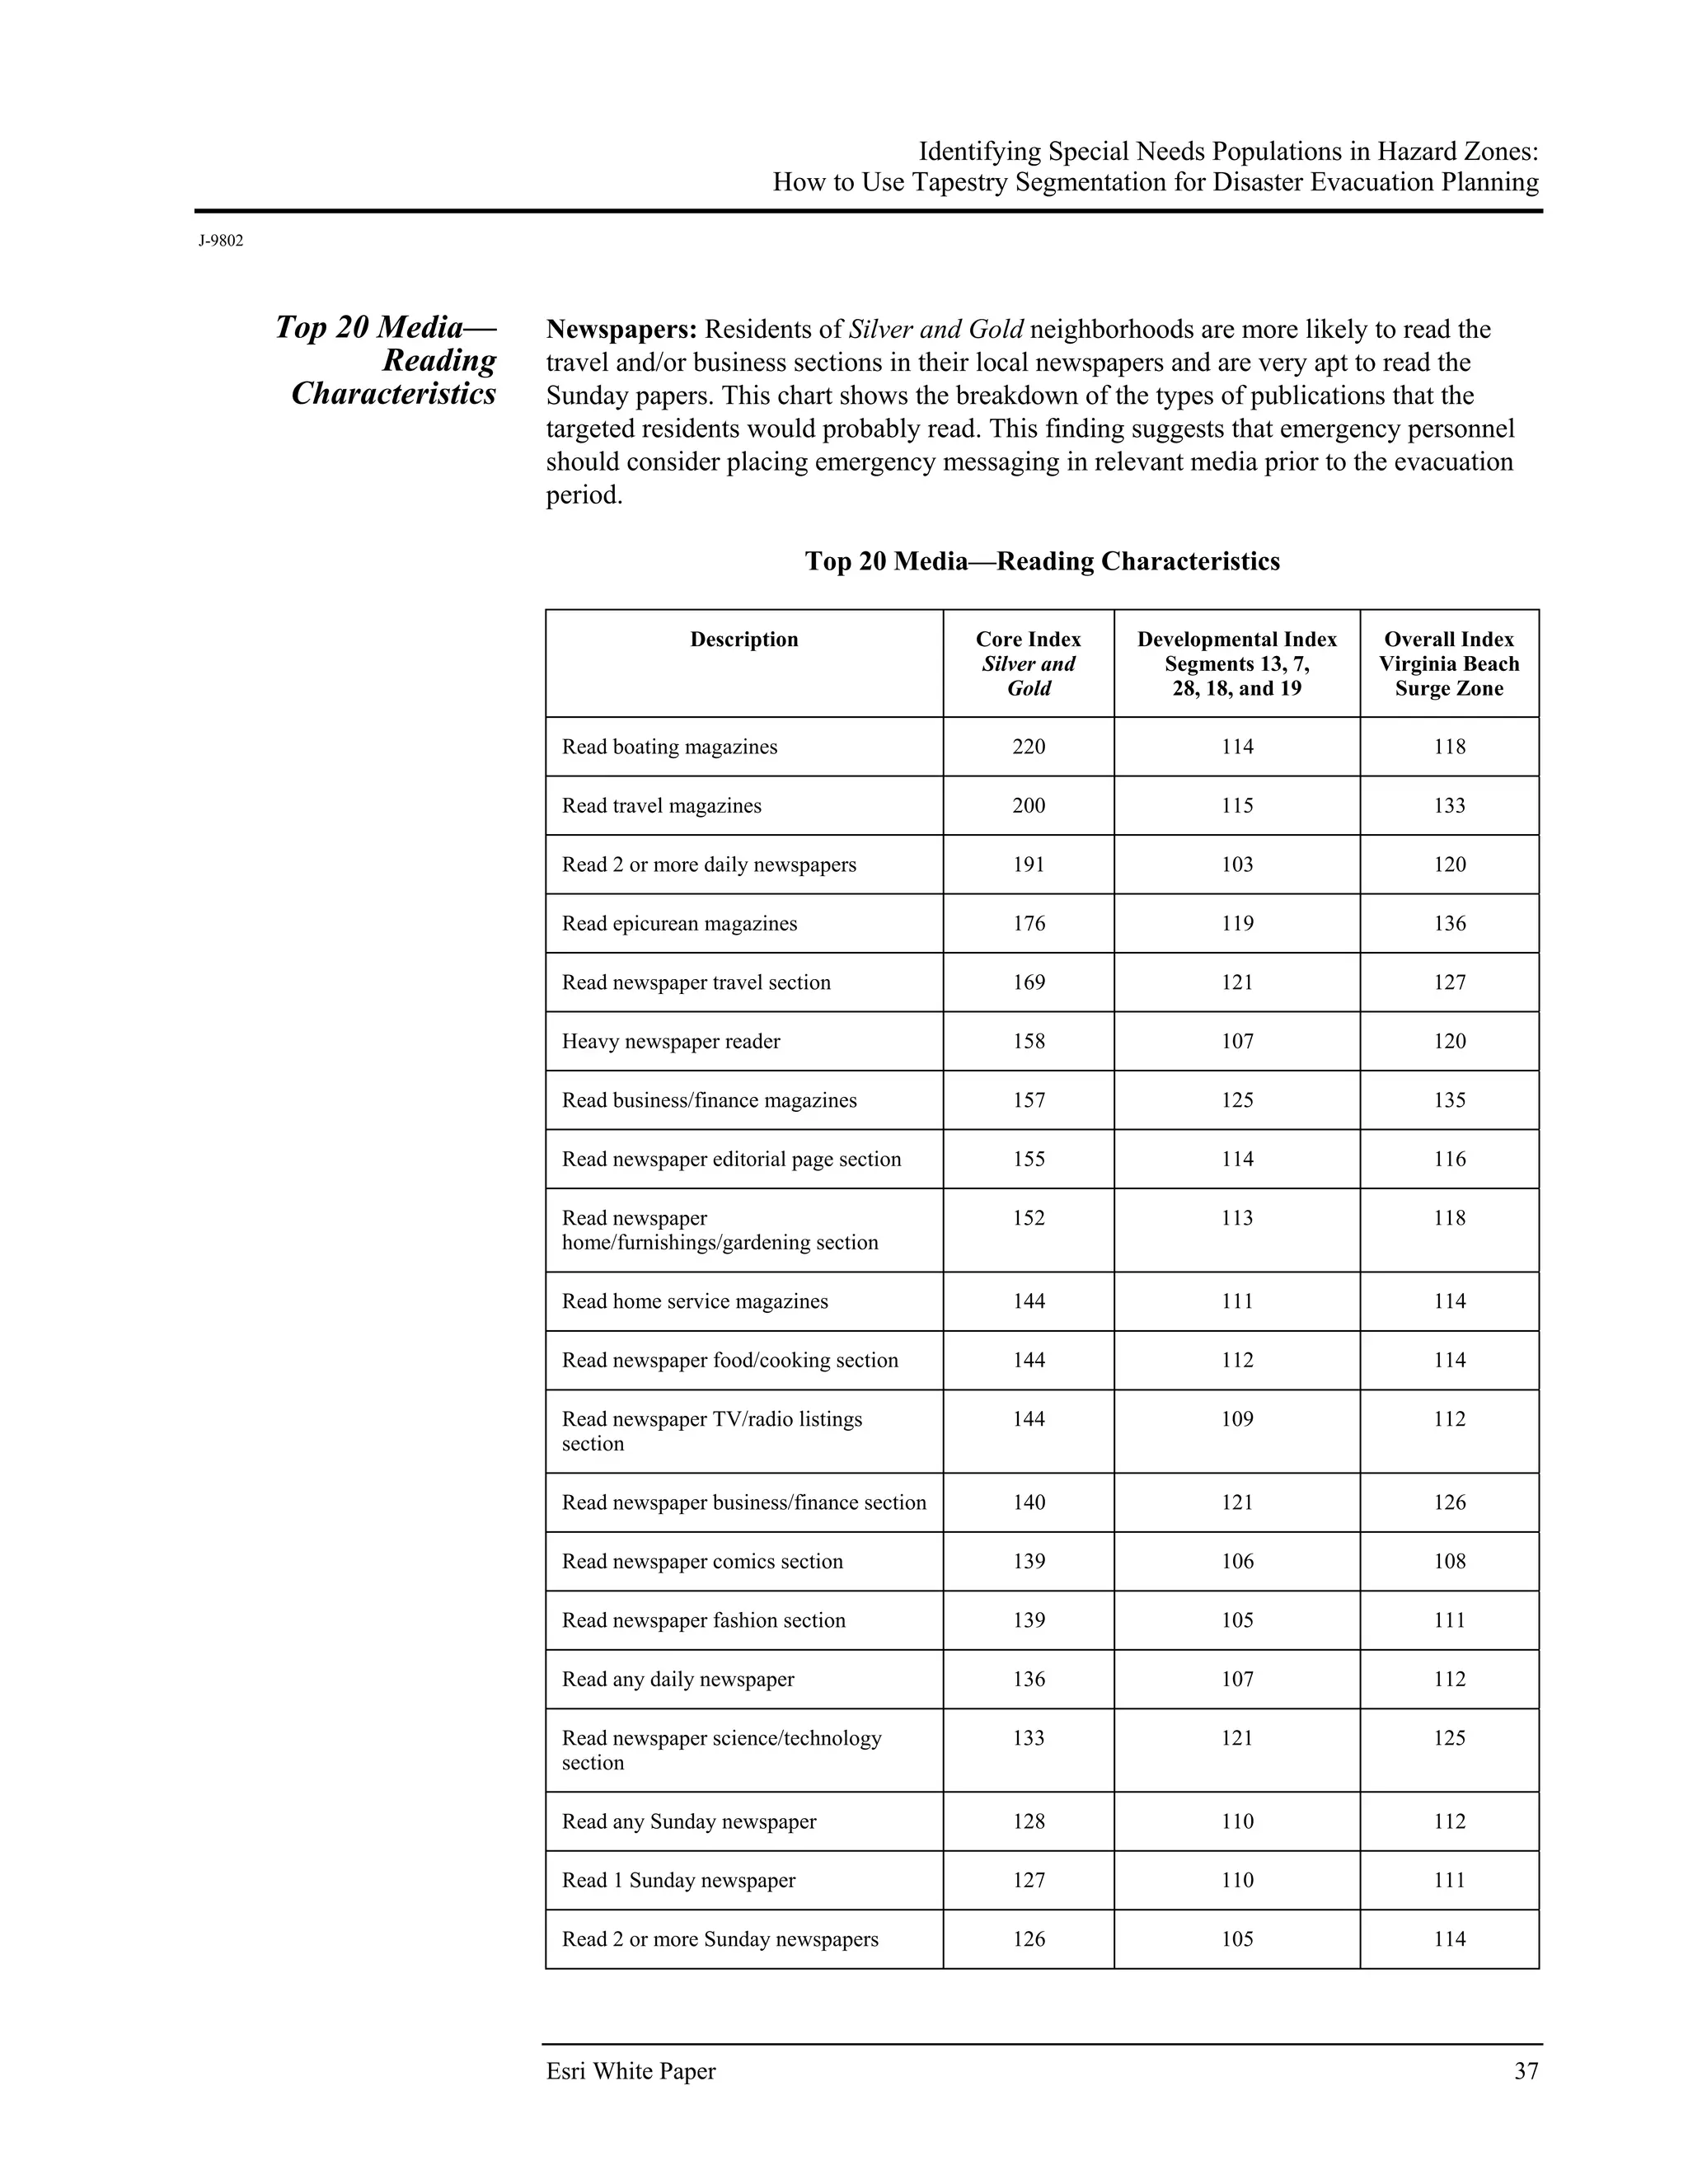
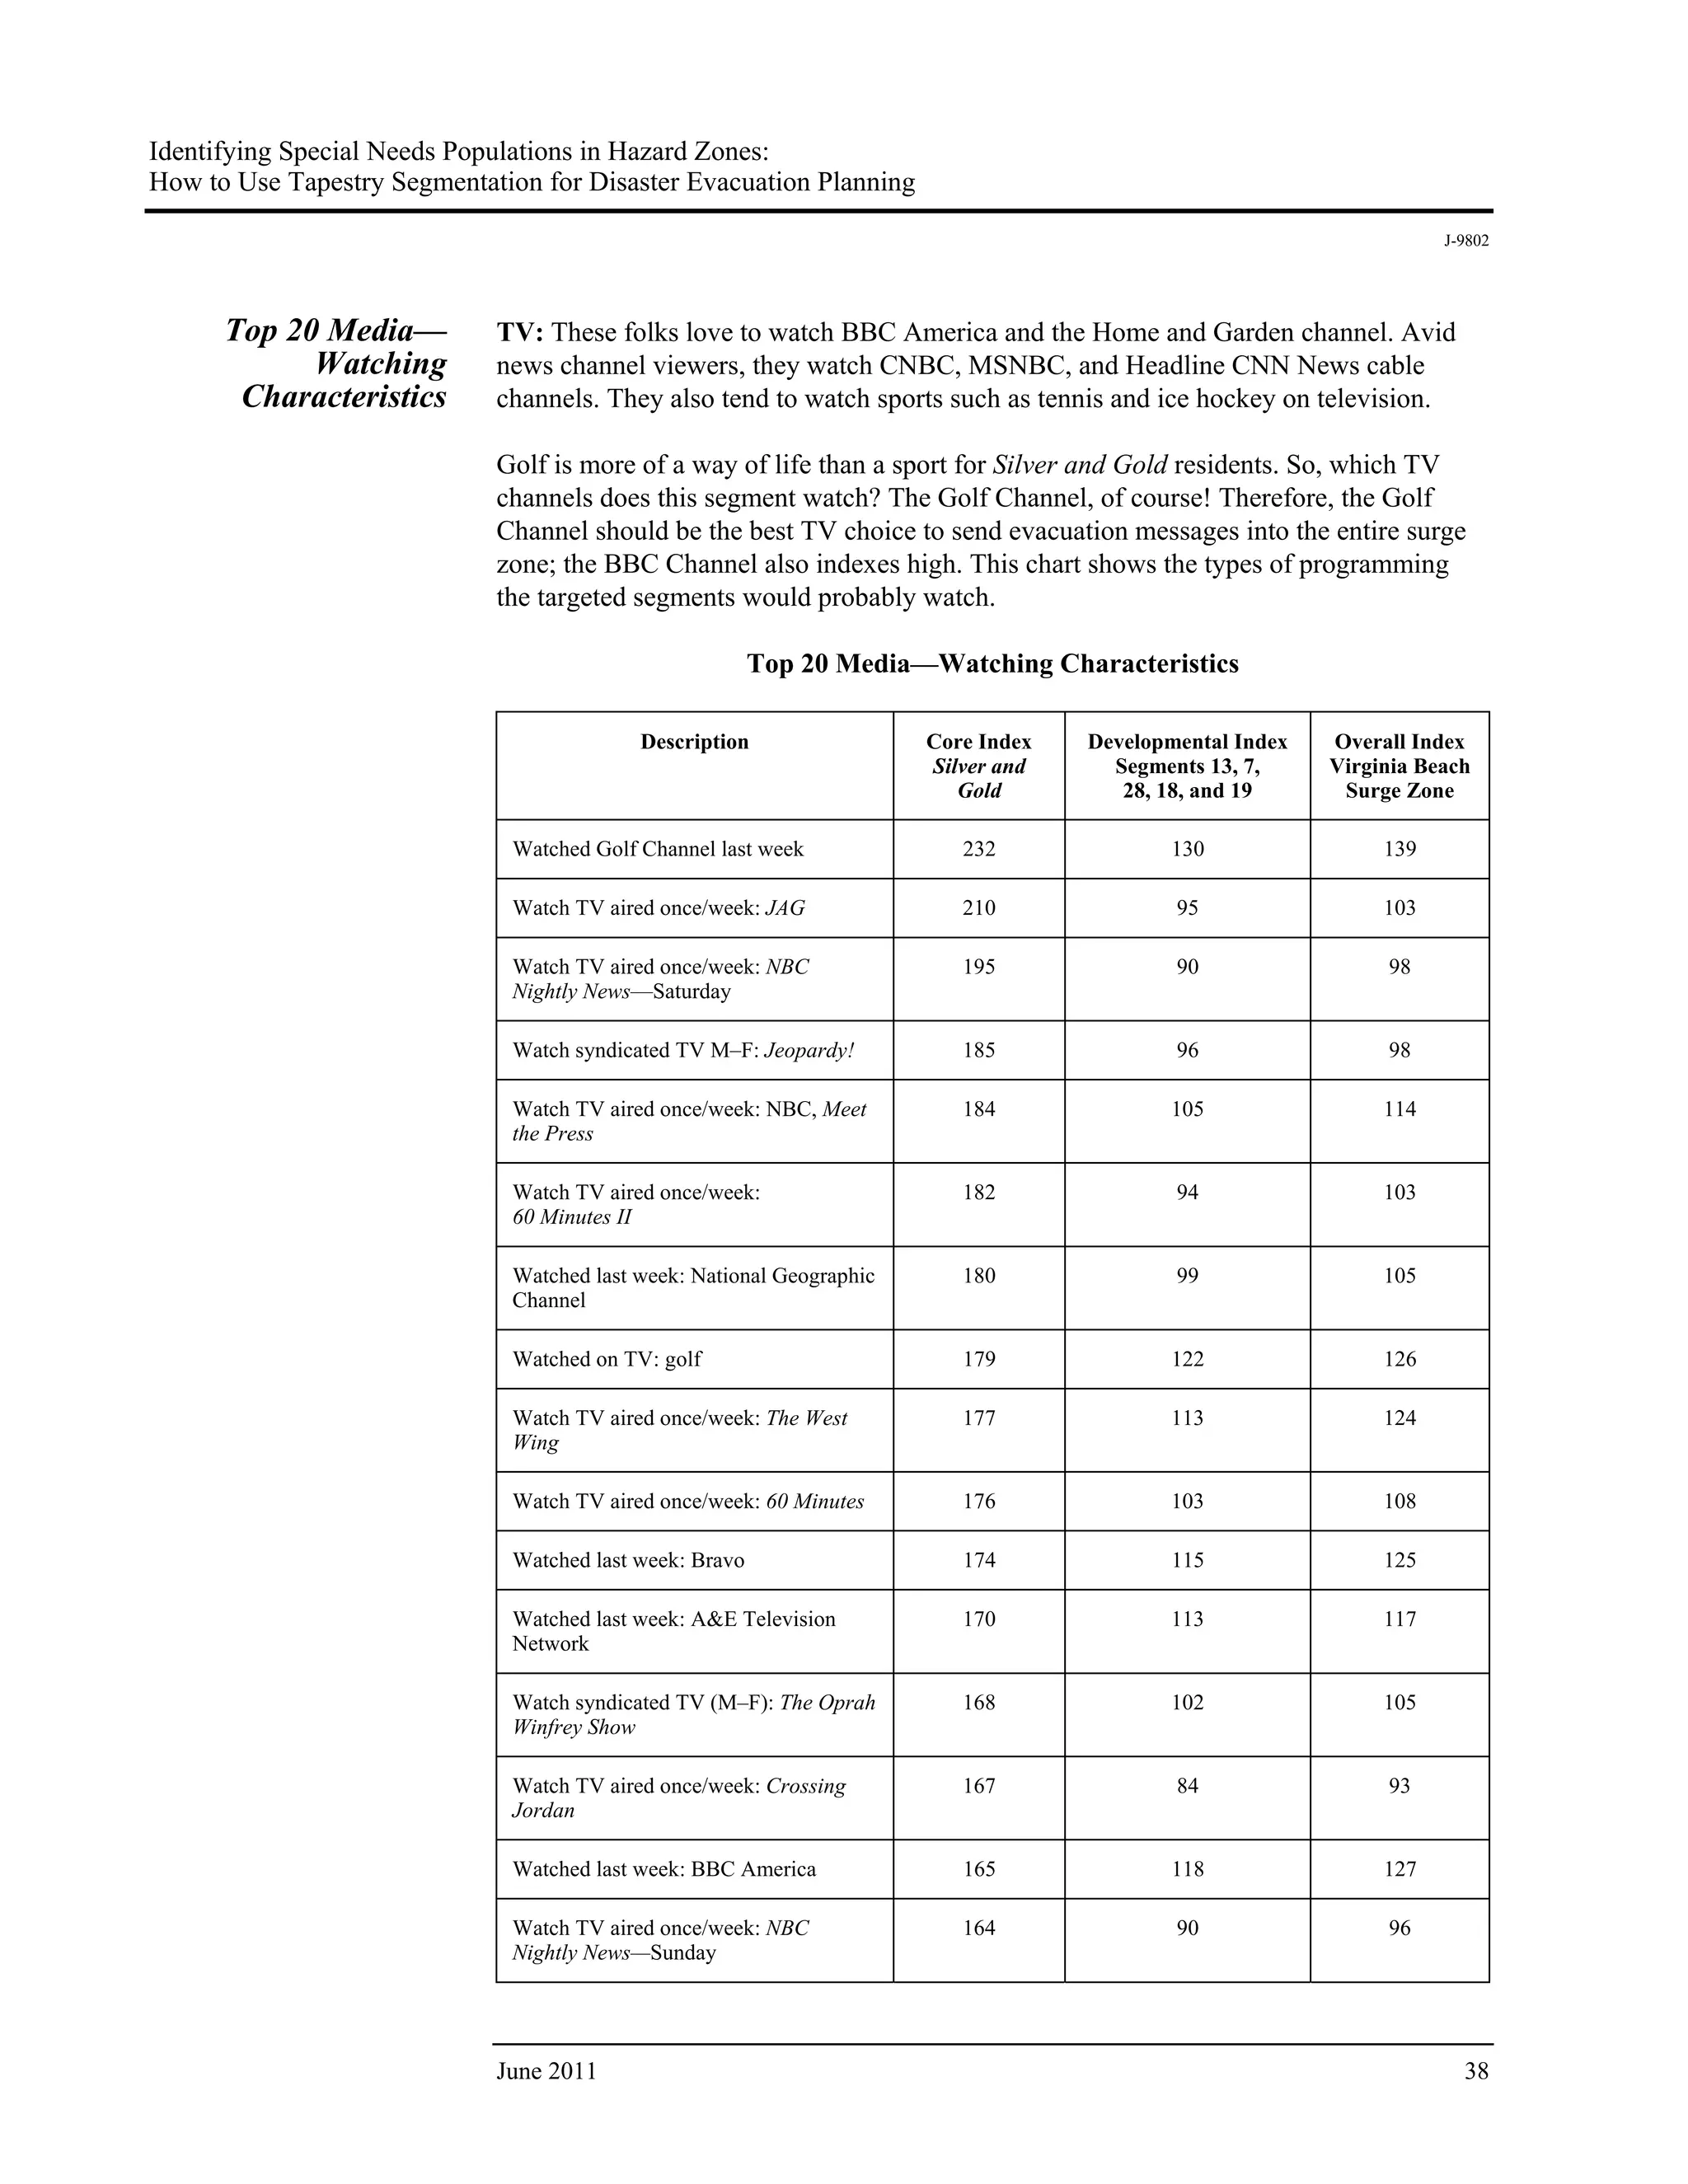
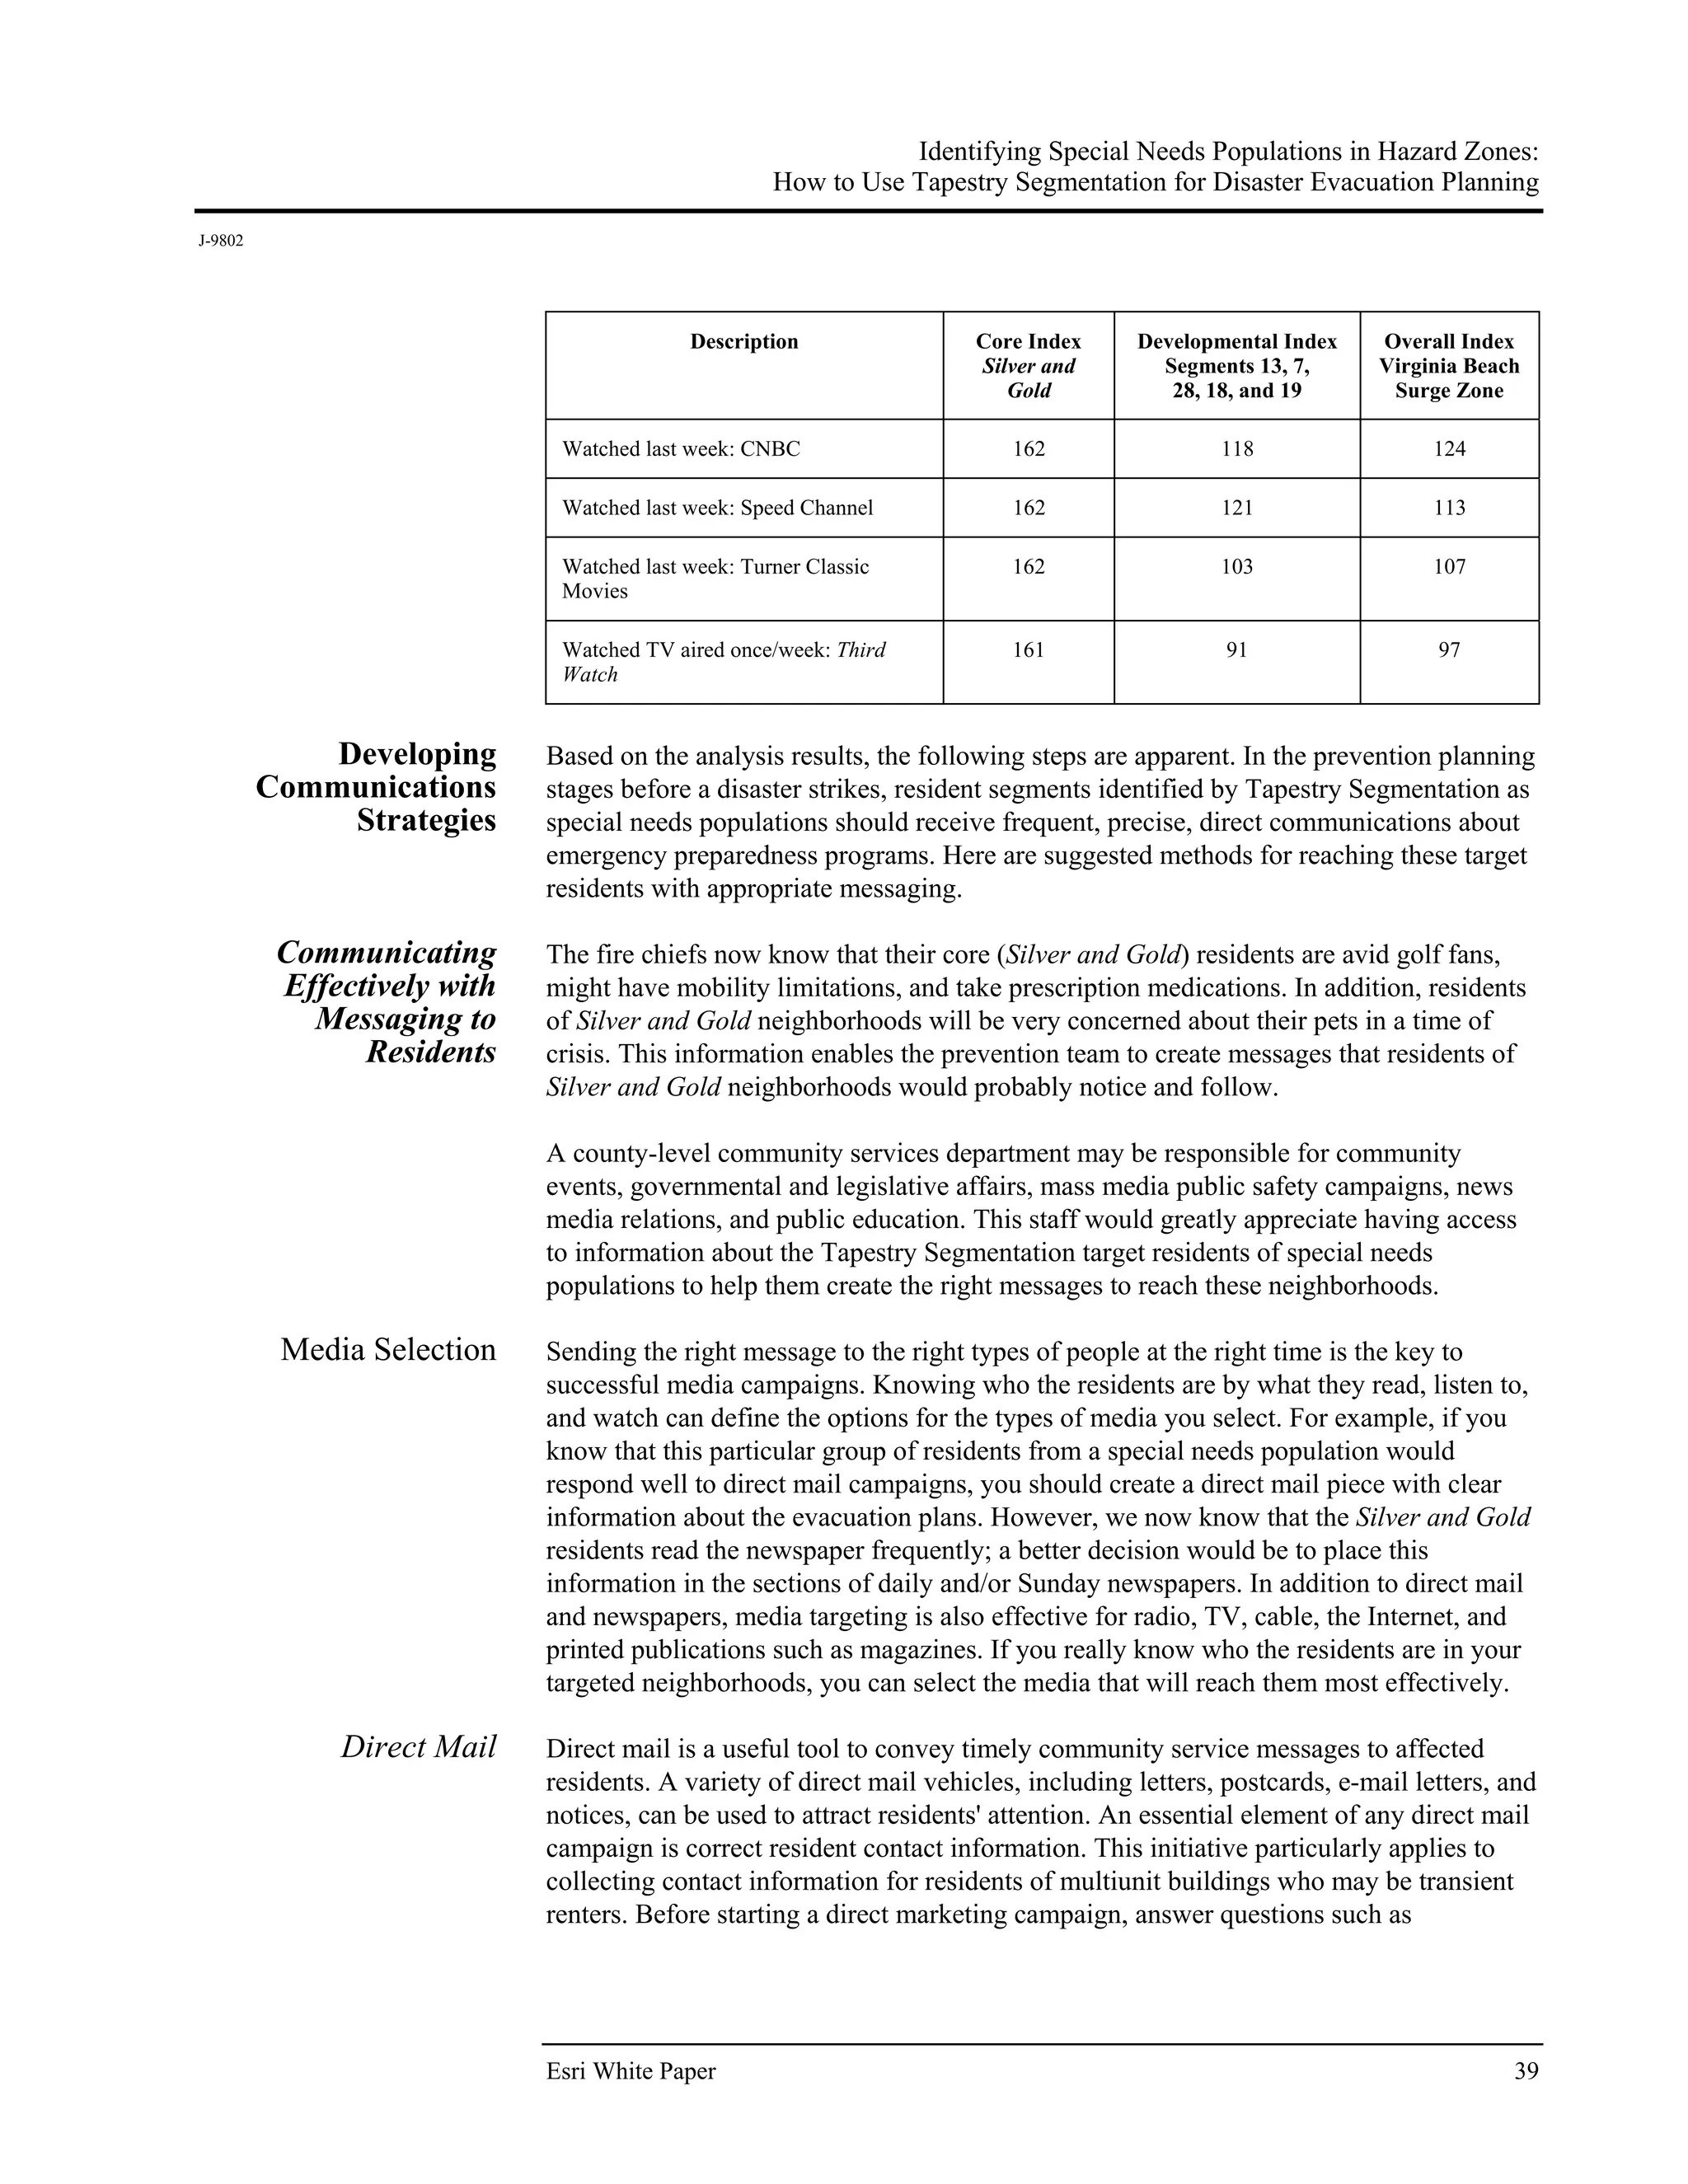


This document discusses how geographic and demographic segmentation analysis can help identify special needs populations for disaster evacuation planning. The analysis uses Esri's Tapestry segmentation system to classify residents in hazard zones into lifestyle groups. It finds that factors like health, transportation access, pet ownership, and leisure activities influence special populations' needs. The results then aid in developing targeted communication strategies for evacuation messaging and relocation planning.


![NPY Rule Book [constitution] catsi act approved at 14.11.08](https://cdn.slidesharecdn.com/ss_thumbnails/npyrulebookconstitutioncatsiactapprovedat14-11-08-120524022757-phpapp02-thumbnail.jpg?width=640&height=640&fit=bounds)


![Coded Agents – with UiPath SDK + LangGraph [Virtual Hands-on Workshop]](https://cdn.slidesharecdn.com/ss_thumbnails/codedagentsdeck-251215155422-5497c599-thumbnail.jpg?width=640&height=640&fit=bounds)


