Download to read offline
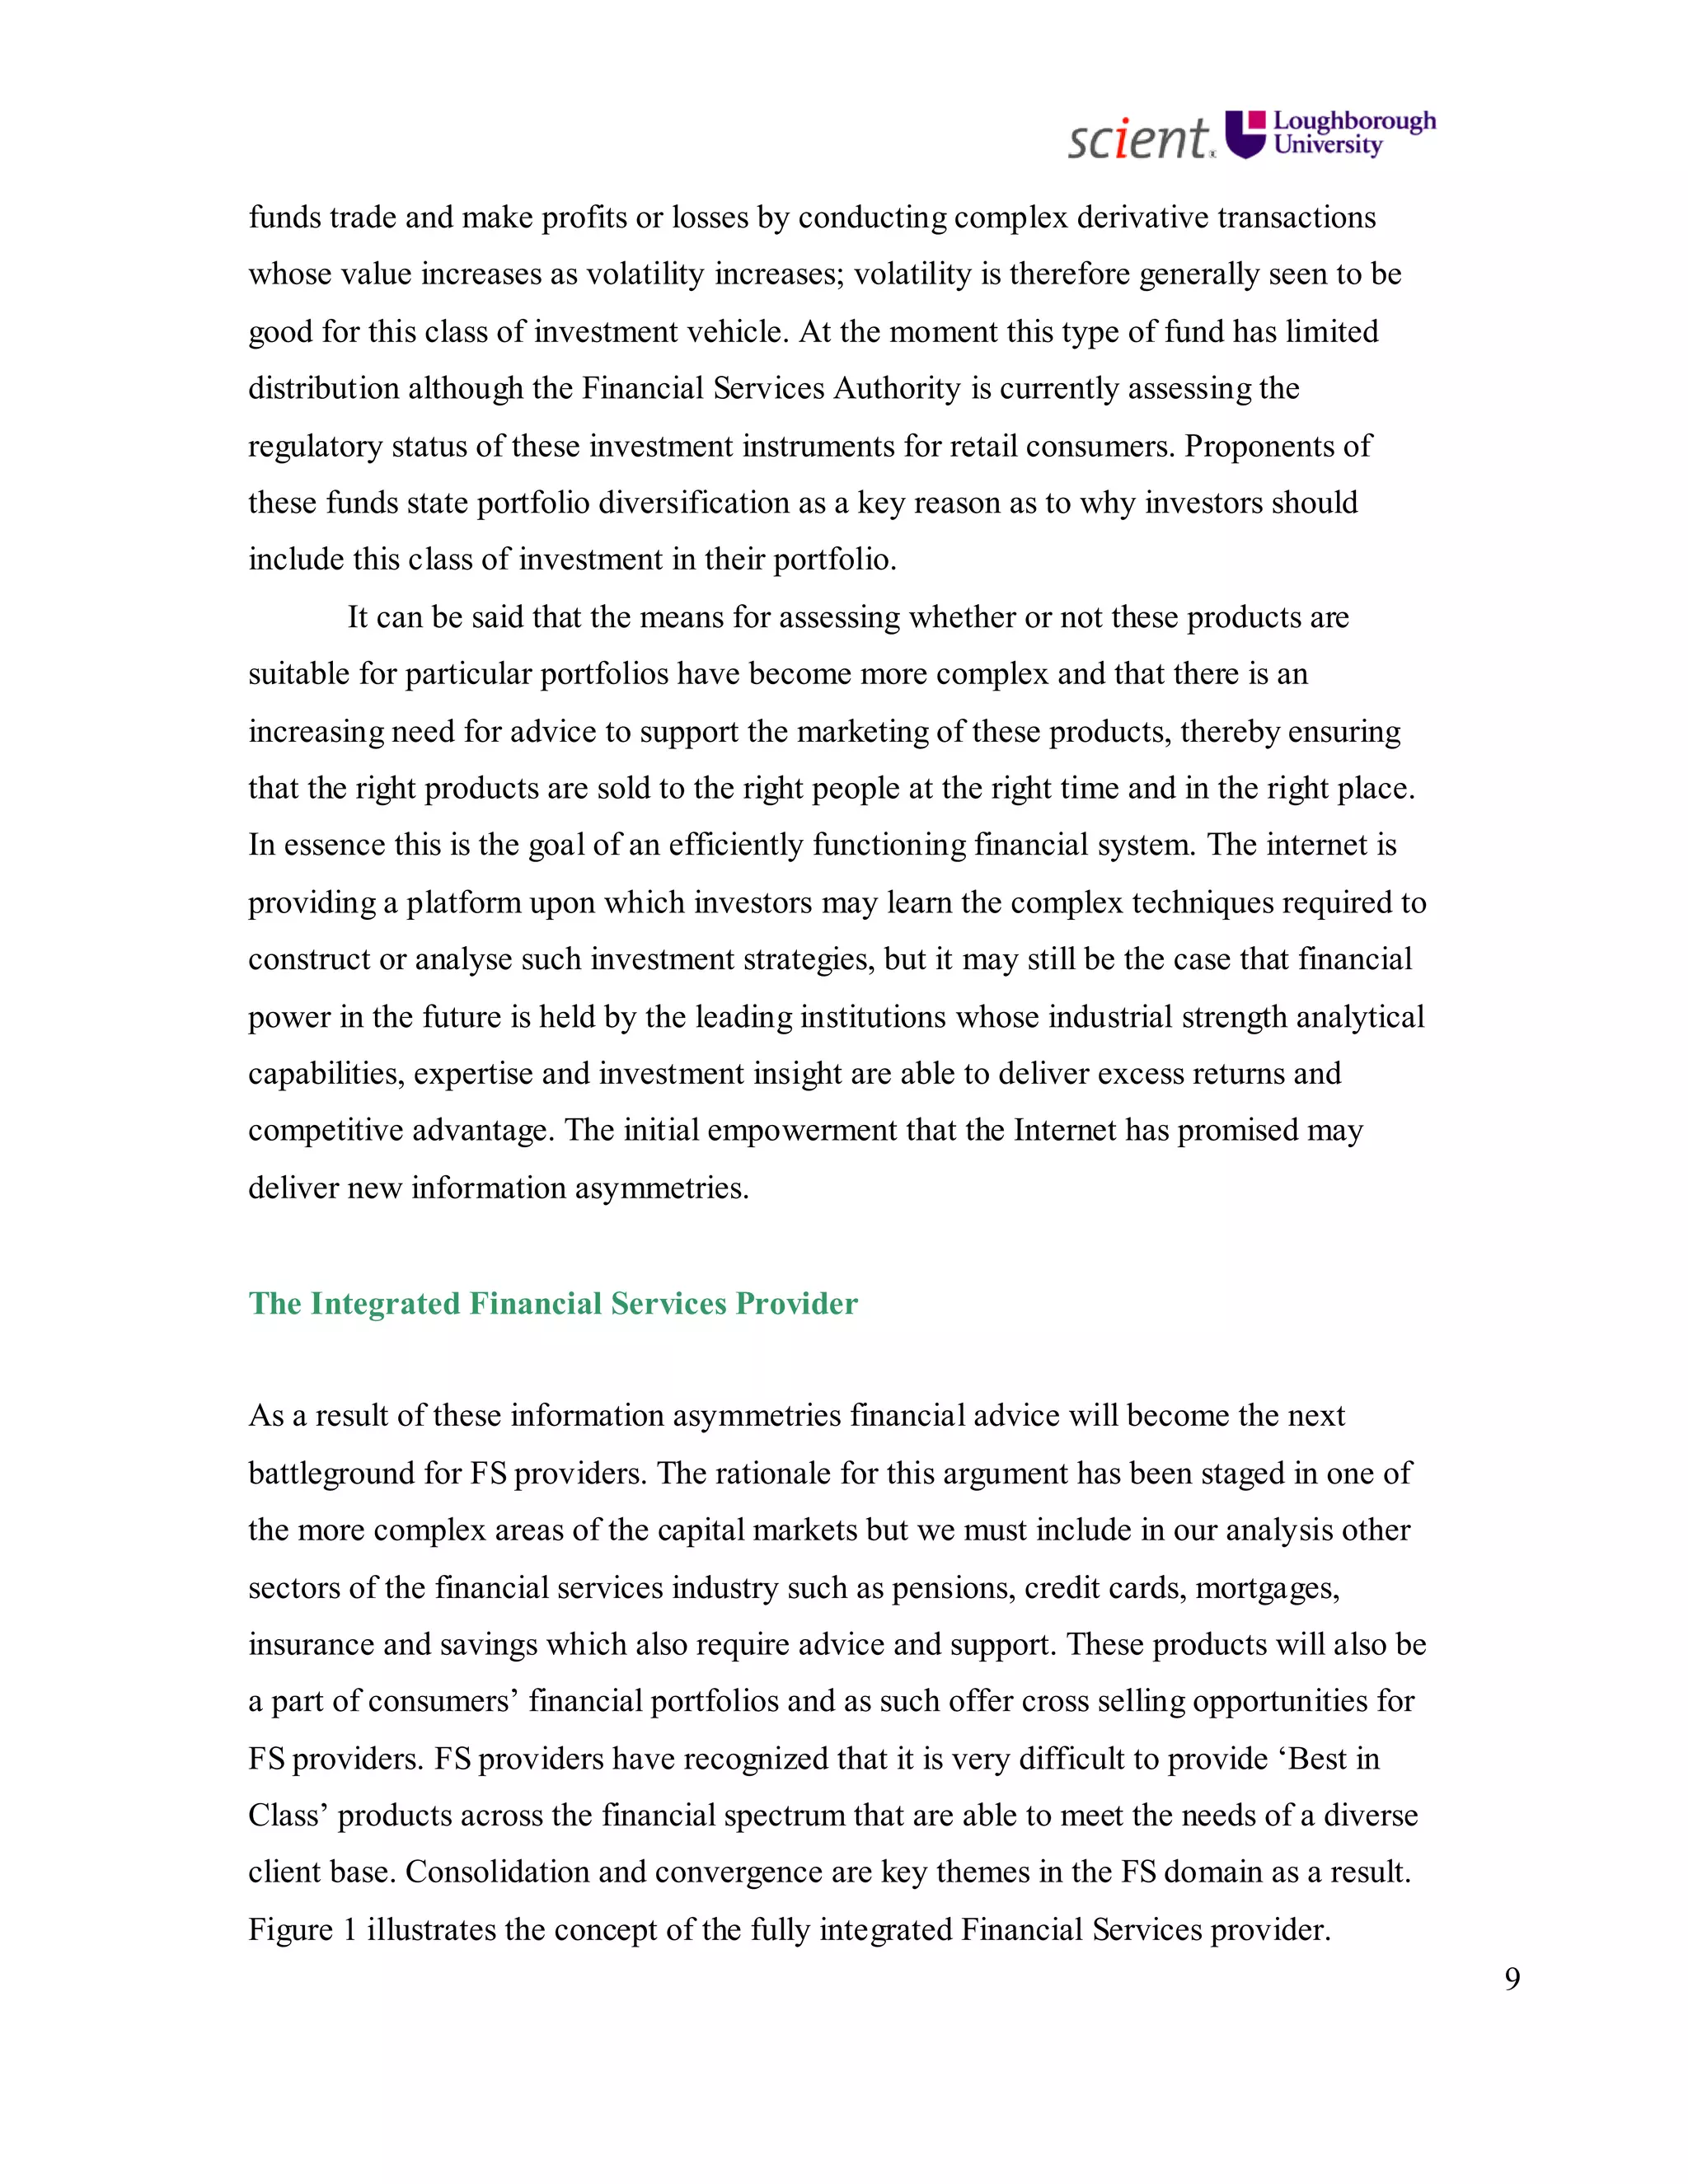
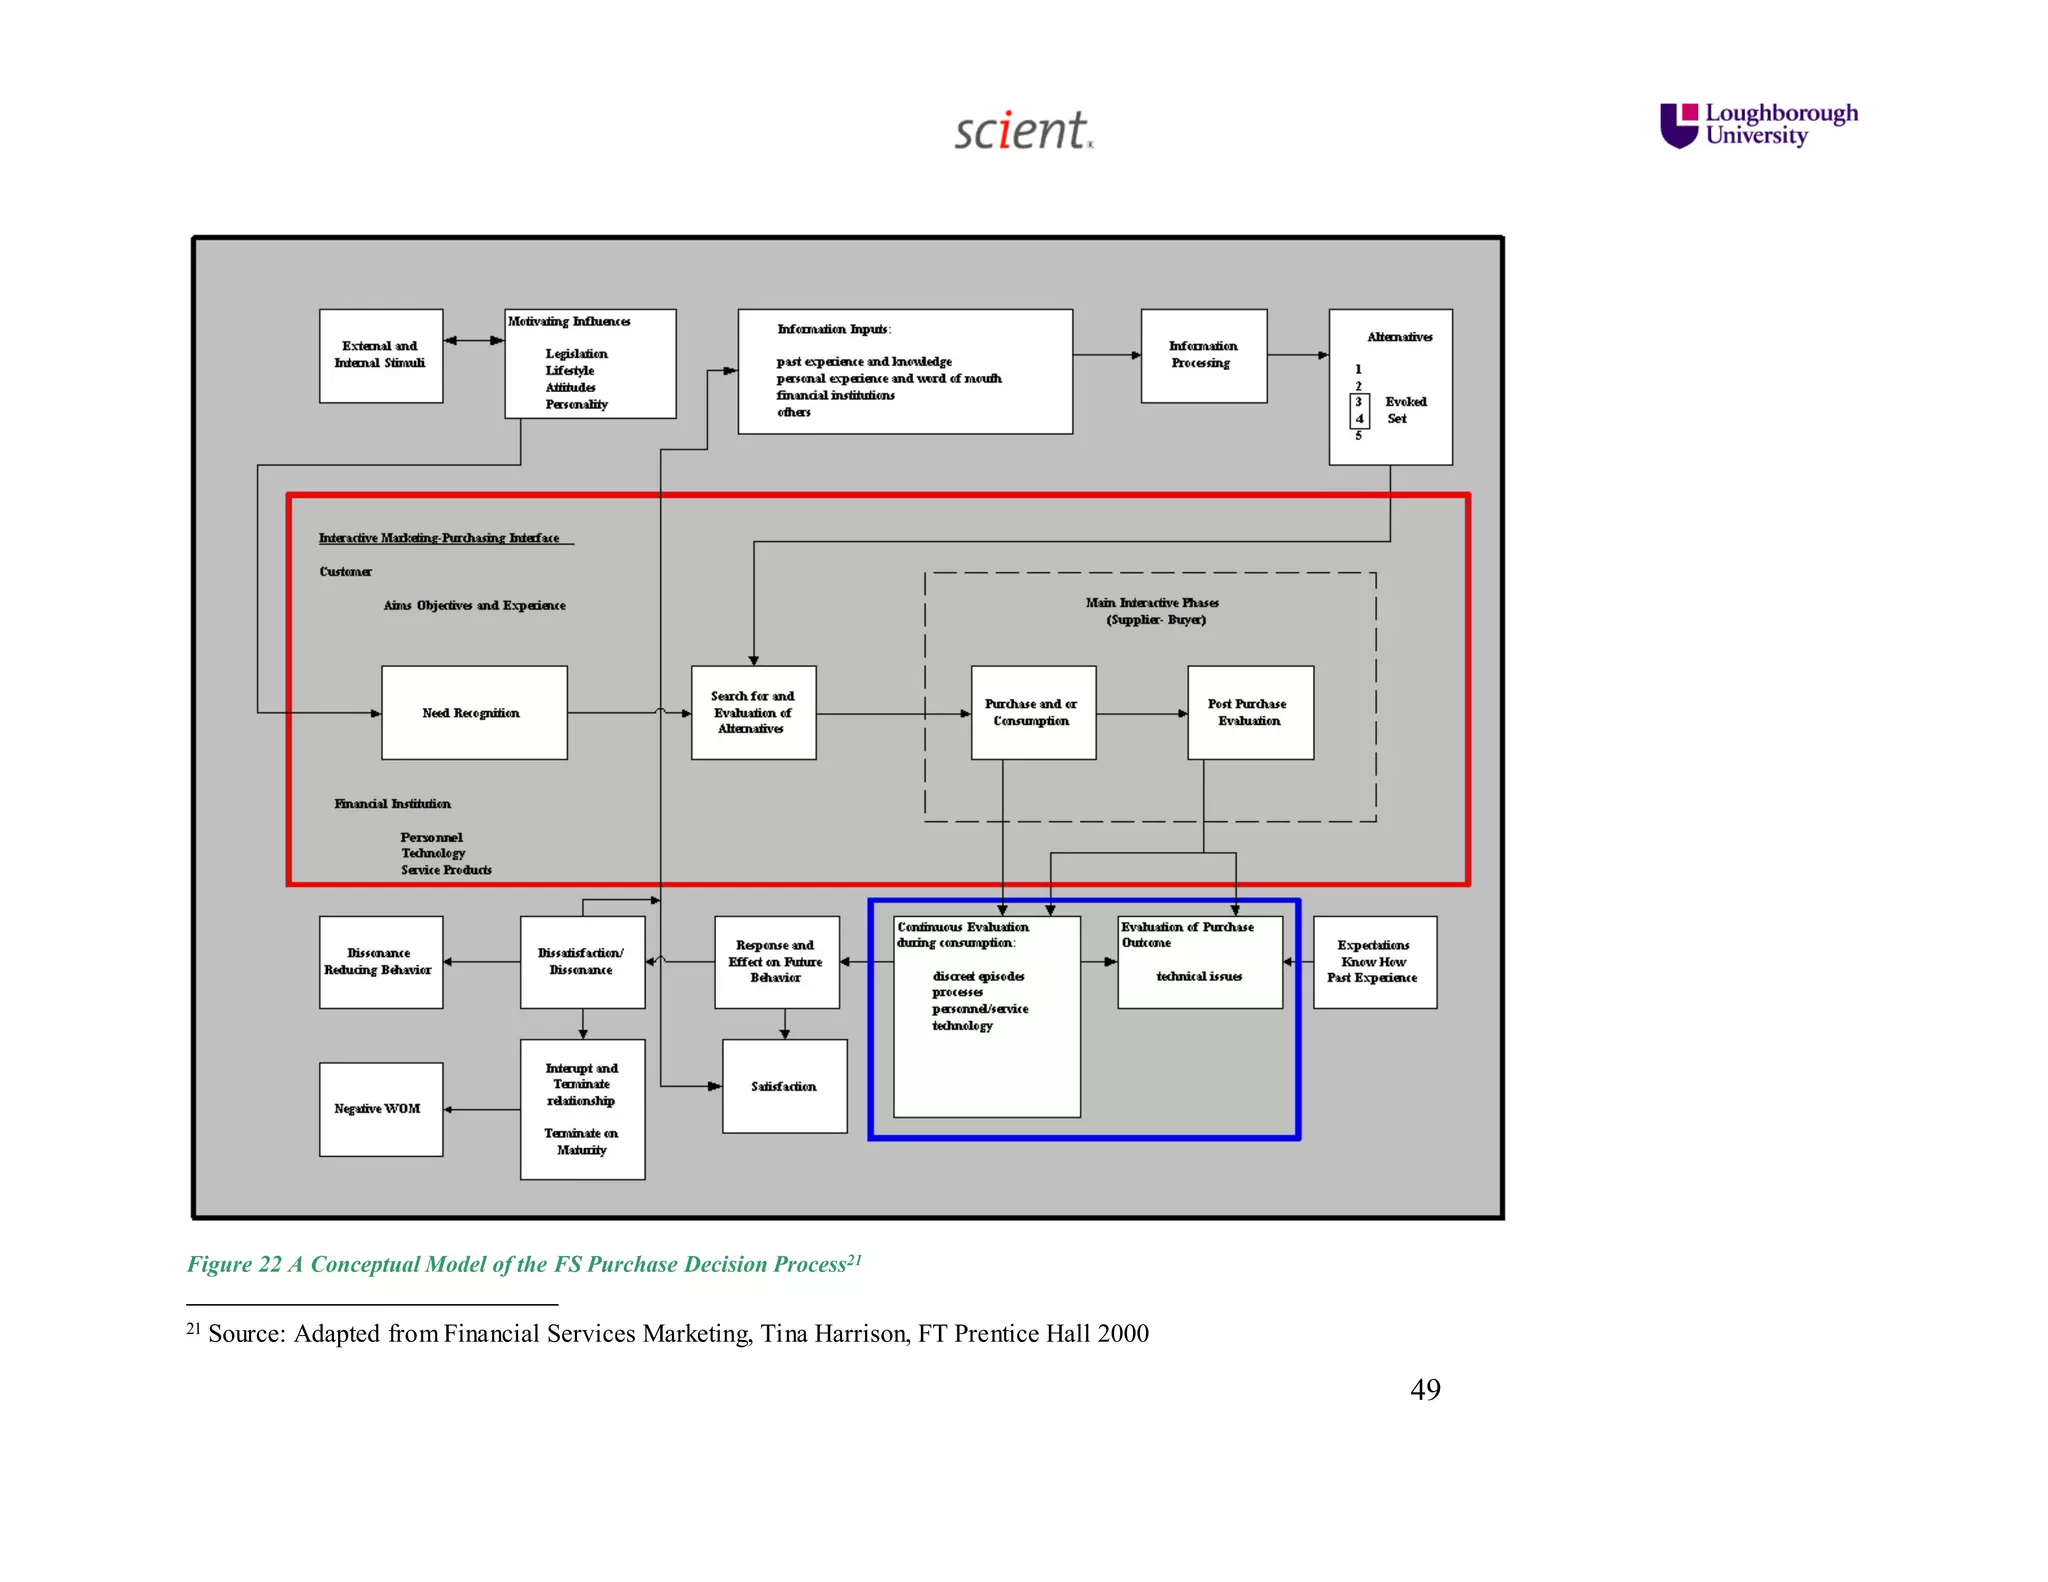
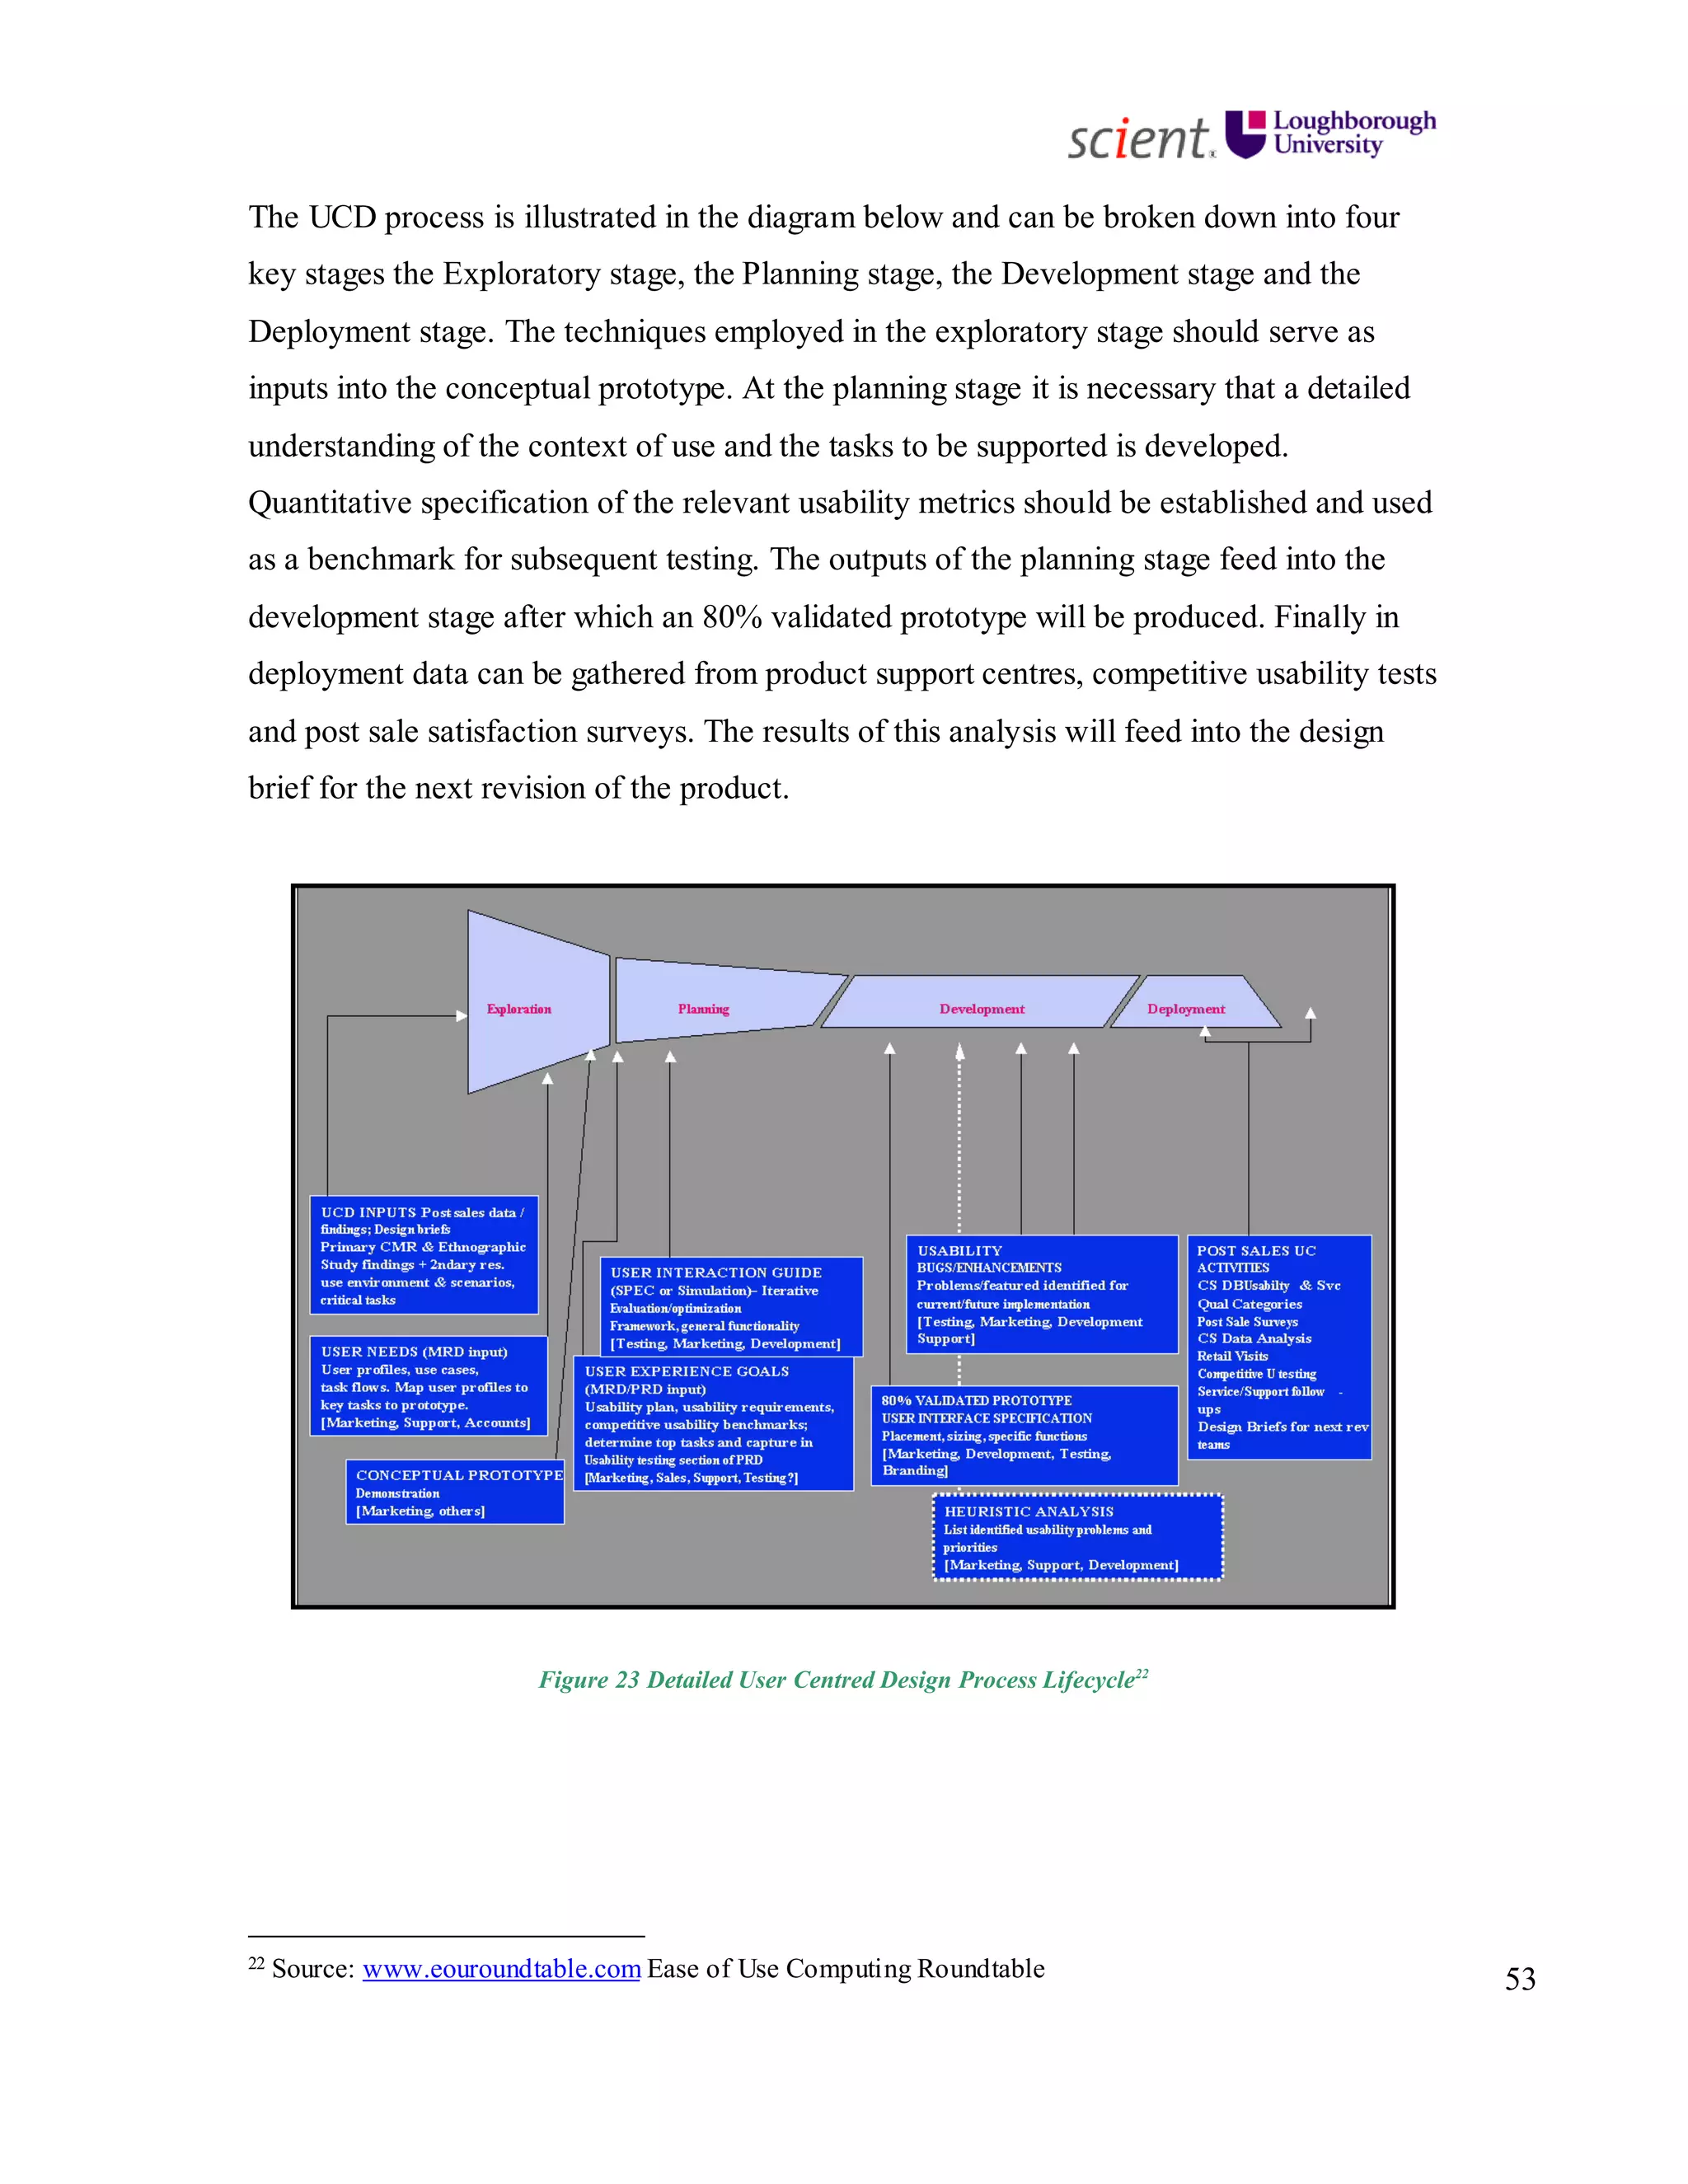

This project report examines the usability of web-based financial services, with a focus on improving customer experience through user-centered design. It outlines the current financial services environment, consumer needs, and evaluates the online account opening processes of major UK retail banks. Findings indicate that while basic usability is addressed, further enhancements on critical usability aspects are necessary for better user engagement.


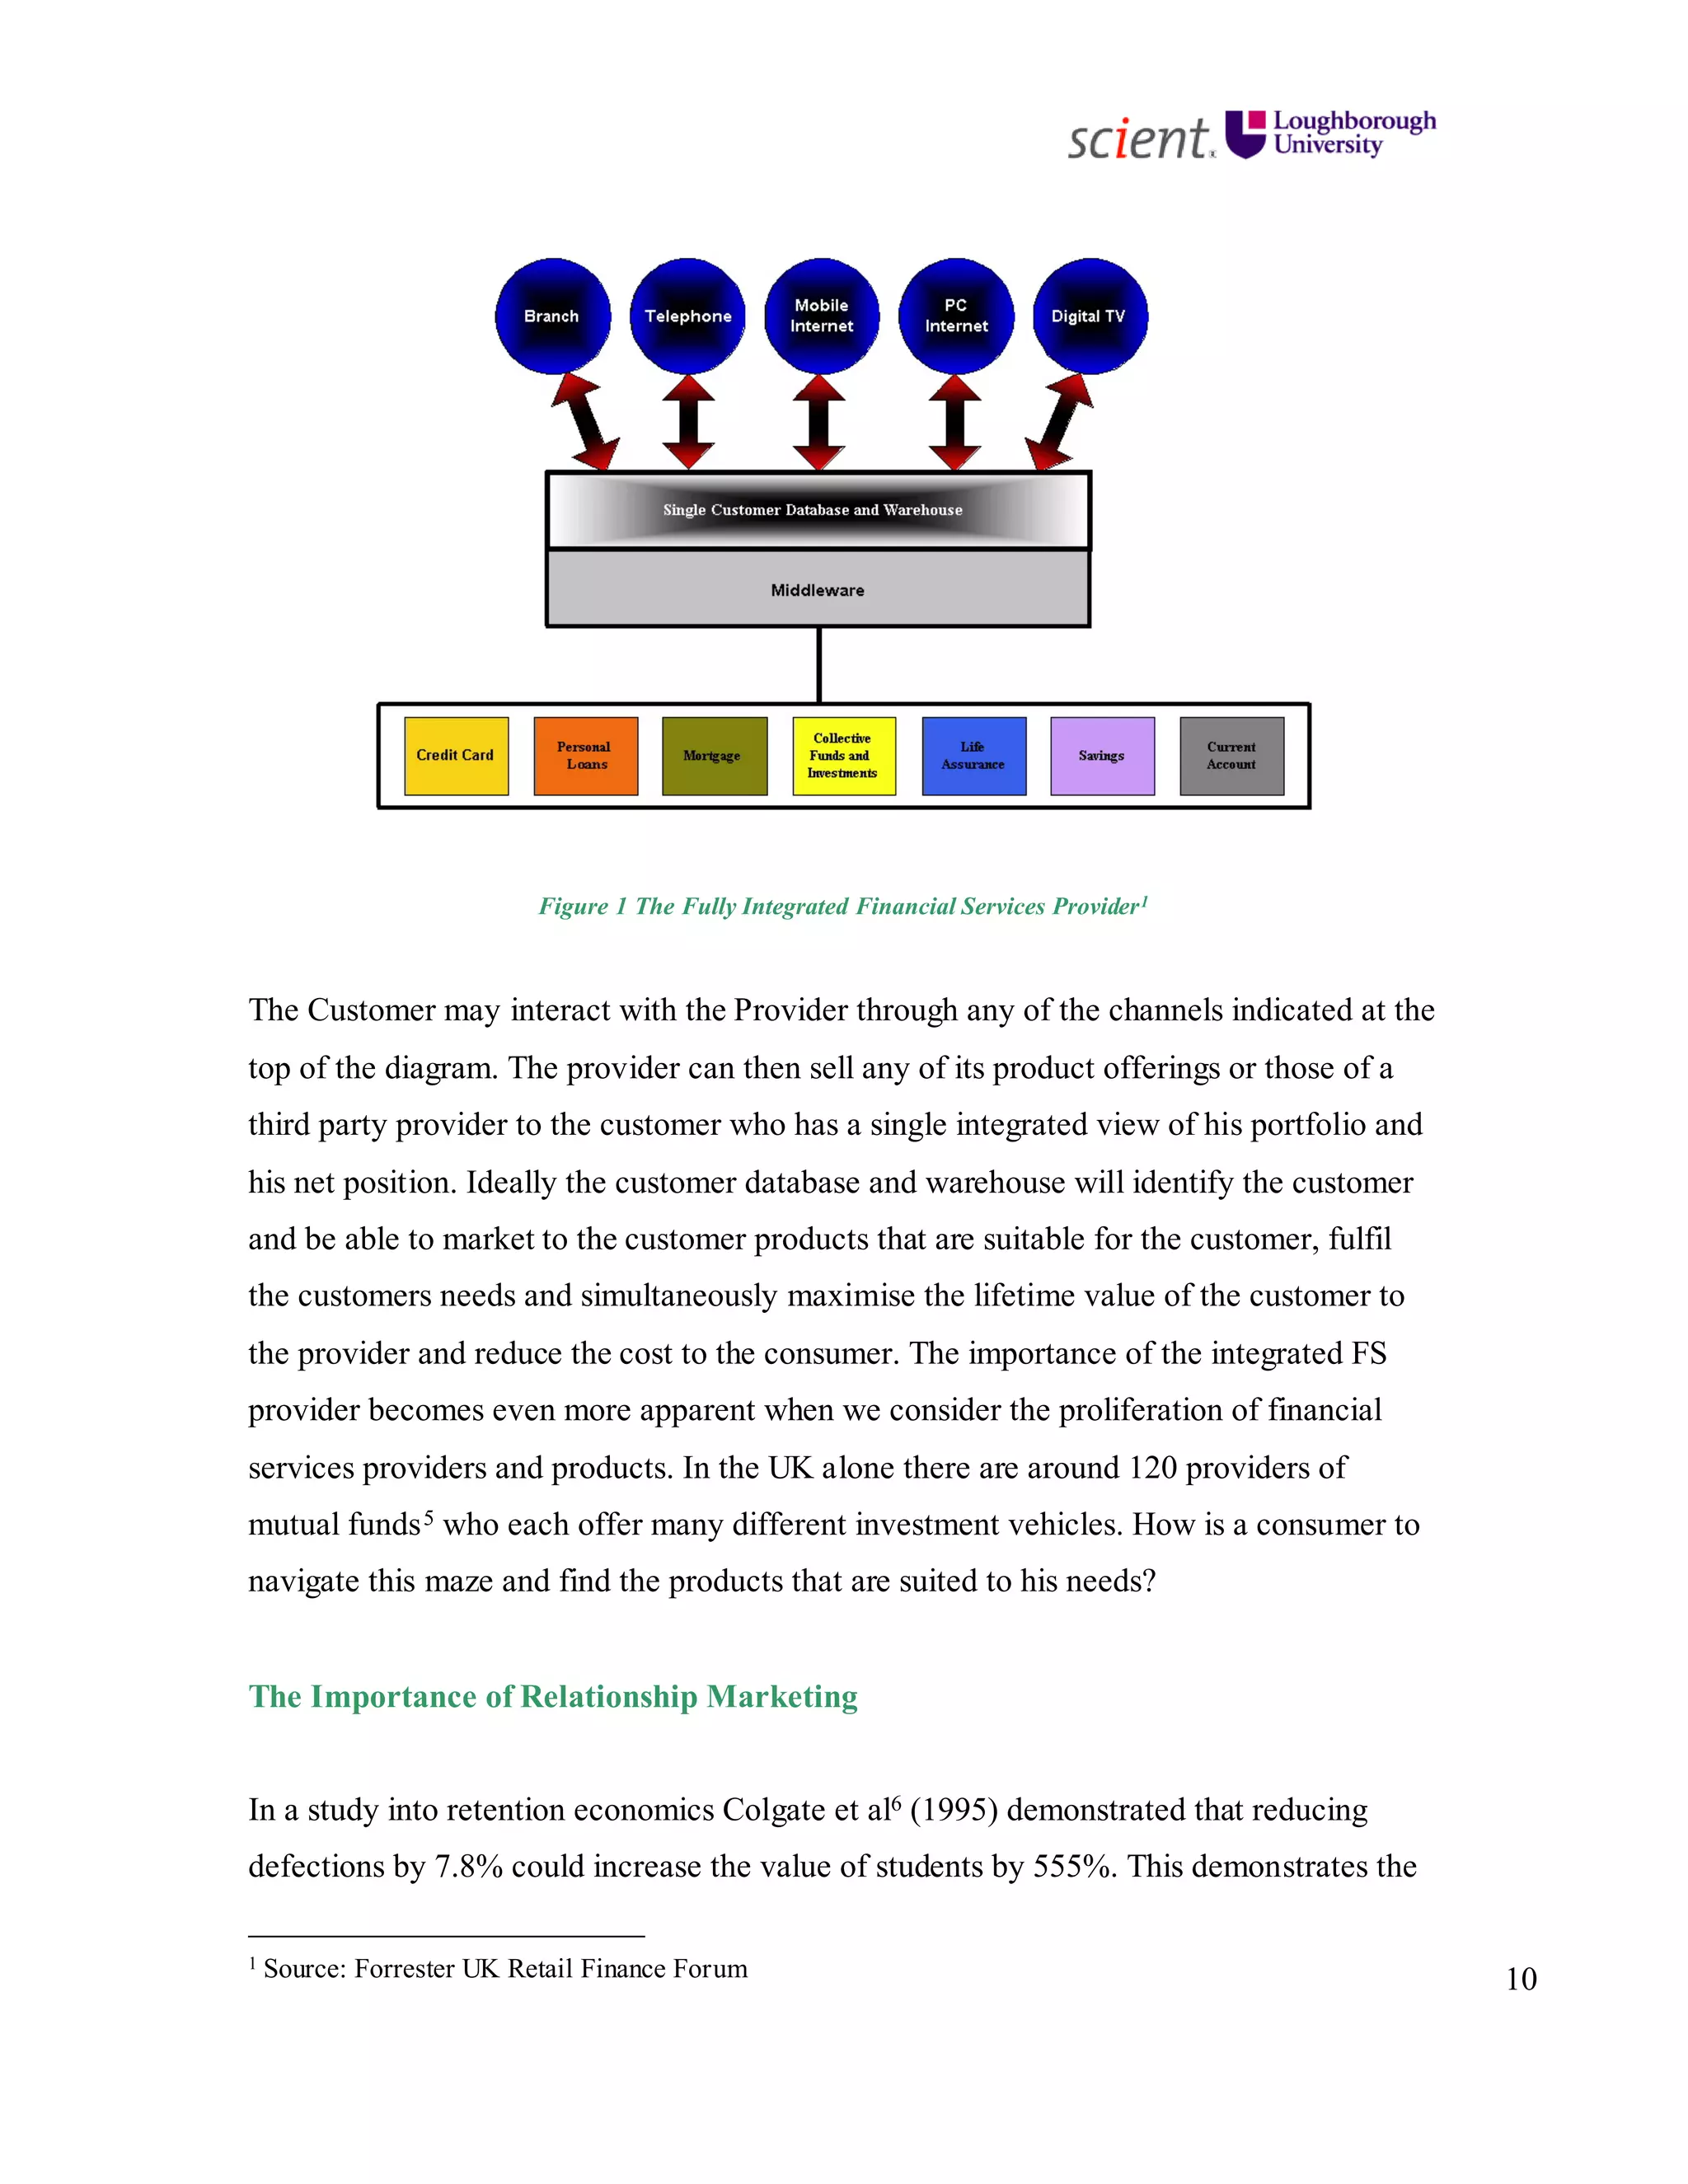
![Vibe Coding vs. Spec-Driven Development [Free Meetup]](https://cdn.slidesharecdn.com/ss_thumbnails/vibecodingvsspecdrivendevelopment-251209105622-43f455e7-thumbnail.jpg?width=640&height=640&fit=bounds)


