Weekly Review - June 26, 2010
•
1 like•149 views

The market ended the week mostly flat, with the Sensex and Nifty gaining 0.02% and 0.1% respectively. Mid-cap and small-cap indices outperformed, rising 1.5% and 1.6%. Oil and gas stocks gained the most, with the BSE Oil and Gas Index rising 3%. Foreign institutional investors were net buyers of Indian stocks. Key points from the document include an analysis of Sun TV Network and recommendations to buy the stock, an update on Indraprastha Gas with a revised target price and upgrade to buy, and an event note on Reliance Industries maintaining a buy rating.

More Related Content
What's hot
What's hot (17)
Viewers also liked
Viewers also liked (20)
Similar to Weekly Review - June 26, 2010
Similar to Weekly Review - June 26, 2010 (20)
More from Angel Broking
More from Angel Broking (20)
Recently uploaded
Recently uploaded (20)
Weekly Review - June 26, 2010
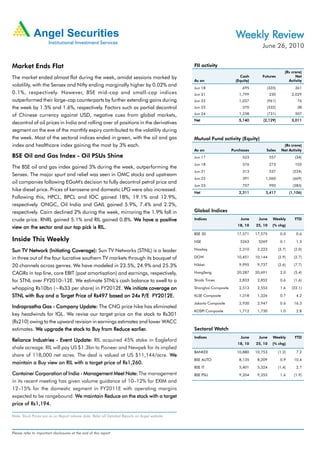
- 1. Weekly Review June 26, 2010 Market Ends Flat FII activity (Rs crore) The market ended almost flat during the week, amidst sessions marked by Cash Futures Net As on (Equity) Activity volatility, with the Sensex and Nifty ending marginally higher by 0.02% and Jun 18 695 (335) 361 0.1%, respectively. However, BSE mid-cap and small-cap indices Jun 21 1,799 230 2,029 outperformed their large-cap counterparts by further extending gains during Jun 22 1,037 (961) 76 the week by 1.5% and 1.6%, respectively. Factors such as partial decontrol Jun 23 370 (332) 38 of Chinese currency against USD, negative cues from global markets, Jun 24 1,238 (731) 507 Net 5,140 (2,129) 3,011 decontrol of oil prices in India and rolling over of positions in the derivatives segment on the eve of the monthly expiry contributed to the volatility during the week. Most of the sectoral indices ended in green, with the oil and gas Mutual Fund activity (Equity) index and healthcare index gaining the most by 3% each. (Rs crore) As on Purchases Sales Net Activity BSE Oil and Gas Index - Oil PSUs Shine Jun 17 523 557 (34) Jun 18 376 273 103 The BSE oil and gas index gained 3% during the week, outperforming the Jun 21 313 537 (224) Sensex. The major spurt and relief was seen in OMC stocks and upstream Jun 22 391 1,060 (669) oil companies following EGoM's decision to fully decontrol petrol price and Jun 23 707 990 (283) hike diesel price. Prices of kerosene and domestic LPG were also increased. Net 2,311 3,417 (1,106) Following this, HPCL, BPCL and IOC gained 18%, 19.1% and 12.9%, respectively. ONGC, Oil India and GAIL gained 5.9%, 7.4% and 2.2%, respectively. Cairn declined 2% during the week, mirroring the 1.9% fall in Global Indices crude price. RNRL gained 5.1% and RIL gained 0.8%. We have a positive Indices June June Weekly YTD 18, 10 25, 10 (% chg) RIL. view on the sector and our top pick is RIL. BSE 30 17,571 17,575 0.0 0.6 Inside This Weekly NSE 5263 5269 0.1 1.3 Sun TV Network (Initiating Coverage): Sun TV Networks (STNL) is a leader Nasdaq 2,310 2,223 (3.7) (2.0) in three out of the four lucrative southern TV markets through its bouquet of DOW 10,451 10,144 (2.9) (2.7) 20 channels across genres. We have modeled in 23.5%, 24.9% and 25.3% Nikkei 9,995 9,737 (2.6) (7.7) CAGRs in top line, core EBIT (post amortisation) and earnings, respectively, HangSeng 20,287 20,691 2.0 (5.4) for STNL over FY2010–12E. We estimate STNL's cash balance to swell to a Straits Times 2,833 2,852 0.6 (1.6) whopping Rs10bn (~Rs33 per share) in FY2012E. We initiate coverage on We Shanghai Composite 2,513 2,553 1.6 (22.1) Target Price STNL with Buy and a Target Price of Rs497 based on 24x P/E FY2012E.FY2012E. KLSE Composite 1,318 1,326 0.7 4.2 Jakarta Composite 2,930 2,947 0.6 16.3 Indraprastha Gas - Company Update: The CNG price hike has eliminated KOSPI Composite 1,712 1,730 1.0 2.8 key headwinds for IGL. We revise our target price on the stock to Rs301 (Rs210) owing to the upward revision in earnings estimates and lower WACC estimates. We upgrade the stock to Buy from Reduce earlier. earlier. Sectoral Watch Indices June June Weekly YTD Reliance Industries - Event Update: RIL acquired 45% stake in Eagleford 18, 10 25, 10 (% chg) shale acreage. RIL will pay US $1.3bn to Pioneer and Newpek for its implied BANKEX 10,880 10,753 (1.2) 7.2 share of 118,000 net acres. The deal is valued at US $11,144/acre. We BSE AUTO 8,135 8,209 0.9 10.4 maintain a Buy view on RIL with a target price of Rs1,260. BSE IT 5,401 5,324 (1.4) 2.7 Container Corporation of India - Management Meet Note: The management BSE PSU 9,204 9,353 1.6 (1.9) in its recent meeting has given volume guidance of 10–12% for EXIM and 12–15% for the domestic segment in FY2011E with operating margins expected to be rangebound. We maintain Reduce on the stock with a target price of Rs1,194. Note: Stock Prices are as on Report release date; Refer all Detailed Reports on Angel website. Please refer to important disclosures at the end of this report
- 2. Fundamental Focus | June 26, 2010 Focus Sun TV Network - Buy Price - Rs402 Target Price - Rs497 Initiating Coverage Sunny days ahead of 25.4x to account for risks associated with 1) high ARPUs in DTH subscription model, and 2) release/success of Endhiran Sun TV Networks (STNL) is a leader in 3 out of the 4 lucrative (big budget production). southern TV markets through its bouquet of 20 channels across genres. We have modeled in 23.5%, 24.9% and 25.3% CAGR We believe that premium valuations for STNL are justified given in top-line, core EBIT (post amortisation) and earnings its: 1) strong earnings CAGR of 25% over FY2010-12E, 2) respectively, for STNL, over FY2010-12E. We also estimate leadership position in 3 out of 4 lucrative southern markets, STNL's cash balance to swell to a whopping Rs10bn (~Rs33 which account for ~73% of the regional TV ad market, 3) strong per share) in FY2012E. At Rs402, the stock is trading at 19.4x group strength including political clout and presence across FY2012E Earnings. media value chains (distribution via Kal cables and DTH via STNL Ad Revenues to outpace Regional Ad growth, we peg Sun Direct), 4) unique low-cost business model (Broadcast fee 19% CAGR: During FY2010-12E, we expect STNL's standalone CAGR: and low SG&A), which enables it to register significantly higher Ad revenues to register 19.3% CAGR, ahead of the 13.9% CAGR operating margins, and 5) significant reduction in losses in Radio estimated in Regional advertising during the period, driven by:1) subsidiaries (we have factored in near break-even at operating absorption of rate hikes (ad rates hiked 5-33% across channels), level in FY2012E). 2) increased traction in niche Kids/Comedy channels, and Key Concerns 3) strong management focus on utilising inventory during off-peak hours and new weekend programming. Delay/difficulty in absorption of rate hikes Fall in DTH ARPUs beyond Rs35-40/month CAGR Multiple levers led by DTH to aid 37% CAGR in Subscription Delay/failure of big budget Endhiran Revenues: During FY2010-12E, we expect STNL to register a robust 37% CAGR in overall Subscription revenues aided by: 1) strong 58% CAGR in DTH revenues on the back of 28% CAGR in DTH subscribers and rise in ARPUs to Rs40, and 2) 20% CAGR in Analogue revenues aided by restructuring of distribution business and Malayalam channels (Surya TV, Kiran Key Financials (Consolidated) TV) turning pay, effective from April 1, 2010. Y/E March (Rs cr) FY2009 FY2010E FY2011E FY2012E FY2011E: Radio losses to reduce, Endhiran the wild card in FY2011E: Net Sales 1,039 1,453 1,978 2,217 Beyond broadcasting, we believe reduction in operating losses % chg 19.5 39.8 36.2 12.0 aided by revenue traction and cost curtailment in Radio Profit Net Profit 368 520 712 816 subsidiaries, Kal and SAFM (we have modeled in near breakeven % chg 12.7 41.2 36.9 14.6 in FY2012E at operating level) and contribution from big budget OPM (%) 70.9 75.1 75.7 76.1 movie, Endhiran (slated for release in 2HFY2011E, we have factored in Rs175cr revenue from movie distribution/production EPS (Rs) 9.3 13.2 18.1 20.7 in FY2011E and 20-25% EBIT Margins from Endhiran) will be P/E (x) 43.0 30.5 22.3 19.4 the key factors to watch out for. P/BV (x) 9.3 8.4 6.7 5.4 Outlook and Valuation RoE (%) 21.6 28.0 33.0 30.6 We initiate coverage on STNL with a Buy recommendation RoCE (%) 30.2 39.8 46.8 43.7 Target Price and Target Price of Rs497, equating to an upside of 24% from EV/Sales (x) 12.0 8.6 6.3 5.6 current levels. Our Target Price is based on 24x P/E FY2012E EV/EBITDA (x) 16.9 11.4 8.3 7.4 EPS of Rs20.7, 5% discount to its 3-year historical average P/E Source: Company, Angel Research; Price as on June 22, 2010 Research Analyst - Anand Shah Chitrangda Kapur Shah/Chitrangda Kapur For Private Circulation Only | Angel Broking Ltd: BSE Sebi Regn No : INB 010996539 / CDSL Regn No: IN - DP - CDSL - 234 - 2004 / PMS Regn Code: PM/INP00000154 6 Angel Securities Ltd:BSE: INB010994639/INF010994639 NSE: INB230994635/INF230994635 Membership numbers: BSE 028/NSE:09946 2
- 3. Fundamental Focus | June 26, 2010 Focus Indraprastha Gas - Buy Price - Rs255 Target Price - Rs301 Company Update Turning over a new leaf maintain large market share in the visible future post end of marketing exclusivity due to its strong parentage (BPCL, GAIL The hike in CNG prices has eliminated key headwinds for IGL and Government of Delhi), tie-ups with oil marketing companies viz. expected margin contraction and reduction in earnings and (OMCs) for dispensing CNG, significant expansion of CNG return ratios, to a large extent. Relative ease in pass through of stations till end of the exclusivity period. the APM gas price hike indicates absence of regulatory risks in the near term. This coupled with strong CNG conversions and At current levels of Rs255, the stock is discounting 14.6x and growth in newer geographies would result in strong earnings 12.0x FY2011E and FY2012E Earnings. IGL has historically growth and re-rating of the stock. traded in the range of 9-13x its one-year forward earnings. We upgrade our DCF-based target price of the IGL to Rs301 Margin erosion risk subsides: We had concerns over (Rs210) on the back of upward revision in earnings estimates sustainability of IGL's high margins, which we believed were and lower WACC estimates (to reflect lower pricing risk). Hence, fueled by lower gas costs (subsidised gas). Also, post end of we upgrade the stock to Buy from Reduce. marketing exclusivity in CY2011 we believed a level playing field would emerge and IGL would have to source gas at higher Exhibit 1: Change in estimates prices in turn squeezing its marketing margins. However, with Particulars Old estimates New estimates % chg the hike in CNG prices, our assumption of margin fall no longer Rs(cr) FY11E FY12E FY11E FY12E FY11E FY12E holds good. It also points at the absence of regulatory risks in Revenues 1,403 1,636 1,612 1,985 14.9 21.3 the near term. Going ahead, given that KG-D6 and APM gas prices are freezed till FY2014, IGL would not be required to EBITDA 367 422 472 606 28.5 43.6 make significant CNG price hikes. Thus, the margin erosion OPM (%) 26.2 25.8 29.3 30.5 risk has subsided substantially. EPS 13.3 14.5 17.5 21.3 31.2 46.7 Volumes to propel profitability: We expect strong growth in Source: Company, Angel Research CNG conversion in IGL's area of operation driven by discretionary CNG demand due to better economics. This coupled with strong growth expected in the domestic PNG Exhibit 2: Key Financials segment is likely to drive the company's volume growth going Y/E March (Rs cr) FY2009 FY2010E FY2011E FY2012E ahead. We expect CNG and PNG volumes to register a CAGR Total operating Income 853 1,084 1,612 1,985 of 14.4% and 36.2% over FY2010-12E respectively, resulting % chg 20.8 27.1 48.7 23.1 in overall volumes CAGR of 16.9% during the mentioned period. Profit Net Profit 172 215 244 298 Thus, strong volume growth coupled with stable EBDITA/scm are likely to drive the company’s profitability (CAGR of 17.5% % chg (1.1) 24.9 13.4 21.9 over FY2010-12E) going ahead. OPM (%) 35.2 35.7 29.3 30.5 Outlook and Valuation EPS (Rs) 12.3 15.4 17.5 21.3 P/E (x) 20.7 16.6 14.6 12.0 We believe that even post end of the marketing exclusivity in CY2011E, IGL will be able to maintain its margins, as the P/BV (x) 5.2 4.3 3.6 3.0 PNGRB regulations limits network and compression tariffs with RoE (%) 27.4 28.6 27.0 27.6 marketing margins being left out presuming it will be RoCE (%) 34.8 38.1 33.8 31.6 self-regulated due to competitive forces. As for the impact of EV/Sales (x) 3.9 3.2 2.2 1.9 the end of the marketing exclusivity on volumes is concerned, we believe that competition is likely to have minuscule impact EV/EBITDA (x) 11.1 8.9 7.7 6.3 on IGL's volumes. On the CNG volumes front, IGL is likely to Source: Company, Angel Research; Price as on June 22, 2010 Research Analyst - Deepak Pareek/Amit Vora For Private Circulation Only | Angel Broking Ltd: BSE Sebi Regn No : INB 010996539 / CDSL Regn No: IN - DP - CDSL - 234 - 2004 / PMS Regn Code: PM/INP00000154 6 Angel Securities Ltd:BSE: INB010994639/INF010994639 NSE: INB230994635/INF230994635 Membership numbers: BSE 028/NSE:09946 3
- 4. Fundamental Focus | June 26, 2010 Focus Reliance Industries - Buy Price - Rs1,063 Target Price - Rs1,260 Event Update RIL to buy 45% stake in Eagleford shale gas net resource potential for the JV of approximately 10tcfe (4.5tcfe net to RIL). The JV plans to increase the current drilling program Details of the Deal: Reliance Industries (RIL), through its 100% to approximately 140 wells per year within three years from 26 subsidiary, Reliance Eagleford Upstream LP has entered into a , wells planned in June-December 2010. The deal entails current joint venture (JV) with the United States-based Pioneer Natural production of 28mmcfepd (net 11mmcfepd to RIL) from the Resources Company, to acquire 45% stake in Pioneer's core five currently active horizontal wells. Another three wells would Eagleford shale acreage position in two separate transactions. be completed and expected to be online in 4QCY2010 following Newpek, a wholly-owned subsidiary of ALFA, S.A.B. de C.V., completion of gathering facilities. From each well around 6BCFE currently owns an approximate 16% non-operated interest in of gas is expected to be recoverable. Eagle Ford Shale acreage with the balance 84% held by operator, Pioneer Natural Resources. As per the deal, both the RIL and Pioneer have also executed definitive agreements to current owners will transfer 45% of their stake to Reliance set up a midstream JV that will service the gathering needs of Eagleford Upstream LP With this, the new ownership structure . the upstream JV. Reliance Eagleford Midstream LLC will pay US of the Eagle Ford Shale acreage will be Pioneer, RIL and Newpek $46mn to acquire a 49.9% membership interest in the owning 46%, 45% and 9%stake, respectively. RIL will pay US midstream JV, taking RIL's total investment in the venture to US $1,315mn (US $210mn will be paid to Newpek for diluting its $1.361bn. Pioneer and RIL will have equal governing rights in stake in favour of RIL) for its implied share of 118,000 net this JV with Pioneer serving as operator. Cash infusion by RIL acres. This upstream transaction consideration will include will enable the JV to ramp up production from Eagle Ford to as combined upfront cash payment of US $263mn and deferred much as 41,000boepd by 2013, from the average 2,000bpd payment of US $1,052mn associated with a carry arrangement in 2010. The company plans to increase drilling to 6-7 rigs by for 75% of Pioneer's and Newpek's capital costs over an 2010, 10 rigs by 2011 and 14 rigs by 2012 in its bid to enhance anticipated four years. The deal will be effective from production,. June 1, 2010. Future possibilities: Pioneer will be the sole leasing agent in the The acreage will support the drilling of over 1,750 wells with a area of mutual interest (AMI). As per the JV, Pioneer will continue acquiring leasehold in Eagle Ford Shale, while RIL will have the Exhibit 1: RIL's Shale Gas acquisitions compared option to acquire 45% share in all newly acquired acres. Also, Marcellus Atlas Ford Eagle Ford while the Pioneer will serve as the development operator for RIL Share in JV (%) 40 45 the upstream JV, RIL is expected to begin acting as development operator in certain areas in ensuing years as part of the JV. Acreage 300,000 263,000 Rationale for the deal: The deal would expand RIL's global Acreage (net acres to RIL) 120,000 118,000 footprint, maintain its growth rate via presence in newer avenues Reserves - JV (TCF) 13.3 10.0 viz. shale gas. RIL can also leverage the technological know-how to develop the unconventional shale gas resources Reserves - (Net to RIL, inTCF) 5.32 4.50 in the country. India is estimated to have huge shale deposits Upfront payment 340 263 across Gujarat, Assam, Rajasthan and other coastal areas. Drilling carry cost 1,360 1,052 Our Take - Strategic move: RIL will get hands-on experience Take operating up to four rigs. With this and the Atlas deal, RIL has Total Acquisition cost (USD bn) 1,700 1,315 joined the league of international oil companies who have Acquisition cost per acre (USD) 14,167 11,144 bought into shale rock formations that hold vast amounts of natural gas. Also, we believe that the deal has been executed Source: Company, Angel Research at a reasonable price, coupled with absence of exploration risks Continued... For Private Circulation Only | Angel Broking Ltd: BSE Sebi Regn No : INB 010996539 / CDSL Regn No: IN - DP - CDSL - 234 - 2004 / PMS Regn Code: PM/INP00000154 6 Angel Securities Ltd:BSE: INB010994639/INF010994639 NSE: INB230994635/INF230994635 Membership numbers: BSE 028/NSE:09946 4
- 5. Fundamental Focus | June 26, 2010 Focus Reliance Industries Event Update and the potential for RIL to gain shale gas expertise that it could positive catalyst to its stock price going ahead. This, along with apply elsewhere, including India. The deal valued at US its low Debt/Equity ratio of 0.42x is likely to keep RIL on high $11,144/acre is lower than the price paid for Atlas Shale Gas growth orbit. Recovery in Refining Margins and increase in gas acquisition (US $14,167/acre). Similarly, on the resource front, production are likely to drive the company's Earnings growth the acquisition cost of US $0.29/mmbtu is on the lower side over the next couple of years.Also the uncertainties and concerns compared to Atlas Shale Gas acquisition cost of associated with redeployment of cash flows are likely to be US $0.31/mmbtu. Direct comparisons are however not always addressed as growth and diversification plans of the company possible as all shale gas fields are different in terms of gas in crystallize over next couple of quarters, which is likely to provide place per tonne of shale, gas recovery rates, permeability and the required boost to the stock price. We maintain a Buy on the capital cost of extraction. RIL, Target Price RIL, with a Target Price of Rs1,260. The acquired acreage has significant liquid content, with 70% of the sites located within liquid-rich window. This is a key positive and meaningfully improves the deal economics by bringing down the gas breakeven price, given better crude-linked realisations from condensate and liquids. As per Scotia Waterous, the break-even price for Eagle Ford is the least at US $2.73/mmbtu followed by Marcellus at US $3.25/mmbtu. Assuming long-term gas prices of around US $5/mmbtu, cost of production at US $1.2/mmbtu, operating cost of US $1/mmbtu from the venture and at the recovery ratio of around 75-80%, the deal could add around Rs25-30 to our Target Price for RIL. Currently, we have not factored in the potential upside from the deal pending more details about the deal. Exhibit 2: Key Financials Y/E March (Rs cr) FY2009 FY2010E FY2011E FY2012E Outlook and Valuation Net sales 151,224 203,740 234,754 243,596 Overall, RIL has successfully executed its two mega ventures, % chg 10.3 34.7 15.2 3.8 viz. KG basin gas and the SEZ refinery with minimal execution problems as is evident from the strong ramp up in production Profit Net Profit 14,969 15,898 22,743 28,550 at both KG-D6 and SEZ refineries. These ventures speak about % chg (23.3) 6.2 43.1 25.5 RIL's successful execution capability as KG-D6 has been one of EPS (Rs) 45.8 48.6 69.5 87.3 the fastest deepwater developments across the globe, while the EBITDA Margin (%) 15.5 15.2 17.6 20.0 SEZ refinery is one of the most complex refineries. We expect P/E (x) 23.2 14.2 15.3 12.2 these ventures to be likely key drivers of Profitability over the next couple of years. We expect RIL's profitability to register RoE (%) 14.5 11.9 14.7 16.1 34% CAGR over FY2010-12E. Ramp up of gas production and RoCE (%) 8.4 8.0 11.4 13.8 higher oil production would likely increase the share of E&P in P/BV (x) 2.9 2.4 2.1 1.8 the Profit matrix in turn reducing exposure to cyclical segments. EV/ Sales (x) 2.7 1.9 1.6 1.4 Thus, we remain positive on RIL's future growth prospects. EV/ EBITDA (x) 17.1 12.4 8.9 7.1 We believe that RIL's inorganic growth plans would provide a Source: Company, Angel Research; Price as on June 25, 2010 Research Analyst - Deepak Pareek/Amit Vora For Private Circulation Only | Angel Broking Ltd: BSE Sebi Regn No : INB 010996539 / CDSL Regn No: IN - DP - CDSL - 234 - 2004 / PMS Regn Code: PM/INP00000154 6 Angel Securities Ltd:BSE: INB010994639/INF010994639 NSE: INB230994635/INF230994635 Membership numbers: BSE 028/NSE:09946 5
- 6. Fundamental Focus | June 26, 2010 Focus Container Corporation of India - Reduce Price - Rs1,306 Target Price - Rs1,194 Management Meet Note Margins to drag Outlook and Valuation Export revival yet to happen: Export volumes continue to remain Concor is gradually losing its pricing power in the Exim Segment, lacklustre in turn driving empty running. For first two months of which could be a further threat once more Rail-linked ICDs FY2011, the company recorded 147,000TEU of exports as from the private players come up. However, we remain bullish against 181,000TEU of imports leading to 18.5% empty on the Container sector in the long term, which is the core running. Going ahead, export growth rates may be further driver of Concor's business. Nonetheless, higher IR tariffs and impacted by the uncertain outlook in Europe. Pertinently, opening up of the Container industry to the private players will management indicated that the government's ban on export of impact the company's market share in the long run. We also non-basmati rice has impacted volumes to a large extent. believe that the company's growth trajectory will be lower than its historical trend. Thus, key risk to our recommendation will Volume guidance: Container Corporation of India (Concor) be Concor maintaining its market share and accelerated has guided modest Exim volume of 10-12% in FY2011E largely construction of the dedicated Rail-freight corridor, which could on account of the low base in 1HFY2010 and higher imports. help it wrest market share from the Road segment. Concor registered 9-10% yoy growth in Exim volume for the first two months of FY2011 in spite of the 21% yoy growth at We estimate Concor to post muted Earnings CAGR of 10.1% major ports. The company has guided 12-15% growth in over FY2010-12E, as against the 17.6% CAGR registered during domestic volumes with increased focus and strong revival in FY2005-09. At the current market price, the stock is trading at domestic consumption. Thus, it indicated that the share of 18.0x FY2012E Earnings and at 12.2x FY2012E EV/EBITDA. domestic volumes would increase to 25% by FY2012E from Target Price We maintain our Reduce rating on stock, with a Target Price of current levels of 22%. Rs1,194. Expects hike in haulage charges: Management stated that talks about Indian Railways (IR) increasing haulage charges on certain routes could come through in the near term. The recent hike in petroleum products has also led to increase in road freight rates. Key Financials (Consolidated) Management believes that it should be able to pass on any Y/E March (Rs cr) FY2009 FY2010 FY2011E FY2012E further increase in haulage charges, in absolute terms. However, Net Sales 3,452 3,702 4,130 4,714 we believe that any increase in haulage charges will be detrimental for Concor volumes. Further, if the haulage rates % chg 2.6 7.2 11.6 14.1 are increased in absolute terms it would impact margins. Profit Net Profit 779 779 842 944 % chg 6.1 (0.1) 8.2 12.1 Margin pressure to persist: FY2010 OPM fell by 80bp yoy to 26.4% on lower ground rent revenues, the company’s inability FDEPS (Rs) 59.9 59.9 64.8 72.6 to pass on the entire hike in haulage charges and rebates which EBITDA Margin (%) 26.8 26.4 25.8 25.1 pulled down Exim performance. Management has indicated P/E (x) 21.8 21.8 20.2 18.0 OPMs to remain range bound in FY2011E. However, we RoE (%) 22.6 19.4 18.4 18.1 estimate 50bp decline in OPM in FY2011E on account of increased contribution from the low-margin domestic business RoCE (%) 18.9 17.4 17.0 17.0 and higher empties in 1HFY2011E. P/BV (x) 4.9 4.2 3.7 3.3 EV/Sales (x) 4.4 4.1 3.6 3.1 EV/EBITDA (x) 16.5 15.4 13.9 12.2 Source: Company, Angel Research; Price as on June 23, 2010 Research Analyst -Param Desai/Mihit Salot For Private Circulation Only | Angel Broking Ltd: BSE Sebi Regn No : INB 010996539 / CDSL Regn No: IN - DP - CDSL - 234 - 2004 / PMS Regn Code: PM/INP00000154 6 Angel Securities Ltd:BSE: INB010994639/INF010994639 NSE: INB230994635/INF230994635 Membership numbers: BSE 028/NSE:09946 6
- 7. Technical Picks | June 26, 2010 Range-bound activity expected - Intermediate trend still up Sensex (17575) / Nifty (5269) In our previous Weekly report, we had mentioned that the Exhibit 1: Sensex Daily chart intermediate trend remains up and if the indices manage to trade and close above 17722/ 5302 levels then they are likely to test 17872 / 5350 levels or even the recent 7th April 2010 highs of 18047 / 5400 levels. The week witnessed a rally to the first mentioned target of 17872 / 5350 levels by registering a high of 17920 / 5367 but was unable to sustain gains, which led the Sensex to close with a marginal loss of 0.2%, while the Nifty lost 0.12% vis-à-vis the previous week. Pattern Formation Source: Falcon On the Daily chart, the move which started from 16560 to 17920 / 4967 to 5367 levels has Fibonacci supports levels at Exhibit 2: Sensex Weekly chart 17400 - 17240 - 17080 / 5214 - 5167 - 5120. Since the Shooting Star intermediate trend is up, there is a possibility that support is likely to emerge near those levels (refer Exhibit 1). On the Weekly chart, prices are still trading in an upward sloping channel. In addition to that, we are witnessing a candlestick pattern that resembles a "Shooting Star" which is a reversal pattern and suggests probable downside going forward. The high (17920 / 5367) of the "Shooting Star" will now act as a resistance for the market (refer Exhibit 2). Source: Falcon Future Outlook Broadly speaking, the indices are likely to trade in the range of 17000 / 5100 on the downside and 17920 / 5366 on the upside in the coming week. Since the intermediate trend is still up there is a possibility that the indices may find support at Fibonacci retracement levels of 17400 - 17240 - 17080 / 5214 - 5167 - 5120. On the upside, momentum would resume only once the resistance levels of 17920 / 5366 are crossed and indices may test 7th April 2010 highs of 18047 / 5400 levels. The uptrend on the Daily chart would be under serious threat if 16970 / 5090 levels are breached on the downside. For Private Circulation Only | Angel Broking Ltd: BSE Sebi Regn No : INB 010996539 / CDSL Regn No: IN - DP - CDSL - 234 - 2004 / PMS Regn Code: PM/INP00000154 6 Angel Securities Ltd:BSE: INB010994639/INF010994639 NSE: INB230994635/INF230994635 Membership numbers: BSE 028/NSE:09946 7
- 8. Technical Picks | June 26, 2010 Weekly Pivot Levels For Nifty 50 Stocks SCRIPS R2 R1 PIVOT PIVO S1 S2 SENSEX 18,053 17,814 17,680 17,441 17,307 NIFTY 5,405 5,337 5,299 5,230 5,192 BANKNIFTY 9,921 9,686 9,558 9,323 9,195 A.C.C. 916 889 870 843 824 ABB LTD. 901 887 874 860 846 AMBUJACEM 123 120 118 115 112 AXISBANK 1,307 1,278 1,249 1,220 1,191 BHARAT PETRO 704 662 593 552 483 BHARTIARTL 272 267 264 259 256 BHEL 2,513 2,483 2,444 2,413 2,375 CAIRN 323 317 311 305 298 CIPLA 361 354 344 337 327 DLF 299 293 287 281 276 GAIL 539 511 489 462 440 HCL TECHNOLO 411 385 369 343 327 HDFC BANK 2,036 1,992 1,966 1,922 1,896 HERO HONDA 2,104 2,080 2,041 2,017 1,978 HINDALCO 158 153 150 145 142 HINDUNILVR 284 275 266 257 247 HOUS DEV FIN 3,081 3,008 2,967 2,894 2,853 ICICI BANK 931 894 873 835 814 IDEA 60 58 56 54 52 IDFC 177 173 170 166 163 INFOSYS TECH 2,892 2,835 2,776 2,719 2,661 ITC 316 309 300 293 285 JINDL STL&PO 707 674 657 624 607 JPASSOCIAT 137 133 131 127 124 KOTAK BANK 827 789 769 731 711 LT 1,875 1,817 1,785 1,727 1,694 MAH & MAH 662 638 620 596 579 MARUTI 1,456 1,426 1,392 1,363 1,329 NTPC 209 203 198 192 188 ONGC CORP. 1,359 1,311 1,243 1,196 1,128 PNB 1,087 1,068 1,050 1,031 1,012 POWERGRID 105 103 102 100 99 RANBAXY LAB. 475 463 452 440 429 RCOM 204 198 189 183 174 REL.CAPITAL 802 785 765 748 728 RELIANCE 1,092 1,078 1,060 1,046 1,028 RELINFRA 1,217 1,192 1,174 1,149 1,131 RPOWER 176 172 169 165 162 SIEMENS 756 743 734 721 712 STATE BANK 2,447 2,374 2,330 2,256 2,212 STEEL AUTHOR 207 201 198 192 188 STER 194 181 174 161 154 SUN PHARMA. 1,886 1,838 1,778 1,730 1,670 SUZLON 61 59 58 56 55 TATA POWER 1,359 1,334 1,306 1,281 1,253 TATAMOTORS 844 806 786 749 728 TATASTEEL 521 505 493 477 465 TCS 807 783 770 745 732 UNITECH LTD 80 76 74 71 68 WIPRO 429 409 398 378 367 Technical Research Team For Private Circulation Only | Angel Broking Ltd: BSE Sebi Regn No : INB 010996539 / CDSL Regn No: IN - DP - CDSL - 234 - 2004 / PMS Regn Code: PM/INP00000154 6 Angel Securities Ltd:BSE: INB010994639/INF010994639 NSE: INB230994635/INF230994635 Membership numbers: BSE 028/NSE:09946 8
- 9. Derivatives Review | June 26, 2010 Immediate support 5200, may be put to test Nifty spot has closed at 5269 this week, against a close of 5263 last week. The Put-Call Ratio has decreased from 1.67 to 1.29 levels and the annualized Cost of Carry (CoC) is positive 2.98 The Open Interest in Nifty Futures has decreased by 9.46 2.98%. 9.46%. Put-Call Ratio Analysis Futures Annual Volatility Analysis The Nifty PCR is at 1.29 levels, in the new series. In the July The Historical Volatility of the Nifty has decreased from 24.38% expiry, the 5200 put option has highest open interest. On the to 22.69%. IV of at the money options has increased from 16% other hand, the 5400 and 5500 call options have almost same to 18%. Some liquid counters where HV has increased open interest. We may see some negative moves in the coming significantly are HINDPETRO, BPCL, IOC, ACC and week and 5200 is the immediate support for the market. NOIDATOLL. Stocks where HV has decreased are TATACOMM, Volatility in the stocks, mainly midcaps, could be seen. Thus, it GRASIM, PANTALOONR, ADANIENT and ABB. is advisable to use stock specific strategis. Open Interest Analysis Cost-of-Carry Analysis The total Open Interest of the market is Rs1,05,286cr, as against The July Future closed at a premium of 14.65 points as against Rs1,50,226cr last week, and the Stock Futures' open interest a premium of 0.95 points last week and Aug future closed at a decreased from Rs37,554cr to Rs31,158cr. We saw high rollover premium of 16.35 points. Some liquid counters where CoC in the new series. The Rollover for Nifty Futures and Minifty turned from negative to positive are RELMEDIA, UNIONBANK, futures is around 70% and market wide rollover is 82%. Some JINDALSTEL, RNRL and ADANIENT. Stocks where CoC turned large-cap stocks like ICICIBANK and TATASTEEL are showing from positive to negative are VIJAYABANK, EDUCOMP , resistance around 900-920 and 510-520 levels respectively. TATACHEM, ASHOKLEY and DENABANK. Derivative Strategy Scrip : RELIANCE CMP : Rs. 1062.95/- Lot Size : 250 Expiry Date (F&O) : 29th July, 2010 View: Mildly Bearish Strategy: Long Put Expected Payoff Buy/Sell Qty Scrip Strike Series Option Buy Rate Price Closing Price Expected rofit/Loss Profit/Loss Price Type (Rs.) Buy 250 RELIANCE 1050 July Put 20.00 Rs. 1000.00 Rs. 30.00 Rs. 1020.00 Rs. 10.00 BEP: Rs.1,030.00/- BEP: Rs. 1040.00 (Rs. 10.00) Max. Risk: Rs.5,000.00/- Max. Profit: Unlimited Profit: Rs. 1060.00 (Rs. 20.00) If Stock closes at or above Rs.1050 on expiry. If RELIANCE continues to trade below BEP . Rs. 1080.00 (Rs. 20.00) Note: Profit can be booked before expiry, if stock moves in a favorable direction. ote: Rs. 1100.00 (Rs. 20.00) For Private Circulation Only | Angel Broking Ltd: BSE Sebi Regn No : INB 010996539 / CDSL Regn No: IN - DP - CDSL - 234 - 2004 / PMS Regn Code: PM/INP00000154 6 Angel Securities Ltd:BSE: INB010994639/INF010994639 NSE: INB230994635/INF230994635 Membership numbers: BSE 028/NSE:09946 9
- 10. Fund Focus Mutual Fund Focus | June 26, 2010 Exchange Traded Funds and Gold ETFS exchange-traded An exchange-traded fund (ETF) is a type of fund whose investment Working of an Exchange Traded Funds objective is to achieve the same return as a particular market index. An ETF is similar to an index fund in the sense that it will Primary Market ETF Issuer Secondary Markets primarily invest in the securities of companies that are included in a selected market index. ETF Asset Classes Authorised Market Making/ Seller Participants / Financial ETFs can be of the following underlying asset classes Arbitrage Institutions Equity: ETFs investing in Equity Indices e.g. Nifty BeEs Cash ETF Bonds : ETFs that invest in Debt e.g. Liquid BeEs Buy/Sell Commodities: ETFs that invest in Commodities e.g. Gold ETFs Stock Exchange Subscription / Features of ETFs Redemption Immediate exposure to an entire or specific market. Cash ETF Correlation to the benchmark close to 1. Very low total expense ratio: 0.45% on average. No subscription/redemption fee. Fund Buyer No maturity date. Equally accessible both to institutional and retail investors. Current Scenario - Diversification with Gold Broad range of asset classes. Hedge against inflation. Advantages of ETFs Hedge against a declining dollar: Strong Negative Correlation. Allows you to implement asset allocation or portfolio investment Safe haven in times of geopolitical and financial market decision as Single Investment which is, instability. • Easier to track. Commodity based on gold's supply and demand fundamentals. • Small Investment amount. Store of value. Asset Classes are much simpler to track than individual stocks Portfolio diversifier; gold can act as portfolio insurance. since you do not have to worry about, • Quality of management. Due to rise in demand of gold, gold prices have increased thus causing a rally in stocks of gold mining companies. • Accounting frauds. • Off Balance sheet derivative losses. Due to lower inflation & deflation the input costs have come down thereby providing operating cash flows. • Individual Credit Quality. High quality and well diversified portfolio. Share prices of gold mining companies appreciate at twice the gold price. Generates income from frozen account. Since there is a negative correlation between the equity markets Gold Exchange Traded Funds-ETFs and gold it can act as hedge against the down fall in equity Open-ended MF schemes backed by units of physical gold. markets. Follow a passive investment strategy. Advantages Gold ETFs Buys & holds gold on behalf of investors without actively managing it. ETFs allow investment in gold in small denominations, which makes it easier for the retail investor to participate. Aims to give returns as close as possible, post-expenses, to that given for gold as a commodity. Quick and convenient dealing through demat account. Investor can buy & sell quickly at market price, making them No storage and security issue for investors. highly liquid assets. Taxation of Mutual Fund. Intra-day trading is possible with an ETF, but not with open-ended mutual funds. Can be traded on stock exchange like buying / selling a stock. Disclaimer: Angel Broking Ltd is not responsible for any error or inaccuracy or any losses suffered on account of information contained in this report. Data is obtained from MFI Explorer. Mutual Fund investments are subject to market risk. Please read the Scheme Information document carefully before investing. For Private Circulation Only | Angel Broking Ltd: BSE Sebi Regn No : INB 010996539 / CDSL Regn No: IN - DP - CDSL - 234 - 2004 / PMS Regn Code: PM/INP00000154 6 Angel Securities Ltd:BSE: INB010994639/INF010994639 NSE: INB230994635/INF230994635 Membership numbers: BSE 028/NSE:09946 10