Download to read offline

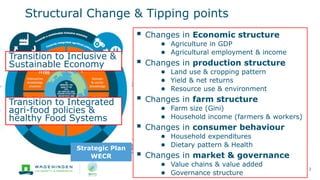
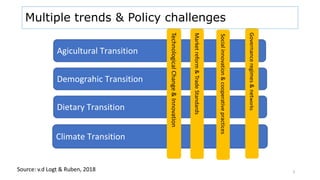
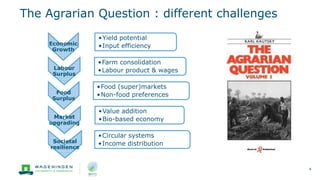
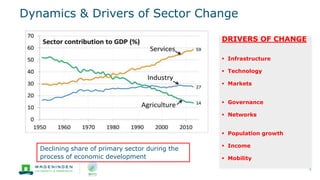
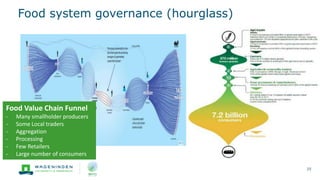
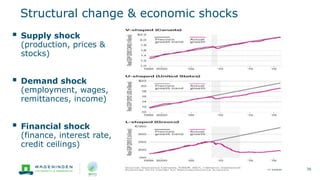

This document summarizes drivers and outcomes of structural change in agri-food systems and economies. It discusses changes in economic structure like declining agriculture GDP share and employment. Production structure changes like land use, yields and resource use. Farm structure changes such as increasing farm size and household income. Consumer behavior changes like diet, expenditures and health. Finally, it examines changes in markets and governance structures like value chains and policy networks.


