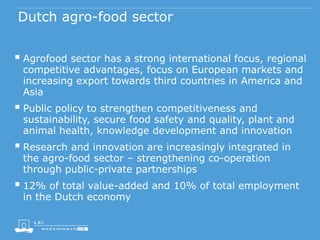
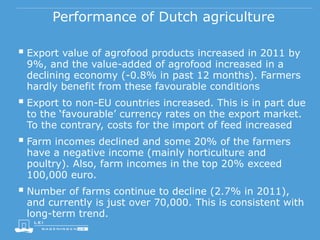
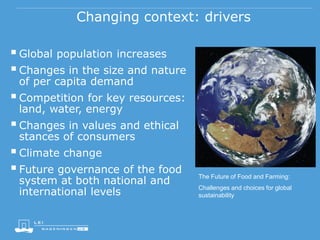
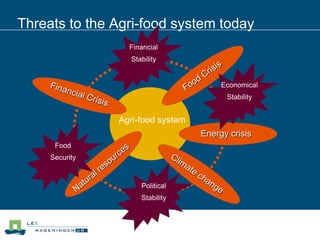
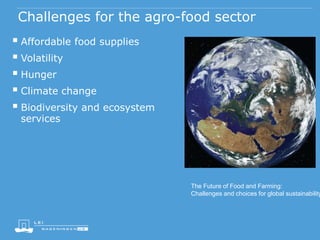
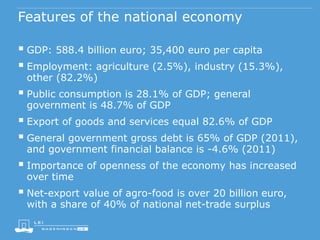
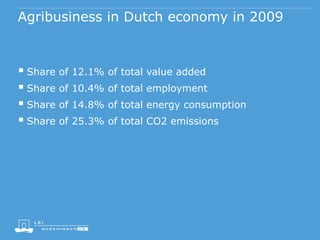
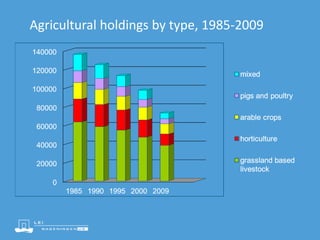
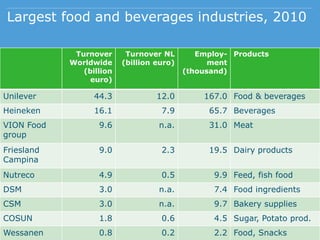
Comparative Advantages of Dutch agriculture
innovation – life-long learning – co-operation
Dutch agro-food sector
 Agrofood sector has a strong international focus, regional
competitive advantages, focus on European markets and
increasing export towards third countries in America and
Asia
 Public policy to strengthen competitiveness and
sustainability, secure food safety and quality, plant and
animal health, knowledge development and innovation
 Research and innovation are increasingly integrated in
the agro-food sector – strengthening co-operation
through public-private partnerships
 12% of total value-added and 10% of total employment
in the Dutch economy
Performance of Dutch agriculture
 Export value of agrofood products increased in 2011 by
9%, and the value-added of agrofood increased in a
declining economy (-0.8% in past 12 months). Farmers
hardly benefit from these favourable conditions
 Export to non-EU countries increased. This is in part due
to the ‘favourable’ currency rates on the export market.
To the contrary, costs for the import of feed increased
 Farm incomes declined and some 20% of the farmers
have a negative income (mainly horticulture and
poultry). Also, farm incomes in the top 20% exceed
100,000 euro.
 Number of farms continue to decline (2.7% in 2011),
and currently is just over 70,000. This is consistent with
long-term trend.
Changing context: drivers
Global population increases
Changes in the size and nature
of per capita demand
Competition for key resources:
land, water, energy
Changes in values and ethical
stances of consumers
Climate change
Future governance of the food
system at both national and
international levels
The Future of Food and Farming:
Challenges and choices for global
sustainability
Threats to the Agri-food system today
Energy crisis
Agri-food system
Financial
Stability
Political
Stability
Food
Security
Economical
Stability
Challenges for the agro-food sector
 Affordable food supplies
 Volatility
 Hunger
 Climate change
 Biodiversity and ecosystem
services
The Future of Food and Farming:
Challenges and choices for global sustainability
Part A – Features of the Dutch economy
Features of the national economy
 GDP: 588.4 billion euro; 35,400 euro per capita
 Employment: agriculture (2.5%), industry (15.3%),
other (82.2%)
 Public consumption is 28.1% of GDP; general
government is 48.7% of GDP
 Export of goods and services equal 82.6% of GDP
 General government gross debt is 65% of GDP (2011),
and government financial balance is -4.6% (2011)
 Importance of openness of the economy has increased
over time
 Net-export value of agro-food is over 20 billion euro,
with a share of 40% of national net-trade surplus
Impression of the country
Population: 16.6 million
Surface: 4 million ha (incl.
water), with half of the
country below sea level
Precipitation: 780 mm; 250
mm to the rivers/sea
Soils: sea-clay: 35%;
river-clay: 10%; sand:
35%; peat: 15%; silt: 5%
Logistics in the Netherlands – port of
Rotterdam
By far the largest seaport of Europe,
with over 400 million tons of cargo is
handled in Rotterdam per year. Out of
a daily total handling of 18,000
containers, 4,000 of them are with
China as country of origin or
destination. Some 40% of the
containers from Rotterdam with
destination China are empty, and only
1% of the incoming ones are empty.
More than 80% of export in agro-food
is to other EU countries
Challenge – global warming and flood
protection: the need for climate-proof policies
More than half of the
population live in flood
prone areas, and water
management is a main
issue. Maintenance and
update of flood defence, as
well as to meet climate
challenges, will require
annual investments
equivalent to 1% of GDP for
the coming decades
The country during night time; hotspots
are from glasshouse gardening near
Rotterdam and Almere
R&D policies of the business sector (‘top
sector’)
 Focus on key areas of competence where public and
private investments need to be prioritised and
bottlenecks solved
 The current top sectors include agro-food, horticulture
and source material, water, high-tech, life sciences,
chemicals, energy, logistics, creative industry
Top-sectors agro-food, horticulture and
source material
 Top-sectors will improve research and innovation, seek
for improvements in foreign policy, sector-specific
regulation, and education/human capital. Focus on
better transfer of knowledge from universities, overcome
lack of coordination, address too much detail in sector
regulation and insufficient supply of skilled labour. The
teams include sector expert, civil servant, SME
entrepreneur, representative of research institution
Part B – Successes of Dutch agriculture
Why is agriculture a successful business?
 High standards of trade and sea/river transport,
infrastructure
 High quality general education and entrepreneurship.
Research, extension and education
 Strong farmers unions and agricultural cooperatives.
Agribusiness (including cooperatives) for supplies and
marketing
 Beneficial agricultural development policy, including
investments in structural development, European
integration and the Common Agricultural Policy
Success factors identified by the
agricultural entrepreneur 2011
 Innovative
 Life-long learning
 Quality-based
 Cost-price targeted
 Market-oriented
 Client-focus
 Communicative
Public funds
Agribusiness in Dutch economy in 2009
 Share of 12.1% of total value added
 Share of 10.4% of total employment
 Share of 14.8% of total energy consumption
 Share of 25.3% of total CO2 emissions
Agribusiness complex in 2009
Agricultural holdings by type, 1985-2009
Spread of total income agricultural households
Average payments per potentially eligible
area and per beneficiary
23
0
100
200
300
400
500
600
700
800
Malta
Belgium
Netherlands
Italy
Greece
Cyprus
Denmark
Slovenia
Germany
France
EU-15
Luxembourg
EU-27
Ireland
Austria
Hungary
CzechRepublic
Spain
Finland
Sweden
UnitedKingdom
Bulgaria
Poland
EU-12
Slovakia
Romania
Portugal
Lithuania
Estonia
Latvia
EUR/ben.EUR/ha
0
8000
16000
24000
32000
40000
48000
DP net ceilings fully phased-in (EUR/ha)
EU-27 average
DP net ceilings fully phased-in (EUR/beneficiary)
Source: European Commission - DG Agriculture and Rural Development
Expected developments (2005=100)
Towards 2020: technology in agro-food
ICT
Nano- en micro
technology
-omics
Agro
sector
Biobased
Robotisation
Precision farming
Aquaculture
Meatreplacers
Logistics en supply chains
Emissions
Public and animal health
Challenges
Taking away impediments
Mainstream
Most applications
outside agriculture
Prospects for pasture-based livestock
farming
Number of farms will
decline substantially;
increase of scale in
industry
Fewer cows in fields
'Green' and ' blue'
services supplementary
source of farm income
Prospects for arable farming
Decline in employment
and number of farms
Acreage of sugar beet
and starch potatoes
decline; opportunities
for seed potatoes
More intensive
collaboration in the
chain (harvest chains)
Prospects for open field horticulture
Employment may
remain at current
level; substantial
decline in number of
holdings
Vulnerable to
availability of labor
during harvest season
Collaboration within
the chain and
shortening of the chain
Prospects for greenhouse horticulture
Number of holdings
decrease; very large
holdings on the rise
Modified business
structures: management
and ownership in
different hands
More collaboration
within the chain;
innovation in chain
management
Prospects for intensive livestock farming
Continuing increases in
scale focused on efficiency;
substantial decline in
number of farms
Enhanced harmonization in
the chain focused on fresh
and processed high-quality
products
Few opportunities for
diversification; off-farm
employment
Dairy sector
 Milk production is 11.9
billion kg, and the majority
is processed into cheese,
butter, powdered milk,
fresh milk products and
specialities
 Some 60% of domestic
milk production is exported.
There are 20,000 dairy
farms and 1.5 million dairy
cows and annual average
milk yield is 8,075 kg per
cow
Dairy cattle in the Netherlands
 Friesian Hollands is the
traditional breed, forming
the basis of the Holstein-
Friesian breed which
nowadays counts for 90%
of cattle.
 CR-Delta is the central
breeding organization, a
co-operative with 30,000
members (www.cr-
delta.nl)
Total export of milk/milk products (million kg)
Export of cheese in 2010 (million kg)
Exports to third
countries increased
significantly in the
recent past. Increase
was 18% in 2010,
emerging markets in
Africa, Central and
South America (Russia
and Mexico)
Economic figures for horticulture sector
 Horticulture sector represents 40% of total value of
agricultural production and in total amounts to 8 billion
euro in 2010
 Export value of horticulture is 16.2 billion euro
 Total output (average per holding) of horticulture under
glass is 1.6 million euro, and family farm income on
average is 110,000 euro (in 2010)
 More than 20% of total paid costs in horticulture under
glass is related to energy (natural gas and electricity)
Initiatives to combine technology with
environmental benefits
“Warm CO2” project, to
receive residual heat and
CO2 in Terneuzen from
artificial fertilizer plant and
distribute through pipeline
of 5 km to nearby
greenhouses, which will
reduce energy use in
glasshouses by 90 per cent
Largest food and beverages industries, 2010
Turnover
Worldwide
(billion
euro)
Turnover NL
(billion euro)
Employ-
ment
(thousand)
Products
Unilever 44.3 12.0 167.0 Food & beverages
Heineken 16.1 7.9 65.7 Beverages
VION Food
group
9.6 n.a. 31.0 Meat
Friesland
Campina
9.0 2.3 19.5 Dairy products
Nutreco 4.9 0.5 9.9 Feed, fish food
DSM 3.0 n.a. 7.4 Food ingredients
CSM 3.0 n.a. 9.7 Bakery supplies
COSUN 1.8 0.6 4.5 Sugar, Potato prod.
Wessanen 0.8 0.2 2.2 Food, Snacks
The Wageningen UR domain and mission
health, lifestyle, livelihood
food and
food production
living
environment
healthy food and living environment
Agric. & fisheries
Inf. animal diseases
Nutrition & health
Use of bio-mass
Food prod. chains
Food safety
Marine resource mmt
Landscape / land-use
Nature & biodiversity
Water management
Climate change
Competing claims
Behaviour/perception
Consumer/citizen
Policies
Institutions
Food security (Africa)
…to explore
the potential
of nature
to improve
the quality of
life…
Individual
Society
Community
Household
Gene/ MoleculeGene/ Molecule
Cel
Organism
Ecosystem
Planet
Approach: integration of knowledge
Policy and conditions
institutions
technology
Product
peopleprofitplanet
Organisational structure of Wageningen UR
Green Knowledge Cooperative
 Cooperation of preparatory professional education,
professional education, Institutes for Higher Professional
Education, Wageningen UR
 75,000 students, 15,000 employees and schools at 120
locations
 Critical success factors include (i) involvement of
business community, (ii) more value to knowledge, (iii)
regional embedding, (iv) attractive education and (v)
motivated students
 See also: www.gkc.nl
Innovations in Small and Medium-Sized
Enterprises
Ojah – 100% plant based
and sustainably produced
alternatives for meat and
fish (www.plenti.eu).
Innovations in Small and Medium-Sized
Enterprises
Sieplo – machine to
improve mixing of fodder
and concentrates for
production of calves
(www.siebelinkmachines.nl)
Innovations in Small and Medium-Sized
Enterprises
Scelta Mushrooms
(www.sceltamushrooms.com)
, to provide ‘Waste2Taste’
mushroom concentrates.
‘Waste’ products from
mushroom production are
valorised and used as health
products
Innovations in Small and Medium-Sized
Enterprises
Mardenkro – ReduFuse,
coatings for optimising
solar radiation and natural
gross light, to increase
productivity in glasshouse
production
(www.mardenkro.com)
Part C Future prospects
 Dutch-Asian collaboration. Export of food might be less
important than export of food production systems and
successful governance approaches through public-private
partnerships.
 High demand for safe, high quality and diversified food.
Green Deals
 Green deals are set up as a bottom-up approach to
establish green projects. Economically viable initiatives
are supported by removing barriers rather than public
support.
Insects for feed, food and pharma
Co-operation between
VENIK – Dutch association
for insect farmers,
InsectCentre and
Wageningen UR) targeted
to raise the introduction of
insects in food, feed and
pharma. This green deal is
aimed to increase
sustainably produced
protein, reduce emissions
and water use, prevent
waste, (www.venik.nl)
Invest into sustainable pig production
Substantially reduce energy
consumption in pig farming.
De Hoeve BV
(www.dehoevebv.nl)
initiated a chain to provide
sustainable pig meat, and
working with Ploos van
Amstel Consulting BV
(www.ploos-energie.nl) to
develop a zero-budget
sustainability instrument
Sustainability Understood
Co-operation of arable
farmers, companies
(including Suikerunie,
Heineken, Unilever, McCain),
and advice from DLV Plant
to strengthen sustainability
in arable production and
recover social cohesion
between food producers and
consumers. Search for best
practices and knowledge
sharing(www.veldleeuwerik.
nl).
Food valley
Concept of thematic
regional networking.
Knowledge, enterprise and
innovation are the key
factors for success. Food
Valleys brings them
together, to quickly unlock
the innovative capacity of
the agro-food sector in the
Netherlands. A Food Valley
Expo will be held on 25
October 2012.
(www.foodvalley.nl).
Concluding statements
Since 2004 the country
is second on the global
list of countries with
highest trade-surplus of
agro-food (except
2008). We target to
maintain this position
More than 60% of the
investments in agrofood
sector enhance
sustainability
Lessons for International collaboration
 Strengthen education (high school and university
training) and extension service to farmers
 Farmers to take their responsibility and secure the
provision of high quality food (environment, food safety,
animal welfare)
 Many farmers in the Netherlands do not receive CAP
support (horticulture, intensive livestock farming), farm
support programs remain important in other farm types.
It is in the range between 20,000 – 25,000 euro on dairy
and arable farms (40-50% of farm income)
 Enhance the ‘golden triangle’ of Government – Business
– Research
Thank you for your attention

Comparative advantages dutch agriculture

  • 1.
    Comparative Advantages ofDutch agriculture innovation – life-long learning – co-operation
  • 2.
    Dutch agro-food sector Agrofood sector has a strong international focus, regional competitive advantages, focus on European markets and increasing export towards third countries in America and Asia  Public policy to strengthen competitiveness and sustainability, secure food safety and quality, plant and animal health, knowledge development and innovation  Research and innovation are increasingly integrated in the agro-food sector – strengthening co-operation through public-private partnerships  12% of total value-added and 10% of total employment in the Dutch economy
  • 3.
    Performance of Dutchagriculture  Export value of agrofood products increased in 2011 by 9%, and the value-added of agrofood increased in a declining economy (-0.8% in past 12 months). Farmers hardly benefit from these favourable conditions  Export to non-EU countries increased. This is in part due to the ‘favourable’ currency rates on the export market. To the contrary, costs for the import of feed increased  Farm incomes declined and some 20% of the farmers have a negative income (mainly horticulture and poultry). Also, farm incomes in the top 20% exceed 100,000 euro.  Number of farms continue to decline (2.7% in 2011), and currently is just over 70,000. This is consistent with long-term trend.
  • 4.
    Changing context: drivers Globalpopulation increases Changes in the size and nature of per capita demand Competition for key resources: land, water, energy Changes in values and ethical stances of consumers Climate change Future governance of the food system at both national and international levels The Future of Food and Farming: Challenges and choices for global sustainability
  • 5.
    Threats to theAgri-food system today Energy crisis Agri-food system Financial Stability Political Stability Food Security Economical Stability
  • 6.
    Challenges for theagro-food sector  Affordable food supplies  Volatility  Hunger  Climate change  Biodiversity and ecosystem services The Future of Food and Farming: Challenges and choices for global sustainability
  • 7.
    Part A –Features of the Dutch economy
  • 8.
    Features of thenational economy  GDP: 588.4 billion euro; 35,400 euro per capita  Employment: agriculture (2.5%), industry (15.3%), other (82.2%)  Public consumption is 28.1% of GDP; general government is 48.7% of GDP  Export of goods and services equal 82.6% of GDP  General government gross debt is 65% of GDP (2011), and government financial balance is -4.6% (2011)  Importance of openness of the economy has increased over time  Net-export value of agro-food is over 20 billion euro, with a share of 40% of national net-trade surplus
  • 9.
    Impression of thecountry Population: 16.6 million Surface: 4 million ha (incl. water), with half of the country below sea level Precipitation: 780 mm; 250 mm to the rivers/sea Soils: sea-clay: 35%; river-clay: 10%; sand: 35%; peat: 15%; silt: 5%
  • 10.
    Logistics in theNetherlands – port of Rotterdam By far the largest seaport of Europe, with over 400 million tons of cargo is handled in Rotterdam per year. Out of a daily total handling of 18,000 containers, 4,000 of them are with China as country of origin or destination. Some 40% of the containers from Rotterdam with destination China are empty, and only 1% of the incoming ones are empty. More than 80% of export in agro-food is to other EU countries
  • 11.
    Challenge – globalwarming and flood protection: the need for climate-proof policies More than half of the population live in flood prone areas, and water management is a main issue. Maintenance and update of flood defence, as well as to meet climate challenges, will require annual investments equivalent to 1% of GDP for the coming decades
  • 12.
    The country duringnight time; hotspots are from glasshouse gardening near Rotterdam and Almere
  • 13.
    R&D policies ofthe business sector (‘top sector’)  Focus on key areas of competence where public and private investments need to be prioritised and bottlenecks solved  The current top sectors include agro-food, horticulture and source material, water, high-tech, life sciences, chemicals, energy, logistics, creative industry
  • 14.
    Top-sectors agro-food, horticultureand source material  Top-sectors will improve research and innovation, seek for improvements in foreign policy, sector-specific regulation, and education/human capital. Focus on better transfer of knowledge from universities, overcome lack of coordination, address too much detail in sector regulation and insufficient supply of skilled labour. The teams include sector expert, civil servant, SME entrepreneur, representative of research institution
  • 15.
    Part B –Successes of Dutch agriculture
  • 16.
    Why is agriculturea successful business?  High standards of trade and sea/river transport, infrastructure  High quality general education and entrepreneurship. Research, extension and education  Strong farmers unions and agricultural cooperatives. Agribusiness (including cooperatives) for supplies and marketing  Beneficial agricultural development policy, including investments in structural development, European integration and the Common Agricultural Policy
  • 17.
    Success factors identifiedby the agricultural entrepreneur 2011  Innovative  Life-long learning  Quality-based  Cost-price targeted  Market-oriented  Client-focus  Communicative
  • 18.
  • 19.
    Agribusiness in Dutcheconomy in 2009  Share of 12.1% of total value added  Share of 10.4% of total employment  Share of 14.8% of total energy consumption  Share of 25.3% of total CO2 emissions
  • 20.
  • 21.
    Agricultural holdings bytype, 1985-2009
  • 22.
    Spread of totalincome agricultural households
  • 23.
    Average payments perpotentially eligible area and per beneficiary 23 0 100 200 300 400 500 600 700 800 Malta Belgium Netherlands Italy Greece Cyprus Denmark Slovenia Germany France EU-15 Luxembourg EU-27 Ireland Austria Hungary CzechRepublic Spain Finland Sweden UnitedKingdom Bulgaria Poland EU-12 Slovakia Romania Portugal Lithuania Estonia Latvia EUR/ben.EUR/ha 0 8000 16000 24000 32000 40000 48000 DP net ceilings fully phased-in (EUR/ha) EU-27 average DP net ceilings fully phased-in (EUR/beneficiary) Source: European Commission - DG Agriculture and Rural Development
  • 24.
  • 25.
    Towards 2020: technologyin agro-food ICT Nano- en micro technology -omics Agro sector Biobased Robotisation Precision farming Aquaculture Meatreplacers Logistics en supply chains Emissions Public and animal health Challenges Taking away impediments Mainstream Most applications outside agriculture
  • 26.
    Prospects for pasture-basedlivestock farming Number of farms will decline substantially; increase of scale in industry Fewer cows in fields 'Green' and ' blue' services supplementary source of farm income
  • 27.
    Prospects for arablefarming Decline in employment and number of farms Acreage of sugar beet and starch potatoes decline; opportunities for seed potatoes More intensive collaboration in the chain (harvest chains)
  • 28.
    Prospects for openfield horticulture Employment may remain at current level; substantial decline in number of holdings Vulnerable to availability of labor during harvest season Collaboration within the chain and shortening of the chain
  • 29.
    Prospects for greenhousehorticulture Number of holdings decrease; very large holdings on the rise Modified business structures: management and ownership in different hands More collaboration within the chain; innovation in chain management
  • 30.
    Prospects for intensivelivestock farming Continuing increases in scale focused on efficiency; substantial decline in number of farms Enhanced harmonization in the chain focused on fresh and processed high-quality products Few opportunities for diversification; off-farm employment
  • 31.
    Dairy sector  Milkproduction is 11.9 billion kg, and the majority is processed into cheese, butter, powdered milk, fresh milk products and specialities  Some 60% of domestic milk production is exported. There are 20,000 dairy farms and 1.5 million dairy cows and annual average milk yield is 8,075 kg per cow
  • 32.
    Dairy cattle inthe Netherlands  Friesian Hollands is the traditional breed, forming the basis of the Holstein- Friesian breed which nowadays counts for 90% of cattle.  CR-Delta is the central breeding organization, a co-operative with 30,000 members (www.cr- delta.nl)
  • 33.
    Total export ofmilk/milk products (million kg)
  • 34.
    Export of cheesein 2010 (million kg) Exports to third countries increased significantly in the recent past. Increase was 18% in 2010, emerging markets in Africa, Central and South America (Russia and Mexico)
  • 35.
    Economic figures forhorticulture sector  Horticulture sector represents 40% of total value of agricultural production and in total amounts to 8 billion euro in 2010  Export value of horticulture is 16.2 billion euro  Total output (average per holding) of horticulture under glass is 1.6 million euro, and family farm income on average is 110,000 euro (in 2010)  More than 20% of total paid costs in horticulture under glass is related to energy (natural gas and electricity)
  • 36.
    Initiatives to combinetechnology with environmental benefits “Warm CO2” project, to receive residual heat and CO2 in Terneuzen from artificial fertilizer plant and distribute through pipeline of 5 km to nearby greenhouses, which will reduce energy use in glasshouses by 90 per cent
  • 37.
    Largest food andbeverages industries, 2010 Turnover Worldwide (billion euro) Turnover NL (billion euro) Employ- ment (thousand) Products Unilever 44.3 12.0 167.0 Food & beverages Heineken 16.1 7.9 65.7 Beverages VION Food group 9.6 n.a. 31.0 Meat Friesland Campina 9.0 2.3 19.5 Dairy products Nutreco 4.9 0.5 9.9 Feed, fish food DSM 3.0 n.a. 7.4 Food ingredients CSM 3.0 n.a. 9.7 Bakery supplies COSUN 1.8 0.6 4.5 Sugar, Potato prod. Wessanen 0.8 0.2 2.2 Food, Snacks
  • 38.
    The Wageningen URdomain and mission health, lifestyle, livelihood food and food production living environment healthy food and living environment Agric. & fisheries Inf. animal diseases Nutrition & health Use of bio-mass Food prod. chains Food safety Marine resource mmt Landscape / land-use Nature & biodiversity Water management Climate change Competing claims Behaviour/perception Consumer/citizen Policies Institutions Food security (Africa) …to explore the potential of nature to improve the quality of life…
  • 39.
    Individual Society Community Household Gene/ MoleculeGene/ Molecule Cel Organism Ecosystem Planet Approach:integration of knowledge Policy and conditions institutions technology Product peopleprofitplanet
  • 40.
  • 41.
    Green Knowledge Cooperative Cooperation of preparatory professional education, professional education, Institutes for Higher Professional Education, Wageningen UR  75,000 students, 15,000 employees and schools at 120 locations  Critical success factors include (i) involvement of business community, (ii) more value to knowledge, (iii) regional embedding, (iv) attractive education and (v) motivated students  See also: www.gkc.nl
  • 42.
    Innovations in Smalland Medium-Sized Enterprises Ojah – 100% plant based and sustainably produced alternatives for meat and fish (www.plenti.eu).
  • 43.
    Innovations in Smalland Medium-Sized Enterprises Sieplo – machine to improve mixing of fodder and concentrates for production of calves (www.siebelinkmachines.nl)
  • 44.
    Innovations in Smalland Medium-Sized Enterprises Scelta Mushrooms (www.sceltamushrooms.com) , to provide ‘Waste2Taste’ mushroom concentrates. ‘Waste’ products from mushroom production are valorised and used as health products
  • 45.
    Innovations in Smalland Medium-Sized Enterprises Mardenkro – ReduFuse, coatings for optimising solar radiation and natural gross light, to increase productivity in glasshouse production (www.mardenkro.com)
  • 46.
    Part C Futureprospects  Dutch-Asian collaboration. Export of food might be less important than export of food production systems and successful governance approaches through public-private partnerships.  High demand for safe, high quality and diversified food.
  • 47.
    Green Deals  Greendeals are set up as a bottom-up approach to establish green projects. Economically viable initiatives are supported by removing barriers rather than public support.
  • 48.
    Insects for feed,food and pharma Co-operation between VENIK – Dutch association for insect farmers, InsectCentre and Wageningen UR) targeted to raise the introduction of insects in food, feed and pharma. This green deal is aimed to increase sustainably produced protein, reduce emissions and water use, prevent waste, (www.venik.nl)
  • 49.
    Invest into sustainablepig production Substantially reduce energy consumption in pig farming. De Hoeve BV (www.dehoevebv.nl) initiated a chain to provide sustainable pig meat, and working with Ploos van Amstel Consulting BV (www.ploos-energie.nl) to develop a zero-budget sustainability instrument
  • 50.
    Sustainability Understood Co-operation ofarable farmers, companies (including Suikerunie, Heineken, Unilever, McCain), and advice from DLV Plant to strengthen sustainability in arable production and recover social cohesion between food producers and consumers. Search for best practices and knowledge sharing(www.veldleeuwerik. nl).
  • 51.
    Food valley Concept ofthematic regional networking. Knowledge, enterprise and innovation are the key factors for success. Food Valleys brings them together, to quickly unlock the innovative capacity of the agro-food sector in the Netherlands. A Food Valley Expo will be held on 25 October 2012. (www.foodvalley.nl).
  • 52.
    Concluding statements Since 2004the country is second on the global list of countries with highest trade-surplus of agro-food (except 2008). We target to maintain this position More than 60% of the investments in agrofood sector enhance sustainability
  • 53.
    Lessons for Internationalcollaboration  Strengthen education (high school and university training) and extension service to farmers  Farmers to take their responsibility and secure the provision of high quality food (environment, food safety, animal welfare)  Many farmers in the Netherlands do not receive CAP support (horticulture, intensive livestock farming), farm support programs remain important in other farm types. It is in the range between 20,000 – 25,000 euro on dairy and arable farms (40-50% of farm income)  Enhance the ‘golden triangle’ of Government – Business – Research
  • 54.
    Thank you foryour attention