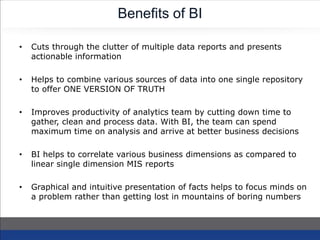
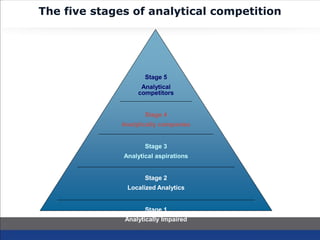
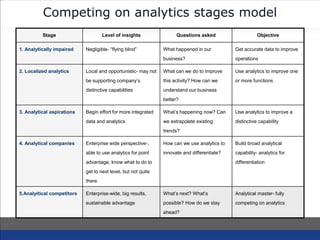
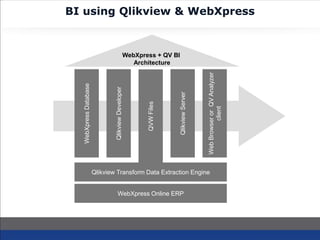
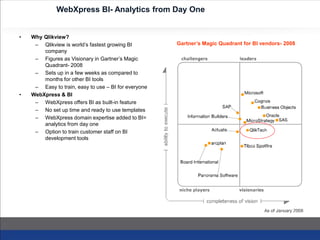
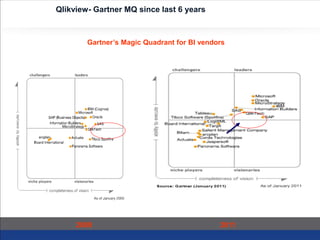
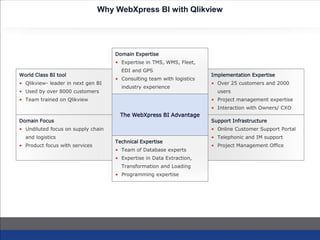
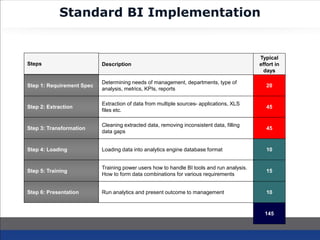
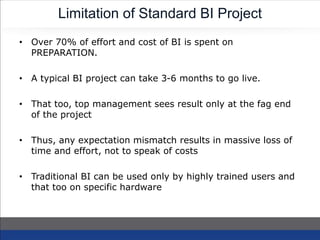
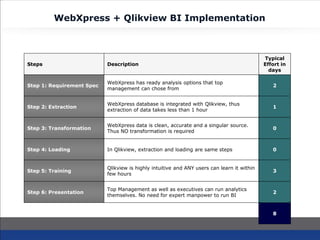
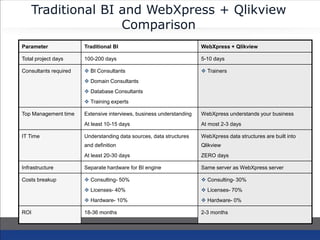
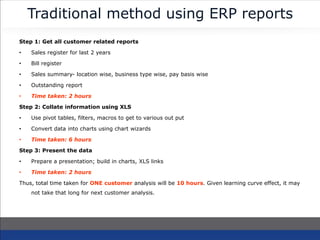
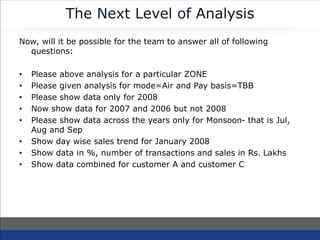
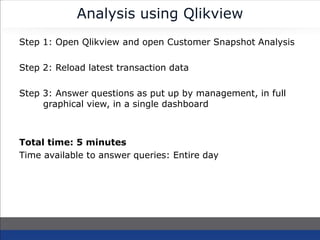
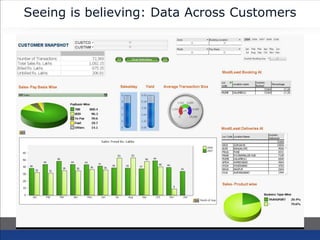
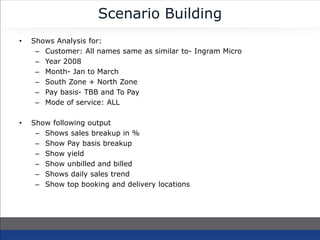
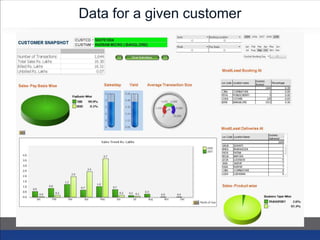
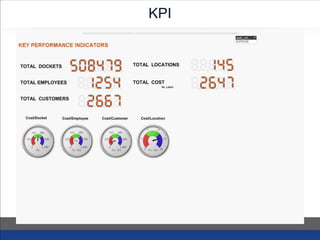
Business Intelligence for
Logistics Industry
Competing on Analytics
Why compete on Analytics?
• Companies offer similar products and
use similar technology
• Geographical advantage or protective
regulation are eroded by liberalization
and globalization
• Proprietary technologies are rapidly
copied
• Breakthrough innovation in products
and services are increasingly difficult
to achieve
New Basis of Competition
• Efficient and effective execution
• Smart Decision making
• Ability to wring last drop of value from
business processes
• All of above can be gained from
sophisticated use of ANALYTICS
What is Business Intelligence
• Business intelligence (BI) refers to skills, knowledge,
technologies, applications and practices used to help a
business to acquire a better understanding of the market
behavior and business context.
• The purpose of business intelligence is to support better
business decision making.
What are Analytics
• Analytics means extensive use of data, statistical and
quantitative analysis, explanatory and predictive models
and fact-based management to drive decisions and actions
• Analytics are subset of Business Intelligence
• Business Intelligence is a set of technologies and processes
that use data to understand and analyze business
performance
• Business Intelligence includes both data access and
reporting & analytics
Business Intelligence & Analytics
Analytic
s
Access
&
reporting
Degree of Intelligence
CompetitiveAdvantage
Optimization
Predictive Modeling
Forecasting/ extrapolation
Statistical Analysis
Alerts
Query/ Drill down
Ad hoc reports
Standard Reports
 What’s the best that can happen?
 What will happen next?
 What if these trends continue?
 Why is this happening?
 What actions are needed?
 Where exactly is the problem?
 How many, how often, where?
 What happened?
Benefits of BI
• Cuts through the clutter of multiple data reports and presents
actionable information
• Helps to combine various sources of data into one single repository
to offer ONE VERSION OF TRUTH
• Improves productivity of analytics team by cutting down time to
gather, clean and process data. With BI, the team can spend
maximum time on analysis and arrive at better business decisions
• BI helps to correlate various business dimensions as compared to
linear single dimension MIS reports
• Graphical and intuitive presentation of facts helps to focus minds on
a problem rather than getting lost in mountains of boring numbers
Stages of Analytical Competition
The five stages of analytical competition
Stage 1
Analytically Impaired
Stage 2
Localized Analytics
Stage 3
Analytical aspirations
Stage 4
Analytically companies
Stage 5
Analytical
competitors
Competing on analytics stages model
Stage Level of insights Questions asked Objective
1. Analytically impaired Negligible- “flying blind” What happened in our
business?
Get accurate data to improve
operations
2. Localized analytics Local and opportunistic- may not
be supporting company’s
distinctive capabilities
What can we do to improve
this activity? How can we
understand our business
better?
Use analytics to improve one
or more functions
3. Analytical aspirations Begin effort for more integrated
data and analytics
What’s happening now? Can
we extrapolate existing
trends?
Use analytics to improve a
distinctive capability
4. Analytical companies Enterprise wide perspective-,
able to use analytics for point
advantage, know what to do to
get to next level, but not quite
there
How can we use analytics to
innovate and differentiate?
Build broad analytical
capability- analytics for
differentiation
5.Analyitical competitors Enterprise-wide, big results,
sustainable advantage
What’s next? What’s
possible? How do we stay
ahead?
Analytical master- fully
competing on analytics
BI-- Qlikview + WebXpress
BI Architecture
DataManagement
TransformationToolsand
processes
Repositories
Analyticaltoolsand
applications
Presentationtoolsand
applications
Metadata
Operational Processes
Business Intelligence
Architecture
BI using Qlikview & WebXpress
WebXpressDatabase
QlikviewDeveloper
QVWFiles
QlikviewServer
WebBrowserorQVAnalyzer
client
Qlikview Transform Data Extraction Engine
WebXpress Online ERP
WebXpress + QV BI
Architecture
About Qlikview
• Qlikview, brough to you by Qliktech, is the world’s fastest-growing Business Intelligence
software (IDC 2008)
• QlikTech has approximately 9,050 customers in 86 countries and more than 500 partners
worldwide.
• Qlikview’s patented in-memory association technology brings fast results and better
decision making to a wide range of customers and industries.
• QlikView is intuitive to learn, simple to modify and can be deployed in less than a week.
• QlikTech was founded in Lund, Sweden and is headquartered in Radnor, PA (USA) with
direct operations throughout Europe and the Americas.
About WebXpress
• WebXpress is India’s leading Logistics software solution suite that caters to Logistics Service
Providers as well as Users of Logistics Services
• WebXpress is brought to you by ECFY Consulting Pvt. Ltd., a logistics technology solutions
company based at Mumbai, India.
Finance & Accounts | CRM
Business Intelligence- Qlikview
DEVICES
Mobile
GPS
Bar Code
Sensors
B2B
Integration
EDI
RosettaNet
XML
Allied Services: Managed Web Hosting | Connectivity
Customer
Portal
• Tracking
• Invoice
• Complaints
• Enquiry
• Contracts
• E-POD
WebXpress Product Suite
Fleet Management Transportation WarehousingFleet Management Transportation WarehousingFleet Management Transportation WarehousingFleet Management Transportation WarehousingFleet Management
WebXpress BI- Analytics from Day One
• Why Qlikview?
– Qlikview is world’s fastest growing BI
company
– Figures as Visionary in Gartner’s Magic
Quadrant- 2008
– Sets up in a few weeks as compared to
months for other BI tools
– Easy to train, easy to use – BI for everyone
• WebXpress & BI
– WebXpress offers BI as built-in feature
– No set up time and ready to use templates
– WebXpress domain expertise added to BI=
analytics from day one
– Option to train customer staff on BI
development tools
Gartner’s Magic Quadrant for BI vendors- 2008
Qlikview- Gartner MQ since last 6 years
Gartner’s Magic Quadrant for BI vendors
2009 2011
Aberdeen Says
WebXpress BI Services
• Ready to use analytics: WebXpress team has prepared a set of analytics reports for
various business areas. Customer can evaluate and pick and chose from these ready
templates
• Study of new analytics: WebXpress domain experts will work with Safexpress
decision makers to understand their analytical reporting requirements. These will be
beyond ready to use templates
• Study of OLTP database: WebXpress technical team will study the data structure of
various tables to understand table and field definitions, table relationships etc. The
team will map the fields with those required for analytics.
• Load OLTP data into Qlikview: WebXpress technical team will design scripts to
load data from OLTP system into Qlikview Data Files called QVDs
• Design/ deploy analytics: WebXpress team will then design analytics using
Qlikview development tool and connect the analytics to data sources
• Training: WebXpress team will also train Safexpress technical team in use of
Qlikview. WebXpress team will separately train users of analytics as to how Qlikview
should be operated
Advantages of WebXpress
Qlikview BI
Why WebXpress BI with Qlikview
World Class BI tool
• Qlikview- leader in next gen BI
• Used by over 8000 customers
• Team trained on Qlikview
Support Infrastructure
• Online Customer Support Portal
• Telephonic and IM support
• Project Management Office
Domain Focus
• Undiluted focus on supply chain
and logistics
• Product focus with services
Implementation Expertise
• Over 25 customers and 2000
users
• Project management expertise
• Interaction with Owners/ CXO
The WebXpress BI Advantage
Domain Expertise
• Expertise in TMS, WMS, Fleet,
EDI and GPS
• Consulting team with logistics
industry experience
Technical Expertise
• Team of Database experts
• Expertise in Data Extraction,
Transformation and Loading
• Programming expertise
Standard BI Implementation
Step 2: Extraction
Extraction of data from multiple sources- applications, XLS
files etc.
45
Step 3: Transformation
Cleaning extracted data, removing inconsistent data, filling
data gaps
45
Step 4: Loading Loading data into analytics engine database format 10
Step 1: Requirement Spec
Determining needs of management, departments, type of
analysis, metrics, KPIs, reports
20
Step 5: Training
Training power users how to handle BI tools and run analysis.
How to form data combinations for various requirements
15
Step 6: Presentation Run analytics and present outcome to management 10
Steps Description
Typical
effort in
days
145
Limitation of Standard BI Project
• Over 70% of effort and cost of BI is spent on
PREPARATION.
• A typical BI project can take 3-6 months to go live.
• That too, top management sees result only at the fag end
of the project
• Thus, any expectation mismatch results in massive loss of
time and effort, not to speak of costs
• Traditional BI can be used only by highly trained users and
that too on specific hardware
WebXpress + Qlikview BI Implementation
Step 2: Extraction
WebXpress database is integrated with Qlikview, thus
extraction of data takes less than 1 hour
1
Step 3: Transformation
WebXpress data is clean, accurate and a singular source.
Thus NO transformation is required
0
Step 4: Loading In Qlikview, extraction and loading are same steps 0
Step 1: Requirement Spec
WebXpress has ready analysis options that top
management can chose from
2
Step 5: Training
Qlikview is highly intuitive and ANY users can learn it within
few hours
3
Step 6: Presentation
Top Management as well as executives can run analytics
themselves. No need for expert manpower to run BI
2
Steps Description
Typical
Effort in
days
8
Traditional BI and WebXpress + Qlikview
Comparison
Parameter Traditional BI WebXpress + Qlikview
Total project days 100-200 days 5-10 days
Consultants required  BI Consultants
 Domain Consultants
 Database Consultants
 Training experts
 Trainers
Top Management time Extensive interviews, business understanding
At least 10-15 days
WebXpress understands your business
At most 2-3 days
IT Time Understanding data sources, data structures
and definition
At least 20-30 days
WebXpress data structures are built into
Qlikview
ZERO days
Infrastructure Separate hardware for BI engine Same server as WebXpress server
Costs breakup  Consulting- 50%
 Licenses- 40%
 Hardware- 10%
 Consulting- 30%
 Licenses- 70%
 Hardware- 0%
ROI 18-36 months 2-3 months
Qlikview BI Technical
Architecture
Qlikview BI deployment
WebXpress SQL
Database
Oracle Database
Other data
sources, XLS files
Extract, Transform, Load, Schedule
Analytics Development
Analytics File Repository
Qlikview Desktop
Edition
Qlikview Browser
Edition
3G Mobile
Network
Qlikview Small Business Server
VPN/ INTERNET
Qlikview iPhone/ Android/
iPad client
Qlikview Solution Components
Qlikview Server
• Deployment of Qlikview on Internet
• Repository of QVW files to be opened in browser
• Connection to Qlikview Enterprise
Qlikview Personal Edition • Development tool to create new analytics
• Add, edit, delete charts
• Add data sources such as XLS
• Connect to Qlikview Enterprise repository
Qlikview Product • Usage
QV Analyzer on Desktop • Run analytics charts by changing parameters
• Export charts, data tables
• Decision making based on analytics
• Connect to Qlikview Enterprise repository
QV Analyzer on Browser • Browser based access of Qlikview files
• Export charts, data tables
• Decision making based on analytics
• Connect to Qlikview Enterprise repository
Customer Analysis
Traditional method using ERP reports
Step 1: Get all customer related reports
• Sales register for last 2 years
• Bill register
• Sales summary- location wise, business type wise, pay basis wise
• Outstanding report
• Time taken: 2 hours
Step 2: Collate information using XLS
• Use pivot tables, filters, macros to get to various out put
• Convert data into charts using chart wizards
• Time taken: 6 hours
Step 3: Present the data
• Prepare a presentation; build in charts, XLS links
• Time taken: 2 hours
Thus, total time taken for ONE customer analysis will be 10 hours. Given learning curve effect, it may
not take that long for next customer analysis.
The Next Level of Analysis
Now, will it be possible for the team to answer all of following
questions:
• Please above analysis for a particular ZONE
• Please given analysis for mode=Air and Pay basis=TBB
• Please show data only for 2008
• Now show data for 2007 and 2006 but not 2008
• Please show data across the years only for Monsoon- that is Jul,
Aug and Sep
• Show day wise sales trend for January 2008
• Show data in %, number of transactions and sales in Rs. Lakhs
• Show data combined for customer A and customer C
Analysis using Qlikview
Step 1: Open Qlikview and open Customer Snapshot Analysis
Step 2: Reload latest transaction data
Step 3: Answer questions as put up by management, in full
graphical view, in a single dashboard
Total time: 5 minutes
Time available to answer queries: Entire day
Seeing is believing: Data Across Customers
Scenario Building
• Shows Analysis for:
– Customer: All names same as similar to- Ingram Micro
– Year 2008
– Month- Jan to March
– South Zone + North Zone
– Pay basis- TBB and To Pay
– Mode of service: ALL
• Show following output
– Shows sales breakup in %
– Show Pay basis breakup
– Show yield
– Show unbilled and billed
– Shows daily sales trend
– Show top booking and delivery locations
Data for a given customer
Cost Analysis
KPI
Cost BreakUp
Top Cost Analysis
Cost Register
Cost Trends
Thank You
KEEP IN TOUCH
Headquarters Regional Sales Office
114, Sundervilla, S. V. Road,
Santacruz (West), Mumbai – 400052
9122-2660-5375
552, 2nd Floor Gram Sabha Pooth Kalan ,
New Delhi - 110042
+91-9582600153
business@webxpress.in www.webxpress.in

WebXpress Business Intelligence Capability

  • 1.
    Business Intelligence for LogisticsIndustry Competing on Analytics
  • 2.
    Competing on Analytics Whycompete on Analytics? • Companies offer similar products and use similar technology • Geographical advantage or protective regulation are eroded by liberalization and globalization • Proprietary technologies are rapidly copied • Breakthrough innovation in products and services are increasingly difficult to achieve New Basis of Competition • Efficient and effective execution • Smart Decision making • Ability to wring last drop of value from business processes • All of above can be gained from sophisticated use of ANALYTICS
  • 3.
    What is BusinessIntelligence • Business intelligence (BI) refers to skills, knowledge, technologies, applications and practices used to help a business to acquire a better understanding of the market behavior and business context. • The purpose of business intelligence is to support better business decision making.
  • 4.
    What are Analytics •Analytics means extensive use of data, statistical and quantitative analysis, explanatory and predictive models and fact-based management to drive decisions and actions • Analytics are subset of Business Intelligence • Business Intelligence is a set of technologies and processes that use data to understand and analyze business performance • Business Intelligence includes both data access and reporting & analytics
  • 5.
    Business Intelligence &Analytics Analytic s Access & reporting Degree of Intelligence CompetitiveAdvantage Optimization Predictive Modeling Forecasting/ extrapolation Statistical Analysis Alerts Query/ Drill down Ad hoc reports Standard Reports  What’s the best that can happen?  What will happen next?  What if these trends continue?  Why is this happening?  What actions are needed?  Where exactly is the problem?  How many, how often, where?  What happened?
  • 6.
    Benefits of BI •Cuts through the clutter of multiple data reports and presents actionable information • Helps to combine various sources of data into one single repository to offer ONE VERSION OF TRUTH • Improves productivity of analytics team by cutting down time to gather, clean and process data. With BI, the team can spend maximum time on analysis and arrive at better business decisions • BI helps to correlate various business dimensions as compared to linear single dimension MIS reports • Graphical and intuitive presentation of facts helps to focus minds on a problem rather than getting lost in mountains of boring numbers
  • 7.
  • 8.
    The five stagesof analytical competition Stage 1 Analytically Impaired Stage 2 Localized Analytics Stage 3 Analytical aspirations Stage 4 Analytically companies Stage 5 Analytical competitors
  • 9.
    Competing on analyticsstages model Stage Level of insights Questions asked Objective 1. Analytically impaired Negligible- “flying blind” What happened in our business? Get accurate data to improve operations 2. Localized analytics Local and opportunistic- may not be supporting company’s distinctive capabilities What can we do to improve this activity? How can we understand our business better? Use analytics to improve one or more functions 3. Analytical aspirations Begin effort for more integrated data and analytics What’s happening now? Can we extrapolate existing trends? Use analytics to improve a distinctive capability 4. Analytical companies Enterprise wide perspective-, able to use analytics for point advantage, know what to do to get to next level, but not quite there How can we use analytics to innovate and differentiate? Build broad analytical capability- analytics for differentiation 5.Analyitical competitors Enterprise-wide, big results, sustainable advantage What’s next? What’s possible? How do we stay ahead? Analytical master- fully competing on analytics
  • 10.
    BI-- Qlikview +WebXpress
  • 11.
  • 12.
    BI using Qlikview& WebXpress WebXpressDatabase QlikviewDeveloper QVWFiles QlikviewServer WebBrowserorQVAnalyzer client Qlikview Transform Data Extraction Engine WebXpress Online ERP WebXpress + QV BI Architecture
  • 13.
    About Qlikview • Qlikview,brough to you by Qliktech, is the world’s fastest-growing Business Intelligence software (IDC 2008) • QlikTech has approximately 9,050 customers in 86 countries and more than 500 partners worldwide. • Qlikview’s patented in-memory association technology brings fast results and better decision making to a wide range of customers and industries. • QlikView is intuitive to learn, simple to modify and can be deployed in less than a week. • QlikTech was founded in Lund, Sweden and is headquartered in Radnor, PA (USA) with direct operations throughout Europe and the Americas.
  • 14.
    About WebXpress • WebXpressis India’s leading Logistics software solution suite that caters to Logistics Service Providers as well as Users of Logistics Services • WebXpress is brought to you by ECFY Consulting Pvt. Ltd., a logistics technology solutions company based at Mumbai, India. Finance & Accounts | CRM Business Intelligence- Qlikview DEVICES Mobile GPS Bar Code Sensors B2B Integration EDI RosettaNet XML Allied Services: Managed Web Hosting | Connectivity Customer Portal • Tracking • Invoice • Complaints • Enquiry • Contracts • E-POD WebXpress Product Suite Fleet Management Transportation WarehousingFleet Management Transportation WarehousingFleet Management Transportation WarehousingFleet Management Transportation WarehousingFleet Management
  • 15.
    WebXpress BI- Analyticsfrom Day One • Why Qlikview? – Qlikview is world’s fastest growing BI company – Figures as Visionary in Gartner’s Magic Quadrant- 2008 – Sets up in a few weeks as compared to months for other BI tools – Easy to train, easy to use – BI for everyone • WebXpress & BI – WebXpress offers BI as built-in feature – No set up time and ready to use templates – WebXpress domain expertise added to BI= analytics from day one – Option to train customer staff on BI development tools Gartner’s Magic Quadrant for BI vendors- 2008
  • 16.
    Qlikview- Gartner MQsince last 6 years Gartner’s Magic Quadrant for BI vendors 2009 2011
  • 17.
  • 18.
    WebXpress BI Services •Ready to use analytics: WebXpress team has prepared a set of analytics reports for various business areas. Customer can evaluate and pick and chose from these ready templates • Study of new analytics: WebXpress domain experts will work with Safexpress decision makers to understand their analytical reporting requirements. These will be beyond ready to use templates • Study of OLTP database: WebXpress technical team will study the data structure of various tables to understand table and field definitions, table relationships etc. The team will map the fields with those required for analytics. • Load OLTP data into Qlikview: WebXpress technical team will design scripts to load data from OLTP system into Qlikview Data Files called QVDs • Design/ deploy analytics: WebXpress team will then design analytics using Qlikview development tool and connect the analytics to data sources • Training: WebXpress team will also train Safexpress technical team in use of Qlikview. WebXpress team will separately train users of analytics as to how Qlikview should be operated
  • 19.
  • 20.
    Why WebXpress BIwith Qlikview World Class BI tool • Qlikview- leader in next gen BI • Used by over 8000 customers • Team trained on Qlikview Support Infrastructure • Online Customer Support Portal • Telephonic and IM support • Project Management Office Domain Focus • Undiluted focus on supply chain and logistics • Product focus with services Implementation Expertise • Over 25 customers and 2000 users • Project management expertise • Interaction with Owners/ CXO The WebXpress BI Advantage Domain Expertise • Expertise in TMS, WMS, Fleet, EDI and GPS • Consulting team with logistics industry experience Technical Expertise • Team of Database experts • Expertise in Data Extraction, Transformation and Loading • Programming expertise
  • 21.
    Standard BI Implementation Step2: Extraction Extraction of data from multiple sources- applications, XLS files etc. 45 Step 3: Transformation Cleaning extracted data, removing inconsistent data, filling data gaps 45 Step 4: Loading Loading data into analytics engine database format 10 Step 1: Requirement Spec Determining needs of management, departments, type of analysis, metrics, KPIs, reports 20 Step 5: Training Training power users how to handle BI tools and run analysis. How to form data combinations for various requirements 15 Step 6: Presentation Run analytics and present outcome to management 10 Steps Description Typical effort in days 145
  • 22.
    Limitation of StandardBI Project • Over 70% of effort and cost of BI is spent on PREPARATION. • A typical BI project can take 3-6 months to go live. • That too, top management sees result only at the fag end of the project • Thus, any expectation mismatch results in massive loss of time and effort, not to speak of costs • Traditional BI can be used only by highly trained users and that too on specific hardware
  • 23.
    WebXpress + QlikviewBI Implementation Step 2: Extraction WebXpress database is integrated with Qlikview, thus extraction of data takes less than 1 hour 1 Step 3: Transformation WebXpress data is clean, accurate and a singular source. Thus NO transformation is required 0 Step 4: Loading In Qlikview, extraction and loading are same steps 0 Step 1: Requirement Spec WebXpress has ready analysis options that top management can chose from 2 Step 5: Training Qlikview is highly intuitive and ANY users can learn it within few hours 3 Step 6: Presentation Top Management as well as executives can run analytics themselves. No need for expert manpower to run BI 2 Steps Description Typical Effort in days 8
  • 24.
    Traditional BI andWebXpress + Qlikview Comparison Parameter Traditional BI WebXpress + Qlikview Total project days 100-200 days 5-10 days Consultants required  BI Consultants  Domain Consultants  Database Consultants  Training experts  Trainers Top Management time Extensive interviews, business understanding At least 10-15 days WebXpress understands your business At most 2-3 days IT Time Understanding data sources, data structures and definition At least 20-30 days WebXpress data structures are built into Qlikview ZERO days Infrastructure Separate hardware for BI engine Same server as WebXpress server Costs breakup  Consulting- 50%  Licenses- 40%  Hardware- 10%  Consulting- 30%  Licenses- 70%  Hardware- 0% ROI 18-36 months 2-3 months
  • 25.
  • 26.
    Qlikview BI deployment WebXpressSQL Database Oracle Database Other data sources, XLS files Extract, Transform, Load, Schedule Analytics Development Analytics File Repository Qlikview Desktop Edition Qlikview Browser Edition 3G Mobile Network Qlikview Small Business Server VPN/ INTERNET Qlikview iPhone/ Android/ iPad client
  • 27.
    Qlikview Solution Components QlikviewServer • Deployment of Qlikview on Internet • Repository of QVW files to be opened in browser • Connection to Qlikview Enterprise Qlikview Personal Edition • Development tool to create new analytics • Add, edit, delete charts • Add data sources such as XLS • Connect to Qlikview Enterprise repository Qlikview Product • Usage QV Analyzer on Desktop • Run analytics charts by changing parameters • Export charts, data tables • Decision making based on analytics • Connect to Qlikview Enterprise repository QV Analyzer on Browser • Browser based access of Qlikview files • Export charts, data tables • Decision making based on analytics • Connect to Qlikview Enterprise repository
  • 28.
  • 29.
    Traditional method usingERP reports Step 1: Get all customer related reports • Sales register for last 2 years • Bill register • Sales summary- location wise, business type wise, pay basis wise • Outstanding report • Time taken: 2 hours Step 2: Collate information using XLS • Use pivot tables, filters, macros to get to various out put • Convert data into charts using chart wizards • Time taken: 6 hours Step 3: Present the data • Prepare a presentation; build in charts, XLS links • Time taken: 2 hours Thus, total time taken for ONE customer analysis will be 10 hours. Given learning curve effect, it may not take that long for next customer analysis.
  • 30.
    The Next Levelof Analysis Now, will it be possible for the team to answer all of following questions: • Please above analysis for a particular ZONE • Please given analysis for mode=Air and Pay basis=TBB • Please show data only for 2008 • Now show data for 2007 and 2006 but not 2008 • Please show data across the years only for Monsoon- that is Jul, Aug and Sep • Show day wise sales trend for January 2008 • Show data in %, number of transactions and sales in Rs. Lakhs • Show data combined for customer A and customer C
  • 31.
    Analysis using Qlikview Step1: Open Qlikview and open Customer Snapshot Analysis Step 2: Reload latest transaction data Step 3: Answer questions as put up by management, in full graphical view, in a single dashboard Total time: 5 minutes Time available to answer queries: Entire day
  • 32.
    Seeing is believing:Data Across Customers
  • 33.
    Scenario Building • ShowsAnalysis for: – Customer: All names same as similar to- Ingram Micro – Year 2008 – Month- Jan to March – South Zone + North Zone – Pay basis- TBB and To Pay – Mode of service: ALL • Show following output – Shows sales breakup in % – Show Pay basis breakup – Show yield – Show unbilled and billed – Shows daily sales trend – Show top booking and delivery locations
  • 34.
    Data for agiven customer
  • 35.
  • 36.
  • 37.
  • 38.
  • 39.
  • 40.
  • 41.
    Thank You KEEP INTOUCH Headquarters Regional Sales Office 114, Sundervilla, S. V. Road, Santacruz (West), Mumbai – 400052 9122-2660-5375 552, 2nd Floor Gram Sabha Pooth Kalan , New Delhi - 110042 +91-9582600153 business@webxpress.in www.webxpress.in