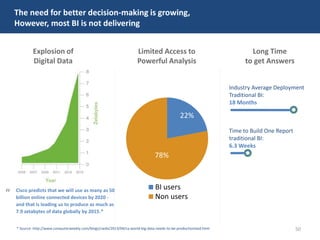
Joe DeSiena, President of Bardess Group Ltd moderated a panel of Information Technology executives titled Analytics and Business Intelligence for the chapter meeting for the New Jersey Society of Information Management.
How to Create and Manage a Successful Analytics OrganizationDATAVERSITY
For the last few years, analytics, data science and data management have achieved tremendous exposure on all the media channels. Big Data has become a major topic of discussion, catalyzing attention among the C-Level executives and driving investments and projects inside the enterprise. However, it is really interesting that just a selected group of business has created successful data teams and has mastered the skills to manage it. What we have seen is that most companies still do not know how to create, implement and manage a data and analytics organization. Above all, if data has become an strategic asset and is being considered the new oil for the 21st century economy, what your strategy to handle it ? This webinar will help to bring some concepts and ideas to enlighten your path to create and manage an analytics organization, providing some real life examples on companies which did it.
Big Data Journeys: Review of roadmaps taken by early adopters to achieve thei...Krishnan Parasuraman
Implementing a Big Data program can be a long and arduous journey. Each organization has its own unique business drivers and technical considerations that drive their big data adoption roadmaps. Whatever be your organization's specific big data driver - be it managing a rapid surge of data, implementing a new set of analytic capabilities, incorporating unstructured data as part of your enterprise data platform or accessing real time information for actionable intelligence - the approach and roadmap that you put in place to reach that end goal becomes all the more critical in a space where early success stories are relatively rare, skill sets are hard to find and technologies are still evolving.
In this session we will chronicle the journeys of four different organizations that were early adopters of big data. Each of them charted a different path to achieve their big data goals. We will look at what were the key drivers behind their respective approaches, what worked and what did not work for them.
Big Data is Here for Financial Services White PaperExperian
Conquering Big Data Challenges
Financial institutions have invested in Big Data for many years, and new advances in technology infrastructure have opened the door for leveraging data in ways that can make an even greater impact on your business.
Learn how Big Data challenges are easier to overcome and how to find opportunities in your existing data and scale for the future.
In this document, the five disruptive trends shaping the corporate IT landscape today are layed out. Out of the five, Big Data has the biggest potential to generate new sustainable competitive advantages. But the benefits will remain out of reach of many organizations as they struggle to adopt the technology, develop new capabilities, and manage the cultural change associated with the use of big data. This document offers a pragmatic approach to generating business value.
Operationalizing the Buzz: Big Data 2013VMware Tanzu
The 2013 EMA/9sight Big Data research makes a clear case for the maturation of Big Data as a critical approach for innovative companies. This year’s survey went beyond simple questions of strategy, adoption and use to explore why and how companies are utilizing Big Data. This year’s findings show an increased level of Big Data sophistication between 2012 and 2013 respondents. An improved understanding of the “domains of data” drives this increased sophistication and maturity. Highly developed use of
Process-mediated, Machine-generated and Human-sourced information is prevalent throughout this year’s study.
My goal today is to inspire you to make a strong business case for applying big data in your enterprise, a key part of which is taking big data beyond analytics.
Thông tin liên hệ về giải pháp:
Công ty Cổ phần Tin học Lạc Việt
Hotline: (+84.8) 38.444.929
Email: info@lacviet.com.vn
Website: http://www.lacviet.vn/
Startup Metrics, a love story. All slides of an 6h Lean Analytics workshop.Andreas Klinger
Everything you need to know about Startup Product Metrics.
This is a slideshare exclusive. The full 8hour workshop deck.
#iCatapult Workshop - 2013-08-12
Links:
http://klinger.io/
http://icatapult.co/
How to Build a Rock-Solid Analytics and Business Intelligence StrategySAP Analytics
http://spr.ly/SBOUC_VP - The key to a successful analytics program is to have the right strategy in place. An effective approach benefits both IT and the core business alike. A solid, well-communicated business intelligence strategy is more than just a good idea. It’s crucial to maximizing ROI, reaching KPIs, and identifying metrics that actually mean something. Take the next step in your journey to a solid BI strategy.
Presenters: Deepa Sankar & Pat Saporito, SAP
A look at the evolution of analytics and its revolutionary potential to transform ordinary businesses, power new business models, enable innovation, and deliver greater value. http://www2.deloitte.com/us/en/pages/deloitte-analytics/articles/analytics-trends.html
Are you getting the most out of your data?SAS Canada
Data is an organizations most valuable asset, but raw data by itself has little value. To drive data’s worth, it must be managed and processed to extract value and information that decision makers can leverage and turn into actionable insights. It is the ways in which a company choses to put that information to use that will determine the true value of its data.
Through business intelligence and business analytic tools, businesses are enabling themselves to make more strategic, accurate decisions, while optimizing business processes. Hear from Info-Tech Research Group and learn what you need to consider when choosing an analytics solution provider. The webinar will highlight Info-Tech Research Group’s recently published vendor landscape for selecting and implementing Business Intelligence and Business Analytics solutions. The report positions SAS as the only leader across all four categories of Enterprise BI, Mid-Market BI, Enterprise BA and Mid-Market BA.
Leading enterprise-scale big data business outcomesGuy Pearce
A talk specially prepared for McMaster University. There is more benefit to thinking about big data as a paradigm rather than as a technology, as it helps shape these projects in the context of resolving some of the enterprise's greatest challenges, including its competitive positioning. This approach integrates the operating model, the business model and the strategy in the solution, which improves the ability of the project to actually deliver its intended value. I support this position with a case study that created audited financial value for a major global bank.
Big Data Trends and Challenges Report - WhitepaperVasu S
In this whitepaper read How companies address common big data trends & challenges to gain greater value from their data.
https://www.qubole.com/resources/report/big-data-trends-and-challenges-report
Big Data : From HindSight to Insight to ForesightSunil Ranka
When it comes to Analytics and Reporting , There is a fine line between HindSight to Insight to Foresight . With the evolution of BigData technology, there is a need in deriving value out of the larger datasets, not available in the past. Even before we can start using the new shiny technologies, there is a need of understanding what is categorized as reporting or business intelligence or Big Data and Analytics. Based on my experience, people struggle to distinguish between reporting, Analytics, and Business Intelligence.
Highlights of IBM Analytics Research ReportPaul Gillin
These highlights come from the IBM report, Analytics: the real-world use of big data
(http://www.slideshare.net/pgillin/big-data-analytics-study-4-13annotated). This document is used in a blog post that shows how to write a summary of a complex research report quickly.
Data-Driven is Passé: Transform Into An Insights-Driven EnterpriseDenodo
Watch the full webinar: http://goo.gl/c5rlCM
Speakers: Holger Kisker, Ph.D., Vice President and Research Director at Forrester Research Inc.
Listen to Holger Kisker, Vice President and Research Director at Forrester Research Inc., describe the three step plan for organizations to become insights-driven rather than data-driven enterprises. Adopting systems of insight and embedding them into your organization’s systems of engagement, record, and automation allows you to turn data into action. As a final step, data virtualization can help keep all systems in synch, being a key enabler for systems of insight.
How An AI-Powered Trade Promotion Optimization Software Can Improve Consumer ...Gina Shaw
Artificial Intelligence (AI) will happen in both TPx and Retail Execution sooner than you probably think – Promotion Optimization Institute
According to Nielsen Holdings, 40% of Consumer Goods trade promotion spending doesn’t drive the desired results. Even though the trade promotions spend take up a lion’s share of the organizational revenue, traditionally manufacturers have always struggled in optimizing their promotion mix for the maximum bang for the buck.
With the advancements in AI technologies, it is now possible to powerfully harness data and run high-yield trade promotions.
What You Can Expect From The eBook?
1. Key Trade Promotion Optimization (TPO) challenges faced today
2. What is AI in the context of TPO?
3. How AI helps run profitable trade promotions?
4. What an AI-Powered analysis looks like?
5. Case-studies
6. How you can get started right away!
How Intelligent Operations Enables Proactive Data Center ManagementITOutcomes
CIOs often live and die by the data center’s performance and availability numbers.
Nine out of 10 respondents to a 2014 survey of data center professionals showed that service availability is highly critical to their performance.
But at the same time, 41 percent of organizations missed their service availability goals for mission-critical systems in 2013. Not surprisingly, organizations with higher service availability goals were significantly less successful in meeting their goal.
But here’s a new way of thinking about improving data center metrics: IT departments should no longer be concerned with improving system performance and reducing downtime for its own sake. Rather, consider these as metrics for enabling IT to deliver more of what the business needs, when it needs it.
In other words, it’s time to transform infrastructure and application measurements from tactical to strategic metrics.
Project 3 – Hollywood and IT· Find 10 incidents of Hollywood p.docxstilliegeorgiana
Project 3 – Hollywood and IT
· Find 10 incidents of Hollywood portraying IT security incorrectly
· You can use movies or TV episodes
· Write 2-5 paragraphs for each incident. Use supporting citations for each part.
· What has Hollywood portrayed wrong? Describe the scene and what is being shown. Make sure to state whether it is partially wrong or totally fictitious.
· How would you protect/secure against what they show (answers might include install firewall, load Antivirus etc.)
· Use APA formatting for your sources on everything.
· Make sure to put your name on assignment.
Big Data and Social Media
Colgate Palmolive
Agenda Of socail media use
Buisness intellegence and Social media concenpts
Intellegent organization
Data Anaylysis and Data trustworthiness
Conclusion
Buisness intellegence and Social media concenpts
No-Hassle Documentation
Gain Trusted Followers
Spy on Competition
Learn Customer Demographics
Research and Analyze Events
Advertise More Accurately
Intellegent organization
They consistently use (big) data proactively
They know exactly where they want to go: all-round vision
They continuously discuss business matters: alignment
They talk to each other regarding positive and negative performance
They know their customers through and through
They think and work in an agile way
Data Anaylysis and Data trustworthiness
Data completeness and accuracy
Data credibility
Data consistency
Data processing and algorithms
Data Validity
Conclusion
How Colgate benefit from Big Data and Social Media
Social media increases sales and customers
Big data shows popular trends and popular companies
All around they are both beneficial
Big Data can find trends that can benefit you greatly
Criteria
Title Page:
Name, Contact info, title of Presentation
Slide 1
Adenda : Topic you going to cover in order
Slide 2
Discuss how big data, social media concepts and knowledge to successfully create business intellegence (Support your bullets points with data, analysis, charts)
Slide 3
Describe how big data can be used to build an intelligent organization
Slide 4
Discuss the importance of data source trustworthiness and data analysis
Slide 5
Conclusion
Slide 6
Big Data And Business Intelligence
Business Value With Big Data
For business to survive in a competitive environment, organizational change requires improved governance, sponsorship, processes, and controls, in addition to new skill sets and technology all work in harmony to deliver the benefits of big data. See Fig. 13.2
Data science has taken the business world by storm. Every field of study and area of business has been affected as companies realize the value of the incredible quantities of data being generated. But to extract value from those data, one needs to be trained in the proper data science skills. The R programming language has become the de fac to programming language for data science. Its flexibility, power, sophistication, and expressiveness have ma ...
Predictive and prescriptive analytics: Transform the finance function with gr...Grant Thornton LLP
As all businesses continue to collect, store and analyze more data than ever before, they face growing data challenges to support decision-making. Those who can leverage predictive and prescriptive analytics will differentiate themselves in the marketplace and gain a competitive advantage. In this report by Financial Executives Research Foundation Inc. and Grant Thornton LLP, we highlight insights from in-depth interviews with senior-level executives. These organizations use advanced analytics in their businesses to gain significant profit improvements. See more at - http://gt-us.co/1vv2KU9
Building an Effective Data Management StrategyHarley Capewell
In June 2013, Experian hosted a Data
Management Summit in London, with over
100 delegates from the public, private and
third sectors. Speakers from Experian
and across the data industry explored the
challenges of developing and implementing
data quality strategies - and how to
overcome them. Read on for more information.
Federated data organizations in public sector face more challenges today than ever before. As discovered via research performed by North Highland Consulting, these are the top issues you are most likely experiencing:
• Knowing what data is available to support programs and other business functions
• Data is more difficult to access
• Without insight into the lineage of data, it is risky to use as the basis for critical decisions
• Analyzing data and extracting insights to influence outcomes is difficult at best
The solution to solving these challenges lies in creating a holistic enterprise data governance program and enforcing the program with a full-featured enterprise data management platform. Kreig Fields, Principle, Public Sector Data and Analytics, from North Highland Consulting and Rob Karel, Vice President, Product Strategy and Product Marketing, MDM from Informatica will walk through a pragmatic, “How To” approach, full of useful information on how you can improve your agency’s data governance initiatives.
Learn how to kick start your data governance intiatives and how an enterprise data management platform can help you:
• Innovate and expose hidden opportunities
• Break down data access barriers and ensure data is trusted
• Provide actionable information at the speed of business
Similar to Bardess Moderated - Analytics and Business Intelligence - Society of Information Management (SIM) (20)
Levelwise PageRank with Loop-Based Dead End Handling Strategy : SHORT REPORT ...Subhajit Sahu
Abstract — Levelwise PageRank is an alternative method of PageRank computation which decomposes the input graph into a directed acyclic block-graph of strongly connected components, and processes them in topological order, one level at a time. This enables calculation for ranks in a distributed fashion without per-iteration communication, unlike the standard method where all vertices are processed in each iteration. It however comes with a precondition of the absence of dead ends in the input graph. Here, the native non-distributed performance of Levelwise PageRank was compared against Monolithic PageRank on a CPU as well as a GPU. To ensure a fair comparison, Monolithic PageRank was also performed on a graph where vertices were split by components. Results indicate that Levelwise PageRank is about as fast as Monolithic PageRank on the CPU, but quite a bit slower on the GPU. Slowdown on the GPU is likely caused by a large submission of small workloads, and expected to be non-issue when the computation is performed on massive graphs.
Show drafts
volume_up
Empowering the Data Analytics Ecosystem: A Laser Focus on Value
The data analytics ecosystem thrives when every component functions at its peak, unlocking the true potential of data. Here's a laser focus on key areas for an empowered ecosystem:
1. Democratize Access, Not Data:
Granular Access Controls: Provide users with self-service tools tailored to their specific needs, preventing data overload and misuse.
Data Catalogs: Implement robust data catalogs for easy discovery and understanding of available data sources.
2. Foster Collaboration with Clear Roles:
Data Mesh Architecture: Break down data silos by creating a distributed data ownership model with clear ownership and responsibilities.
Collaborative Workspaces: Utilize interactive platforms where data scientists, analysts, and domain experts can work seamlessly together.
3. Leverage Advanced Analytics Strategically:
AI-powered Automation: Automate repetitive tasks like data cleaning and feature engineering, freeing up data talent for higher-level analysis.
Right-Tool Selection: Strategically choose the most effective advanced analytics techniques (e.g., AI, ML) based on specific business problems.
4. Prioritize Data Quality with Automation:
Automated Data Validation: Implement automated data quality checks to identify and rectify errors at the source, minimizing downstream issues.
Data Lineage Tracking: Track the flow of data throughout the ecosystem, ensuring transparency and facilitating root cause analysis for errors.
5. Cultivate a Data-Driven Mindset:
Metrics-Driven Performance Management: Align KPIs and performance metrics with data-driven insights to ensure actionable decision making.
Data Storytelling Workshops: Equip stakeholders with the skills to translate complex data findings into compelling narratives that drive action.
Benefits of a Precise Ecosystem:
Sharpened Focus: Precise access and clear roles ensure everyone works with the most relevant data, maximizing efficiency.
Actionable Insights: Strategic analytics and automated quality checks lead to more reliable and actionable data insights.
Continuous Improvement: Data-driven performance management fosters a culture of learning and continuous improvement.
Sustainable Growth: Empowered by data, organizations can make informed decisions to drive sustainable growth and innovation.
By focusing on these precise actions, organizations can create an empowered data analytics ecosystem that delivers real value by driving data-driven decisions and maximizing the return on their data investment.
Adjusting primitives for graph : SHORT REPORT / NOTESSubhajit Sahu
Graph algorithms, like PageRank Compressed Sparse Row (CSR) is an adjacency-list based graph representation that is
Multiply with different modes (map)
1. Performance of sequential execution based vs OpenMP based vector multiply.
2. Comparing various launch configs for CUDA based vector multiply.
Sum with different storage types (reduce)
1. Performance of vector element sum using float vs bfloat16 as the storage type.
Sum with different modes (reduce)
1. Performance of sequential execution based vs OpenMP based vector element sum.
2. Performance of memcpy vs in-place based CUDA based vector element sum.
3. Comparing various launch configs for CUDA based vector element sum (memcpy).
4. Comparing various launch configs for CUDA based vector element sum (in-place).
Sum with in-place strategies of CUDA mode (reduce)
1. Comparing various launch configs for CUDA based vector element sum (in-place).
Techniques to optimize the pagerank algorithm usually fall in two categories. One is to try reducing the work per iteration, and the other is to try reducing the number of iterations. These goals are often at odds with one another. Skipping computation on vertices which have already converged has the potential to save iteration time. Skipping in-identical vertices, with the same in-links, helps reduce duplicate computations and thus could help reduce iteration time. Road networks often have chains which can be short-circuited before pagerank computation to improve performance. Final ranks of chain nodes can be easily calculated. This could reduce both the iteration time, and the number of iterations. If a graph has no dangling nodes, pagerank of each strongly connected component can be computed in topological order. This could help reduce the iteration time, no. of iterations, and also enable multi-iteration concurrency in pagerank computation. The combination of all of the above methods is the STICD algorithm. [sticd] For dynamic graphs, unchanged components whose ranks are unaffected can be skipped altogether.
2. Nandan Shah
Nandan is Director, CDRA Systems at Regeneron Pharmaceuticals. In this
role, Nandan is responsible for providing strategic guidance, oversight and support as
the CDRA (Clinical Development and Regulatory Affairs) organization develops and
implements information systems. Prior to Regeneron, Nandan was at Sanofi-
Aventis where he was IT Head of Solution Centers for Global Regulatory Affairs,
Evidence Value Development (EVD), Global Medical Affairs and Global
Marketing. Prior to that, Nandan has worked at Cambridge Technology Partners in
various roles with increasing levels of responsibility.
Mike Prorock
Mike is Director of Emerging Technologies for Bardess Group. A career Analytics
professional, Mike specializes in enabling enterprises to expand and handle analytics
in high data-growth scenarios. He is an Analytics Strategist and Futurist focused on
Analytics in an ever-changing Digital world.
Kip Olmstead
Kip is the Chief Marketing Officer (CMO) of Private Brands at First Quality Enterprises.
A career marketing officer, he was EVP, CMO at Crayola and a Marketing Director at
Proctor & Gamble for clients such as Duracell and Walmart
The Panel
2
3. Stephen DeAngelis
Steve is President and CEO of Enterra Solutions, a firm specializing in Cognitive
Computing. Steve is a technology and supply chain entrepreneur and patent
holder with more than 25 years of experience in building, financing, and operating
technology and manufacturing companies. Named to Esquire magazine’s “Best
and Brightest” list in 2006, he was recognized by Forbes as one of the “Top
Influencers in Big Data” in 2012. In 2014, he became a contributing member of
Wired magazine’s Innovation Insights blog.
Joe DeSiena
Joe is President of Consulting Services at Bardess Group, Ltd., a Management
Consulting firm specializing in data revitalization, business process design, and
information technology. He has robust corporate management experience in
several industries including data networking, telecommunications, manufacturing,
pharmaceuticals, financial services, utilities, travel and entertainment. Joe has
spent 20 years in professional services assisting Fortune 500 companies to define
and execute their Analytics strategy
The Panel
3
4. • Data
• Nexus of Forces
• Business Intelligence
• Data Discovery
• Big Data
• Predictive Analytics
• Cognitive Computing
• Internet of Things
The Buzz Words
4
5. Data is everywhere
Data has grown more in the last year than all the other years in history combined
Data more than doubles every two years according to IDC
By 2020, information managed by Enterprises will grow 14X (to 35 Zettabytes)
5
6. What is Data?
Facts about things,
organized for analysis or
used to reason or make
decisions
Raw material from which
information is derived and
is the basis for intelligent
actions and decisions
Collections of usable
facts or data
Processed stored or
transmitted data
Data in context with
precise definition and
clear presentation
Specific information about
something—the sum of what has
been discovered or learned
Information known and in the
proper context
Value added to information by
people who have experience and
acumen to understand its
potential
The culmination is applying knowledge by utilizing Information for Value
which is corporate Wisdom. Corporate Wisdom is therefore a function of a
corporation’s capacity to acquire and apply knowledge. This capacity to
acquire and apply knowledge, Corporate Intelligence, is predicated upon the
initial Quality of Data Assets.
Data Information Knowledge
Wisdom
6
7. Data Challenges to Consider
Many organizations are concerned that the amount of amassed
data is becoming so large that it is difficult to find the most
valuable pieces of information.
• What if data volumes get so large and varied
you don't know how to deal with it?
• Do you store?
• Do you analyze all your data?
• How can you find out which data points
are really important?
• How can you use it to your best advantage?
7
8. The Traditional Constraints:
Until recently, the sheer volumes of data overwhelmed processing platforms.
• Organizations have been limited to using subsets of their data, or
• Organizations were constrained to simplistic analyses
The Issue:
What is the point of collecting and storing terabytes of data if it can't be analyzed in
full context, or if it takes hours or days to get results?
But, not all business questions are better answered by bigger data.
Possible Solutions:
1. Incorporate massive data volumes in analysis.
If the answers will be better provided by analyzing all the data:
Apply high-performance analytics to analyze the massive amounts of data using high-performance
technologies such as grid computing, in-database processing and in-memory analytics.
2. Determine upfront which data is relevant.
Traditionally, the trend has been to store everything (data hoarding) and query the data to discover what
is relevant.
Apply advanced analytics on the front end to determine relevance based on context.
Determine which data should be included in analytical processes and what can be placed in low-cost
storage for later use if needed.
Solutions to the Data Challenge
8
9. What is The Nexus of Forces ? (Gartner)
The Nexus of Forces
is the convergence
and mutual
reinforcement of
Social, Mobility,
Cloud, and
Information
Pervasive Access
Big Data
Global Delivery
Circles of Influence
9
11. Set of techniques and tools for the transformation of
raw data into meaningful and useful information for
business analysis purposes.
• An umbrella term that refers to a variety of software applications used to
analyze an organization’s raw data.
• BI as a discipline is made up of several related activities, including data
mining, online analytical processing, querying and reporting.
• A data analysis process aimed at boosting business performance by
helping corporate executives and other end users make more informed
decisions.
What is Business Intelligence (BI)?
Definitions:
11
12. • Gartner noted that BI is Top Priority for CIO’s
• Gartner noted BI platform revenue reached US$14.1 billion in 2013
• Up over 30% since 2011.
BI Software Market Strong and Growing
Growth has been largely
through companies investing in
IT-led consolidation projects to
standardize on IT-centric BI
platforms for large- scale
systems-of-record reporting
These have tended to be highly
governed and centralized,
where IT production reports
were pushed out to inform a
broad array of information
consumers and analysts.
As a result the stack vendors
have dominated the market
12
13. Poor
customer support
Our users need
more flexibility and
self service
Traditional BI
We’ve spent
millions with
little value
Too complicated
and difficult
to manage
BI projects
take too long
to deploy
Our BI vendor
has increased
maintenance fees
User adoption
is too low
Only used for
export to .xls
13
14. A Business intelligence architecture aimed at interactive
reports and explorable data from multiple sources.
– According to Gartner "Data Discovery has become a mainstream
architecture in 2012".
• The ability to give business users the means to draw insights from data
independently
• Knowledge discovery - "the detection of patterns in data. [...] These patterns are
too specific and seemingly arbitrary to specify, and the analyst would be playing
a perpetual guessing-game trying to figure out all the possible patterns in the
database. Instead, special knowledge discovery software tools find the patterns
and tell the analyst what--and where--they are.“
• While data discovery is a nebulous term that can be tough to define, it
essentially means a far less structured approach to data exploration. Unlike
traditional business intelligence, which is geared toward monitoring and
reporting, data discovery is more about discovering hidden patterns and trends
What is Data Discovery?
Definitions:
14
15. Gartner noted the following in its 2014 BI Magic Quadrant:
• There is a five-year trend, where Data Discovery Tools are either
complementing or displacing traditional BI tools
• New requirements and investments have been more skewed toward
business-user-driven data discovery techniques to make analytics beyond
traditional reporting more accessible and pervasive to a broader range of
users and use cases.
• At the end of 2013, Data Discovery tools surpassed $1 billion in annual
software sales, Data Discovery is a Fast Growing Segment of the BI Market
• From now through 2015, Data Discovery tools will outgrow the overall BI
platforms market by a factor of three.
Data Discovery Tools are either complementing or
displacing traditional BI tools
Gartner predicts that most BI vendors will make data discovery
rather than static reporting their primary focus by 2015.
15
16. QlikTech Dominates the Data Discovery Market
Latest 2014 Market Share
• Qlik down to 42%
• Spotfire up to 22%
• Tableau up to 18%
• Others down to 18%16
17. Top Down Purchasing Decision
Led by IT
Bottom up purchasing
Led by Business
BI Market Dynamics: Purchasing Decision Polarize
Cost Optimization
Integrity
Scalability , Manageability, Reliability
Performance
Competition: ORCL, IBM , SAP, SAS,
MSFT
Flexibility
Speed
Visual Exploration
Minimal Modeling
Key Players: QlikView, Tableau, Spotfire
Data
Discovery
Sweet spot
17
18. BusinessValue
Data Discovery: Sustains value
Time
Traditional BI:
Slowest implementation time,
lowest analytic value
Data Visualization:
Biggest ‘Wow factor’ but tends
to wear off quickly
Data Discovery:
Fast time to value, sustained value
over time.
19. BI Market in a period of accelerated transition
BI is Moving from a market with systems used for measurement and
reporting to those that also support analysis prediction, forecasting,
simulation and optimization.
What Next?
Why did it
happen?
PredictiveProblemSolving
What if?
Descriptive
Information
Delivery
What
happened,
where and
when?
19
21. What is Big Data?
An evolving term that describes any
voluminous amount of structured, semi-
structured and unstructured data that has
the potential to be mined for information.
Although big data doesn't refer to any specific quantity, the term is often used when
speaking about petabytes, exabytes or zettabytes of data.
>80% of data is unstructured or semi-structured, forcing new approaches to analysis
of data
A term used to describe the exponential growth and availability of data,
both structured and unstructured.
21
22. • $41.5B by 2018, Total market for Big Data Technology Source: IDC
• $23.76 B in 2016, Global Big Data technology and services revenue will grow
from $14.26 billion in 2014at an annual growth rate of 18.55%
Source: IDC's Worldwide Big Data Technology and Services 2012 - 2016 Forecast.
• $9.83 B in 2020-Big Data technology and services will grow from $1.95 billion
in 2013 at a CAGR of 26%.
Source: Huawei report Big Data & Advanced Analytics in Telecom: A Multi-Billion-Dollar Revenue Opportunity.
Big Data Market is prime for explosive growth
Analysts Predict Strong Growth
• $114B by 2018 Global spending on Big Data
hardware, software, and services will grow
at a compound annual growth rate (CAGR) of
30 percent through 2018
Source: A.T. Kearney Beyond Big: The Analytically Powered Organization.
• $50.1B in 2015, Big Data is projected to be a
$28.5 billion market in 2014 growing 76% in
2015,
Source: Wikkbon report, Big Data Vendor Revenue and Market
Forecast 2013-2017
EMC - $48B by 2017
22
24. Enabling Technologies for Big Data
A number of recent technology advancements enable
organizations to make the most of big data and big data
analytics:
• Cheap, abundant storage.
• Faster processors.
• Affordable open source, distributed big data platforms, such as
Hadoop.
• Parallel processing, clustering, MPP, virtualization, large grid
environments, high connectivity and high throughputs.
• Cloud computing and other flexible resource allocation
arrangements.
24
25. Why Big Data Matters?
The real issue is not about acquiring large amounts
of data, It's about what is done with the data.
The Big Data vision is that organizations
will be able to acquire data from any
source, harness relevant data and analyze
it to find answers that enable:
1. Cost reductions
2. Time reductions
3. New product development and
optimized offerings
4. Smarter business decision making
25
26. By combining Big Data and high-powered analytics, it is possible to:
• Determine root causes of failures, issues and defects in near-real time,
potentially saving billions of dollars annually.
• Optimize routes for many thousands of package delivery vehicles while
they are on the road.
• Analyze millions of SKUs to determine prices that maximize profit and
clear inventory.
• Generate retail coupons at the point of sale based on the customer's
current and past purchases.
• Send tailored recommendations to mobile devices while customers are in
the right area to take advantage of offers.
• Recalculate entire risk portfolios in minutes.
• Quickly identify customers who matter the most.
• Use clickstream analysis and data mining to detect fraudulent behavior.
Big Data Implementation Examples
Combining Big Data with Analytics:
26
27. • What technology advancements enable organizations to
make the most out of Big Data analytics?
• How do publicly available datasets and web services
impact analysis?
• What are some key ways of approaching big data
problems?
27
Technology for Big Data
28. Big Data – Data Scientists
Dominated by Rapidminer & “R”
“R” seeing the fastest growth
Significant year over year decline
in use of Excel to gain real answers
28
29. Big Data – Data Volumes used by Data Scientists
Median size of the largest analyzed dataset is in the 40-50GB range
29
30. John Chambers of Cisco in a 2-10-15 WSJ interview believes that:
• CIOs need to get the right data at the right time to the right device or
right person so they can make the right decision
• The role of the network will change dramatically—and that contrary
to popular beliefs, the majority of the data will be analyzed and acted
upon at the edge of the network—
30
Role of Network in Big Data Analytics
31. 0 10 20 30 40 50 60 70
Funding for Big Data related Initiatives
Defining Our Strategy
Integrating Big Data Technology with Existing Infrastructure
Integrating Multiple data Sources
Obtaining Skills and Capabilities Needed
Risk and Governance Issues
Determing How to get value from Big Data
Percent of Surveyed CIOs Listing these Factors as hurdles or
challenges with Big Data
Percent
The Big Challenges of Big Data – from CIOs
Source: Gartner Survey and Wall St Journal 31
34. • An area of data mining that deals with extracting information from data and
using it to predict trends and behavior patterns.
– Often the unknown event of interest is in the future, but predictive analytics can be applied to any
type of unknown whether it be in the past, present or future
• The branch of data mining concerned with the prediction of future probabilities
and trends.
– The central element of predictive analytics is the predictor, a variable that can be measured for an
individual or other entity to predict future behavior.
• The practice of extracting information from existing data sets in order to
determine patterns and predict future outcomes and trends.
– Predictive analytics does not tell you what will happen in the future.
– It forecasts what might happen in the future with an acceptable level of reliability, and includes
what-if scenarios and risk assessment.
• The use of statistics and modeling to determine future performance based on
current and historical data.
What is Predictive Analytics?
Definitions:
34
35. Predictive analytics describes any approach to data mining with four attributes:
1. An emphasis on prediction (rather than description, classification or clustering)
2. Rapid analysis measured in hours or days (rather than the stereotypical months of
traditional data mining)
3. An emphasis on the business relevance of the resulting insights (no ivory tower
analyses)
4. (increasingly) An emphasis on ease of use, thus making the tools accessible to
business users.
What is Predictive Analytics? (Gartner)
35
36. • $5.2B in 2018--Transparency Research predicts the Predictive Analytics
space would more than triple from $2B in 2012
• $14B by 2018 if you consider Machine-to-Machine Analytics to be part of
Predictive Analytics domain -- Markets and Markets
• $3.4B in 2018 for Advanced and Predictive Analytics (APA) software
market is growing 9.9% CAGR from $2.2B in 2013 —Forbes
• The global predictive analytics market, valued at USD 2.08 billion in 2012,
is expected to see strong growth at 17.8% CAGR during 2013 to 2019.—
Dublin Analytics
Predictive Analytics Market Size
36
38. • The development of computer systems modeled after the human brain.
– Originally referred to as artificial intelligence, researchers began to use the modern term instead in the
1990s, to indicate that the science was designed to teach computers to think like a human mind, rather than
developing an artificial system.
• Cognitive computing integrates the idea of a neural network, a series of
events and experiences which the computer organizes to make decisions.
What is Cognitive Computing?
The simulation of human thought processes in a
computerized model.
– Cognitive computing involves self-learning systems that use
data mining, pattern recognition and natural language
processing to mimic the way the human brain works.
– Rather than being programmed to anticipate every possible
answer or action needed to perform a function or set of
tasks, cognitive computing systems are trained using
artificial intelligence (AI) and machine learning algorithms to
sense, predict, infer and, in some ways, think.
38
40. • A scenario in which objects, animals or people are provided with unique identifiers
and the ability to transfer data over a network without requiring human-to-human or
human-to-computer interaction.
• The interconnection of uniquely identifiable embedded computing devices within the
existing Internet infrastructure.
• A computing concept that describes a future where everyday physical objects will be
connected to the Internet and be able to identify themselves to other devices.
– The term is closely identified with RFID as the method of communication, although it also may include
other sensor technologies, wireless technologies or QR codes.
• Is when the Internet and networks expand to places such as manufacturing floors,
energy grids, healthcare facilities, and transportation.
• The network of physical objects that contain embedded technology to communicate
and sense or interact with their internal states or the external environment.
What is The Internet of Things (IoT) ?
Definitions:
40
41. What is The Internet of Things?
The Internet of Things is a growing network of everyday objects –
from industrial machines to consumer goods – that can share
information and complete tasks while you are busy with other
activities, like work, sleep or exercise.
Soon, cars, homes, major appliances and even city streets will be connected to the Internet –
creating this network of objects that is called the Internet of Things.
Made up of millions of sensors and devices that generate incessant streams of data, the IoT can
be used to improve lives and businesses in many ways.
The Internet of Things consists of three main components:
• The things (or assets) themselves.
• The communication networks connecting them.
• The computing systems that make use of the data flowing to and from our things.
Using this infrastructure, objects or assets can communicate with each other and even
optimize activities between them based on the analysis of data streaming through the
network.
41
42. • $19 Trillion dollars opportunity -2014 John Chambers CES Keynote; Cisco
IBSG predicts there will be 25 billion devices connected to the Internet by
2015 and 50 billion by 2020.
• $300 billion in 2020 --Gartner estimate that IoT product and service
suppliers will generate incremental revenue.
• $7.1 trillion in 2020 -- IDC forecasts that the worldwide market for IoT
solutions will more than triple from $1.9 trillion in 2013.
• $10 to $15 trillion for the “Industrial Internet” over the next 20 years
-- GE estimate
Size of the Internet of Things Market
42
43. Examples Internet of Things
• Sprinkler systems that use forecasts, weather sensors and pay-by-use water rates to
optimize the watering of lawns.
• Public trash cans that compacts trash as needed and alert city workers when they are
full.
• Self-parking cars today become fully autonomous cars that taxi people efficiently
around a city, stopping to share fares when budget-conscious travelers opt in.
• Trucks that haul commerce safely and quickly across the country, avoiding traffic
delays and optimizing part replacement needs.
• Home security systems that take proactive action - cooling down homes and opening
windows, based on user preferences, the existing weather conditions and proximity to
homes (more than allowing remote control of door locks and thermostats)
Sensors offer unprecedented access to granular data
that can be transformed into powerful knowledge.
However, without an integrated business analytics
platform, sensor data will just add to information
overload and escalating noise.
43
44. Ten Internet of Things facts and predictions
1. The total economic value-add from IoT across industries will reach $1.9 trillion worldwide
in 2020, anticipates Gartner.
2. Fifty billion devices will be connected to the Internet by 2020, predicts Cisco.
3. The remote patient monitoring market doubled from 2007 to 2011 and is projected to
double again by 2016.
4. The utility smart grid transformation is expected to almost double the customer
information system market, from $2.5 billion in 2013 to $5.5 billion in 2020, based on a
study from Navigant Research.
5. Wide deployment of IoT technologies in the auto industry could save $100 billion annually
in accident reductions, according to McKinsey.
6. The industrial Internet could add $10-15 trillion to global GDP, essentially doubling the US
economy, says GE.
7. Seventy-five percent of global business leaders are exploring the economic opportunities of
IoT, according to a report from The Economist.
8. Cities will spend $41 trillion in the next 20 years on infrastructure upgrades for IoT,
according to Intel.
9. The number of developers involved in IoT activities will reach 1.7 million globally by the
end of 2014, according to ABI Research estimates.
10. The UK government recently approved 45 million pounds (US$76.26 million) in research
funding for Internet of Things technologies.
44
45. • Big data" and "evidence-based policy" are the dominant ideas of our
moment. A May 2014 White House report put it this way: "Big data
will become an historic driver of progress, helping our nation
perpetuate the civic and economic dynamism that has long been its
hallmark."
• The White House report presents big data as an analytically
powerful set of techniques. It says the social and economic value
created by big data should be balanced against "privacy and other
core values of fairness, equity and autonomy."
45
50. Explosion of
Digital Data
Limited Access to
Powerful Analysis
Long Time
to get Answers
Industry Average Deployment
Traditional BI:
18 Months
Time to Build One Report
traditional BI:
6.3 Weeks
72%
28%
Cisco predicts that we will use as many as 50
billion online connected devices by 2020 -
and that is leading us to produce as much as
7.9 zetabytes of data globally by 2015.*
* Source: http://www.computerweekly.com/blogs/cwdn/2013/04/ca-world-big-data-needs-to-be-productionised.html
“
The need for better decision-making is growing,
However, most BI is not delivering
22%
78%
BI users
Non users
50
51. • Data discovery is often discussed in the same breath as Big Data because it
may encompass the three "Vs" typically used to describe Big Data: volume,
velocity and variety. That is, folks can work with very large data sets and
can get answers quickly. Users can explore data, both structured and
unstructured, that comes from a wide variety of disparate sources.
Data Discovery and Big Data
51