Downloaded 68 times
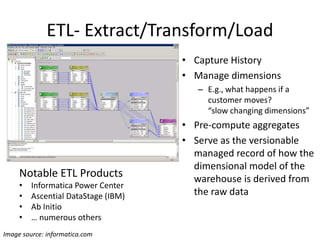
![[1995]
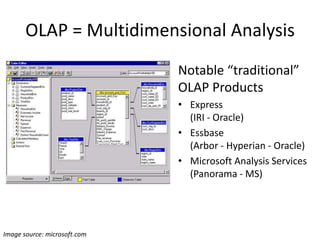
Notable “traditional”
ROLAP Products
• Microstrategy
• Business Objects
(Business Objects - SAP)
• Cognos
(Cognis - IBM)
• OBIEE
(nQuire - Siebel - Oracle)
• Actuate, Birst, Pentaho
etc…
Image source: microstrategy.com](https://image.slidesharecdn.com/bitobigdata-hackreduce-dec2014-141204100816-conversion-gate02/85/From-Business-Intelligence-to-Big-Data-hack-reduce-Dec-2014-11-320.jpg)
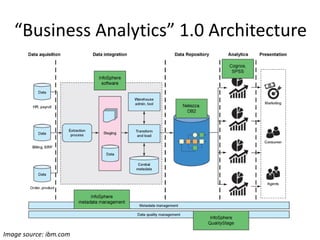
![Best Practices
[First Edition, 1992]
Image source: wiley.com
[Founded, 1995]
[First Edition, 1996]](https://image.slidesharecdn.com/bitobigdata-hackreduce-dec2014-141204100816-conversion-gate02/85/From-Business-Intelligence-to-Big-Data-hack-reduce-Dec-2014-15-320.jpg)
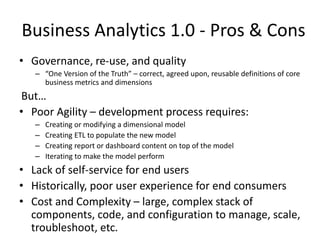
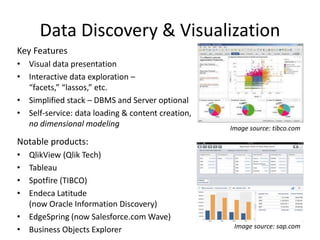

![Our analytics ambitions have only grown!
We want BIG, EASY, DEEP analytics
• [BIG] the headline grabber:
More data from more sources, aka: Big Data
• [EASY] the real issue (IMHO):
Faster time to value, at lower cost of ownership
• [DEEP] increasingly important:
Deeper intelligence from data…
not just data, but actions, predictions, etc…
… Can we solve these problems without creating an
ever larger mess of technology and products?](https://image.slidesharecdn.com/bitobigdata-hackreduce-dec2014-141204100816-conversion-gate02/85/From-Business-Intelligence-to-Big-Data-hack-reduce-Dec-2014-26-320.jpg)
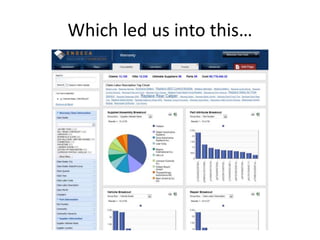
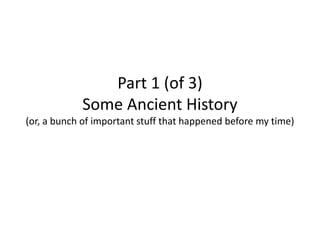
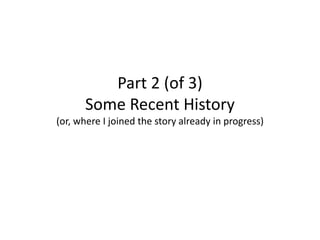
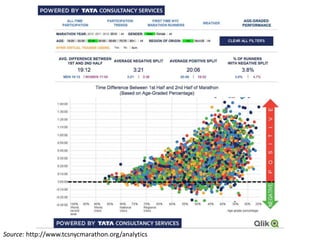
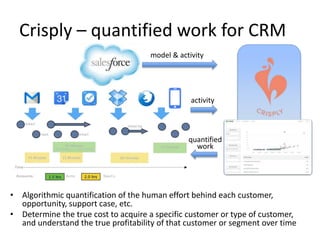
![[BIG]: the Hadoop Solution
Posits that what we need is a better, more flexible and
scalable foundation for the Data Warehouse – more like a
“data operating system” than a DBMS
Image source: cloudera.com](https://image.slidesharecdn.com/bitobigdata-hackreduce-dec2014-141204100816-conversion-gate02/85/From-Business-Intelligence-to-Big-Data-hack-reduce-Dec-2014-27-320.jpg)
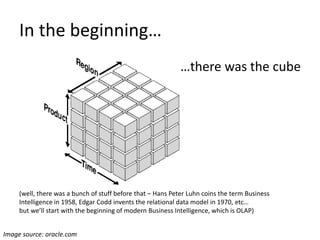
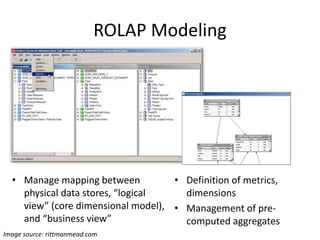
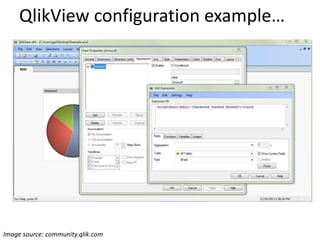
![[BIG] and [EASY] “On-Hadoop” Solutions
Image source: gigaom.com
Platfora Architecture
Posit that although Hadoop
is indeed a powerful
platform, it’s complexity
needs to be wrapped in a BI
/ analytics application
Notable Products
• Platfora
• Datameer
• Oracle Big Data Discovery
(based on Endeca)](https://image.slidesharecdn.com/bitobigdata-hackreduce-dec2014-141204100816-conversion-gate02/85/From-Business-Intelligence-to-Big-Data-hack-reduce-Dec-2014-28-320.jpg)
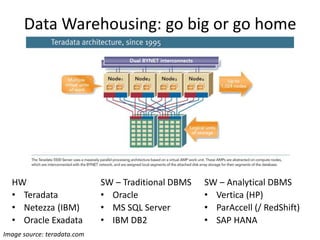
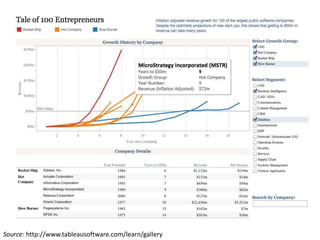
![[BIG+]: The Logical Data Warehouse*
Posits that what is needed is a variety of data stores to constitute the
“Data Warehouse,” along with integration to allow data to be stored
and processed where most appropriate with little or no additional
development effort or operational management overhead
Image source: teradata.com
* From Understanding the Logical Data Warehouse: The Emerging
Practice, 21 June 2012, Mark A. Beyer and Roxane Edjlali](https://image.slidesharecdn.com/bitobigdata-hackreduce-dec2014-141204100816-conversion-gate02/85/From-Business-Intelligence-to-Big-Data-hack-reduce-Dec-2014-29-320.jpg)
![[EASY] The Cloud Solution
• Agility via all of the traditional cloud benefits –
reduced setup, less customization, reduced
ongoing management, etc…
• SaaS-based BI tools, such as
– GoodData
– Domo
• SaaS-based BI applications, such as
– Numerify (IT analytics on ServiceNow, etc.)
– InsightSquared (Sales analytics on Salesforce)](https://image.slidesharecdn.com/bitobigdata-hackreduce-dec2014-141204100816-conversion-gate02/85/From-Business-Intelligence-to-Big-Data-hack-reduce-Dec-2014-30-320.jpg)
![Other notable examples
• [DEEP] and [EASY]: BeyondCore – data discovery
with automatic/algorithmic analysis of attribute
relationships
• [DEEP]: Ayasdi – deeper insight into data based
on novel topological data visualization
• [DEEP] Alteryx – democratizing more complex
analytical workflows
• [EASY 2.0]: Looker – lightweight BI without
sacrificing modeling, yet avoiding the need for a
warehouse
• [BIG] and [EASY]: Tamr, Trifacta - curating and
wrangling data into usable forms](https://image.slidesharecdn.com/bitobigdata-hackreduce-dec2014-141204100816-conversion-gate02/85/From-Business-Intelligence-to-Big-Data-hack-reduce-Dec-2014-31-320.jpg)

The document discusses the evolution of business analytics from traditional business intelligence (BI) to contemporary big data solutions. It highlights key historical milestones in BI, the shift towards data discovery and visualization tools, and the future priorities of analytics focused on scalability and user accessibility. Additionally, it emphasizes the importance of delivering real business value over merely advancing technology.


