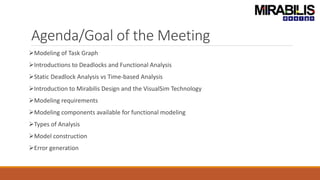
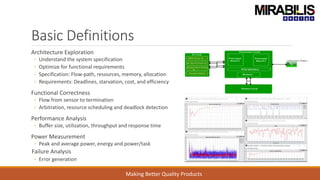
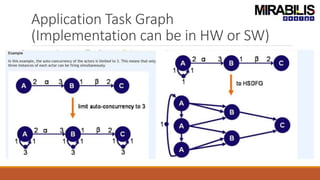
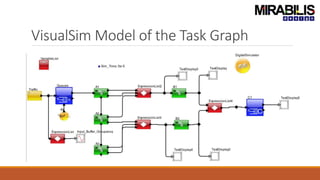
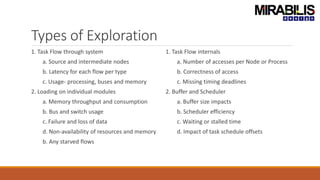
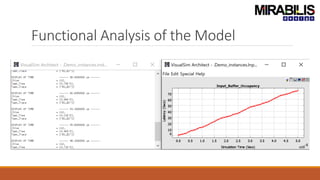
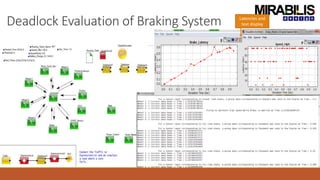
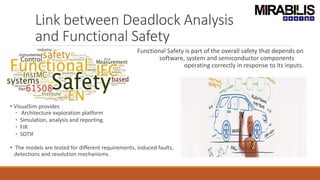
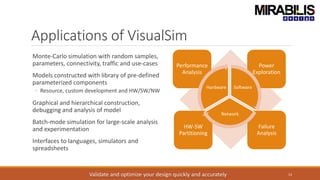
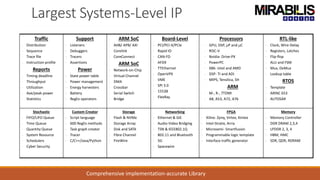
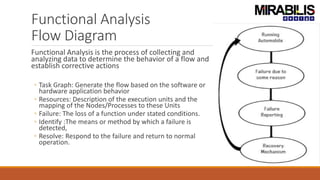
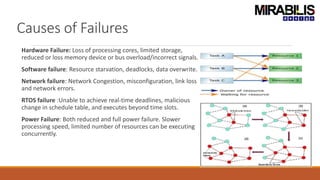
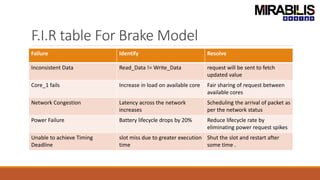
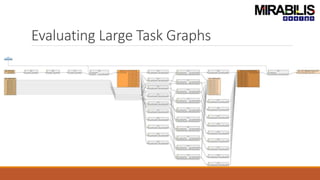
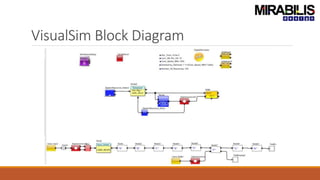
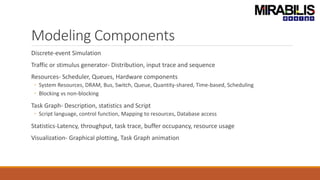
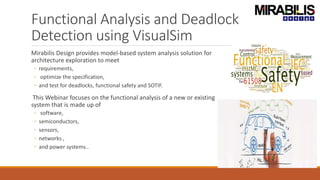
WEBINAR: DETECTING DEADLOCKS IN ELECTRONIC SYSTEMS
USING TIME-BASED SIMULATION
DEADLOCK DETECTION OF TASK GRAPHS, USING DISCRETE-
EVENT SIMULATION
Presenter:
Deepak Shankar
Founder
Mirabilis Design Inc.
Email: dshankar@mirabilisdesign.com
Organizer:
Deepak Shankar
Founder
Mirabilis Design Inc.
Email: dshankar@mirabilisdesign.com
Logistics
2
All attendees are set on mute.
To ask a question, click on Arrow to the left of Chat and
type the question. Folks are standing by to answer your
questions. There will also be a time at the end for Q&A
WEBINAR: DETECTING DEADLOCKS IN ELECTRONIC SYSTEMS
USING TIME-BASED SIMULATION
DEADLOCK DETECTION OF TASK GRAPHS, USING DISCRETE-
EVENT SIMULATION
Presenter:
Deepak Shankar
Founder
Mirabilis Design Inc.
Email: dshankar@mirabilisdesign.com
Organizer:
Deepak Shankar
Founder
Mirabilis Design Inc.
Email: dshankar@mirabilisdesign.com
Agenda/Goal of the Meeting
Modeling of Task Graph
Introductions to Deadlocks and Functional Analysis
Static Deadlock Analysis vs Time-based Analysis
Introduction to Mirabilis Design and the VisualSim Technology
Modeling requirements
Modeling components available for functional modeling
Types of Analysis
Model construction
Error generation
Basic Definitions
Architecture Exploration
◦ Understand the system specification
◦ Optimize for functional requirements
◦ Specification: Flow-path, resources, memory, allocation
◦ Requirements: Deadlines, starvation, cost, and efficiency
Functional Correctness
◦ Flow from sensor to termination
◦ Arbitration, resource scheduling and deadlock detection
Performance Analysis
◦ Buffer size, utilization, throughput and response time
Power Measurement
◦ Peak and average power, energy and power/task
Failure Analysis
◦ Error generation
Making Better Quality Products
Application Task Graph
(Implementation can be in HW or SW)
VisualSim Model of the Task Graph
Types of Exploration
1. Task Flow through system
a. Source and intermediate nodes
b. Latency for each flow per type
c. Usage- processing, buses and memory
2. Loading on individual modules
a. Memory throughput and consumption
b. Bus and switch usage
c. Failure and loss of data
d. Non-availability of resources and memory
b. Any starved flows
1. Task Flow internals
a. Number of accesses per Node or Process
b. Correctness of access
c. Missing timing deadlines
2. Buffer and Scheduler
a. Buffer size impacts
b. Scheduler efficiency
c. Waiting or stalled time
d. Impact of task schedule offsets
Functional Analysis of the Model
Deadlock Evaluation of Braking System Latencies and
text display
Link between Deadlock Analysis
and Functional Safety
Functional Safety is part of the overall safety that depends on
software, system and semiconductor components
operating correctly in response to its inputs.
• VisualSim provides
• Architecture exploration platform
• Simulation, analysis and reporting.
• FIR
• SOTIF
• The models are tested for different requirements, induced faults,
detections and resolution mechanisms.
About Mirabilis Design
Founded in 2003 and based in Sunnyvale, CA, USA
Development and support centers in US, India, China, Korea and Czech Republic
Focused on full system evaluation of electronics, semiconductors and software
40+ customers worldwide in Semiconductors, Aerospace, Computing and Automotive
VisualSim- Modeling and simulation software
Largest source of system modeling IP with embedded timing and power
100’s of man years experience in system design and exploration of digital electronics
Select the “Right” configuration to match customer request
Applications of VisualSim
Monte-Carlo simulation with random samples,
parameters, connectivity, traffic and use-cases
Models constructed with library of pre-defined
parameterized components
◦ Resource, custom development and HW/SW/NW
Graphical and hierarchical construction,
debugging and analysis of model
Batch-mode simulation for large-scale analysis
and experimentation
Interfaces to languages, simulators and
spreadsheets
13
Performance
Analysis
Power
Exploration
HW-SW
Partitioning
Failure
Analysis
Software
Network
Hardware
Validate and optimize your design quickly and accurately
Largest Systems-Level IP
Comprehensive implementation-accurate Library
Traffic
• Distribution
• Sequence
• Trace file
• Instruction profile
Reports
• Timing deadline
• Throughput
• Utilization
• Ave/peak power
• Statistics
Support
• Listeners
• Debuggers
• Tracers
• Assertions
Power
• State power table
• Power management
• Energy harvesters
• Battery
• RegEx operators
ARM SoC
• AHB/ APB/ AXI
• Corelink
• CoreConnect
ARM SoC
• Network-on-Chip
• Virtual Channel
• DMA
• Crossbar
• Serial Switch
• Bridge
Board-Level
• PCI/PCI-X/PCIe
• Rapid IO
• CAN-FD
• AFDX
• TTEthernet
• OpenVPX
• VME
• SPI 3.0
• 1553B
• FlexRay
Processors
• GPU, DSP, mP and mC
• RISC-V
• Nvidia- Drive-PX
• PowerPC
• X86- Intel and AMD
• DSP- TI and ADI
• MIPS, Tensilica, SH
ARM
• M-, R-, 7TDMI
• A8, A53, A72, A76
RTL-like
• Clock, Wire-Delay
• Registers, Latches
• Flip-flop
• ALU and FSM
• Mux, DeMux
• Lookup table
RTOS
• Template
• ARINC 653
• AUTOSAR
Stochastic
• FIFO/LIFO Queue
• Time Queue
• Quantity Queue
• System Resource
• Schedulers
• Cyber Security
Custom Creator
• Script language
• 600 RegEx methods
• Task graph creator
• Tracer
• C/C++/Java/Python
Storage
• Flash & NVMe
• Storage Array
• Disk and SATA
• Fibre Channel
• FireWire
Networking
• Ethernet & GiE
• Audio-Video Bridging
• TSN & IEEE802.1Q
• 802.11 and Bluetooth
• 5G
• Spacewire
FPGA
• Xilinx- Zynq, Virtex, Kintex
• Intel-Stratix, Arria
• Microsemi- Smartfusion
• Programmable logic template
• Interface traffic generator
Memory
• Memory Controller
• DDR DRAM 2,3,4
• LPDDR 2, 3, 4
• HBM, HMC
• SDR, QDR, RDRAM
Functional Analysis
Flow Diagram
Functional Analysis is the process of collecting and
analyzing data to determine the behavior of a flow and
establish corrective actions
◦ Task Graph: Generate the flow based on the software or
hardware application behavior
◦ Resources: Description of the execution units and the
mapping of the Nodes/Processes to these Units
◦ Failure: The loss of a function under stated conditions.
◦ Identify :The means or method by which a failure is
detected,
◦ Resolve: Respond to the failure and return to normal
operation.
Causes of Failures
Hardware Failure: Loss of processing cores, limited storage,
reduced or loss memory device or bus overload/incorrect signals.
Software failure: Resource starvation, deadlocks, data overwrite.
Network failure: Network Congestion, misconfiguration, link loss
and network errors.
RTOS failure :Unable to achieve real-time deadlines, malicious
change in schedule table, and executes beyond time slots.
Power Failure: Both reduced and full power failure. Slower
processing speed, limited number of resources can be executing
concurrently.
F.I.R table For Brake Model
Failure Identify Resolve
Inconsistent Data Read_Data != Write_Data request will be sent to fetch
updated value
Core_1 fails Increase in load on available core Fair sharing of request between
available cores
Network Congestion Latency across the network
increases
Scheduling the arrival of packet as
per the network status
Power Failure Battery lifecycle drops by 20% Reduce lifecycle rate by
eliminating power request spikes
Unable to achieve Timing
Deadline
slot miss due to greater execution
time
Shut the slot and restart after
some time .
Evaluating Large Task Graphs
VisualSim Block Diagram
Modeling Components
Discrete-event Simulation
Traffic or stimulus generator- Distribution, input trace and sequence
Resources- Scheduler, Queues, Hardware components
◦ System Resources, DRAM, Bus, Switch, Queue, Quantity-shared, Time-based, Scheduling
◦ Blocking vs non-blocking
Task Graph- Description, statistics and Script
◦ Script language, control function, Mapping to resources, Database access
Statistics-Latency, throughput, task trace, buffer occupancy, resource usage
Visualization- Graphical plotting, Task Graph animation
Functional Analysis and Deadlock
Detection using VisualSim
Mirabilis Design provides model-based system analysis solution for
architecture exploration to meet
◦ requirements,
◦ optimize the specification,
◦ and test for deadlocks, functional safety and SOTIF.
This Webinar focuses on the functional analysis of a new or existing
system that is made up of
◦ software,
◦ semiconductors,
◦ sensors,
◦ networks ,
◦ and power systems..
Q&A

Webinar: Detecting Deadlocks in Electronic Systems using Time-based Simulation

  • 1.
    WEBINAR: DETECTING DEADLOCKSIN ELECTRONIC SYSTEMS USING TIME-BASED SIMULATION DEADLOCK DETECTION OF TASK GRAPHS, USING DISCRETE- EVENT SIMULATION Presenter: Deepak Shankar Founder Mirabilis Design Inc. Email: dshankar@mirabilisdesign.com Organizer: Deepak Shankar Founder Mirabilis Design Inc. Email: dshankar@mirabilisdesign.com
  • 2.
    Logistics 2 All attendees areset on mute. To ask a question, click on Arrow to the left of Chat and type the question. Folks are standing by to answer your questions. There will also be a time at the end for Q&A
  • 3.
    WEBINAR: DETECTING DEADLOCKSIN ELECTRONIC SYSTEMS USING TIME-BASED SIMULATION DEADLOCK DETECTION OF TASK GRAPHS, USING DISCRETE- EVENT SIMULATION Presenter: Deepak Shankar Founder Mirabilis Design Inc. Email: dshankar@mirabilisdesign.com Organizer: Deepak Shankar Founder Mirabilis Design Inc. Email: dshankar@mirabilisdesign.com
  • 4.
    Agenda/Goal of theMeeting Modeling of Task Graph Introductions to Deadlocks and Functional Analysis Static Deadlock Analysis vs Time-based Analysis Introduction to Mirabilis Design and the VisualSim Technology Modeling requirements Modeling components available for functional modeling Types of Analysis Model construction Error generation
  • 5.
    Basic Definitions Architecture Exploration ◦Understand the system specification ◦ Optimize for functional requirements ◦ Specification: Flow-path, resources, memory, allocation ◦ Requirements: Deadlines, starvation, cost, and efficiency Functional Correctness ◦ Flow from sensor to termination ◦ Arbitration, resource scheduling and deadlock detection Performance Analysis ◦ Buffer size, utilization, throughput and response time Power Measurement ◦ Peak and average power, energy and power/task Failure Analysis ◦ Error generation Making Better Quality Products
  • 6.
  • 7.
    VisualSim Model ofthe Task Graph
  • 8.
    Types of Exploration 1.Task Flow through system a. Source and intermediate nodes b. Latency for each flow per type c. Usage- processing, buses and memory 2. Loading on individual modules a. Memory throughput and consumption b. Bus and switch usage c. Failure and loss of data d. Non-availability of resources and memory b. Any starved flows 1. Task Flow internals a. Number of accesses per Node or Process b. Correctness of access c. Missing timing deadlines 2. Buffer and Scheduler a. Buffer size impacts b. Scheduler efficiency c. Waiting or stalled time d. Impact of task schedule offsets
  • 9.
  • 10.
    Deadlock Evaluation ofBraking System Latencies and text display
  • 11.
    Link between DeadlockAnalysis and Functional Safety Functional Safety is part of the overall safety that depends on software, system and semiconductor components operating correctly in response to its inputs. • VisualSim provides • Architecture exploration platform • Simulation, analysis and reporting. • FIR • SOTIF • The models are tested for different requirements, induced faults, detections and resolution mechanisms.
  • 12.
    About Mirabilis Design Foundedin 2003 and based in Sunnyvale, CA, USA Development and support centers in US, India, China, Korea and Czech Republic Focused on full system evaluation of electronics, semiconductors and software 40+ customers worldwide in Semiconductors, Aerospace, Computing and Automotive VisualSim- Modeling and simulation software Largest source of system modeling IP with embedded timing and power 100’s of man years experience in system design and exploration of digital electronics Select the “Right” configuration to match customer request
  • 13.
    Applications of VisualSim Monte-Carlosimulation with random samples, parameters, connectivity, traffic and use-cases Models constructed with library of pre-defined parameterized components ◦ Resource, custom development and HW/SW/NW Graphical and hierarchical construction, debugging and analysis of model Batch-mode simulation for large-scale analysis and experimentation Interfaces to languages, simulators and spreadsheets 13 Performance Analysis Power Exploration HW-SW Partitioning Failure Analysis Software Network Hardware Validate and optimize your design quickly and accurately
  • 14.
    Largest Systems-Level IP Comprehensiveimplementation-accurate Library Traffic • Distribution • Sequence • Trace file • Instruction profile Reports • Timing deadline • Throughput • Utilization • Ave/peak power • Statistics Support • Listeners • Debuggers • Tracers • Assertions Power • State power table • Power management • Energy harvesters • Battery • RegEx operators ARM SoC • AHB/ APB/ AXI • Corelink • CoreConnect ARM SoC • Network-on-Chip • Virtual Channel • DMA • Crossbar • Serial Switch • Bridge Board-Level • PCI/PCI-X/PCIe • Rapid IO • CAN-FD • AFDX • TTEthernet • OpenVPX • VME • SPI 3.0 • 1553B • FlexRay Processors • GPU, DSP, mP and mC • RISC-V • Nvidia- Drive-PX • PowerPC • X86- Intel and AMD • DSP- TI and ADI • MIPS, Tensilica, SH ARM • M-, R-, 7TDMI • A8, A53, A72, A76 RTL-like • Clock, Wire-Delay • Registers, Latches • Flip-flop • ALU and FSM • Mux, DeMux • Lookup table RTOS • Template • ARINC 653 • AUTOSAR Stochastic • FIFO/LIFO Queue • Time Queue • Quantity Queue • System Resource • Schedulers • Cyber Security Custom Creator • Script language • 600 RegEx methods • Task graph creator • Tracer • C/C++/Java/Python Storage • Flash & NVMe • Storage Array • Disk and SATA • Fibre Channel • FireWire Networking • Ethernet & GiE • Audio-Video Bridging • TSN & IEEE802.1Q • 802.11 and Bluetooth • 5G • Spacewire FPGA • Xilinx- Zynq, Virtex, Kintex • Intel-Stratix, Arria • Microsemi- Smartfusion • Programmable logic template • Interface traffic generator Memory • Memory Controller • DDR DRAM 2,3,4 • LPDDR 2, 3, 4 • HBM, HMC • SDR, QDR, RDRAM
  • 15.
    Functional Analysis Flow Diagram FunctionalAnalysis is the process of collecting and analyzing data to determine the behavior of a flow and establish corrective actions ◦ Task Graph: Generate the flow based on the software or hardware application behavior ◦ Resources: Description of the execution units and the mapping of the Nodes/Processes to these Units ◦ Failure: The loss of a function under stated conditions. ◦ Identify :The means or method by which a failure is detected, ◦ Resolve: Respond to the failure and return to normal operation.
  • 16.
    Causes of Failures HardwareFailure: Loss of processing cores, limited storage, reduced or loss memory device or bus overload/incorrect signals. Software failure: Resource starvation, deadlocks, data overwrite. Network failure: Network Congestion, misconfiguration, link loss and network errors. RTOS failure :Unable to achieve real-time deadlines, malicious change in schedule table, and executes beyond time slots. Power Failure: Both reduced and full power failure. Slower processing speed, limited number of resources can be executing concurrently.
  • 17.
    F.I.R table ForBrake Model Failure Identify Resolve Inconsistent Data Read_Data != Write_Data request will be sent to fetch updated value Core_1 fails Increase in load on available core Fair sharing of request between available cores Network Congestion Latency across the network increases Scheduling the arrival of packet as per the network status Power Failure Battery lifecycle drops by 20% Reduce lifecycle rate by eliminating power request spikes Unable to achieve Timing Deadline slot miss due to greater execution time Shut the slot and restart after some time .
  • 18.
  • 19.
  • 20.
    Modeling Components Discrete-event Simulation Trafficor stimulus generator- Distribution, input trace and sequence Resources- Scheduler, Queues, Hardware components ◦ System Resources, DRAM, Bus, Switch, Queue, Quantity-shared, Time-based, Scheduling ◦ Blocking vs non-blocking Task Graph- Description, statistics and Script ◦ Script language, control function, Mapping to resources, Database access Statistics-Latency, throughput, task trace, buffer occupancy, resource usage Visualization- Graphical plotting, Task Graph animation
  • 21.
    Functional Analysis andDeadlock Detection using VisualSim Mirabilis Design provides model-based system analysis solution for architecture exploration to meet ◦ requirements, ◦ optimize the specification, ◦ and test for deadlocks, functional safety and SOTIF. This Webinar focuses on the functional analysis of a new or existing system that is made up of ◦ software, ◦ semiconductors, ◦ sensors, ◦ networks , ◦ and power systems..
  • 22.