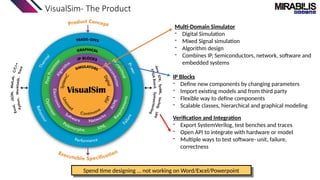
Enabling Better Products
Mirabilis Design
EDA Software Company based in Silicon Valley
Integrating sub-system teams to the mission using System-Level Design
Highly experience Management and Engineering team
Over 150 man-years of background in semiconductors, automotive and
aerospace
VisualSim Architect –Design the Right product
Graphical modeling and simulation platform with complete set of system-level modeling IP
Eliminate all surprises prior to integration
Optimizing specification, collaboration between mission, sub-
systems and suppliers, evaluating use-cases and identify test
scenarios for system validation
Networking
18th
companies
& 32nd
universities
Electronics Modeling
35th
customer
2008
Company Incorporated
2011
First Engagement with
HP and ISRO
2013
Announced
VisualSim
2014
University Program
10th
Customer
2015
Stochastic and
Network modeling
2016 2018 2019
Automotive
& Avionics
2020
System-level IP
Open API
2022/23
Re-engineered
AI, DNN, Power, GPU
2021
Requirements Tracking
60th
customer
Best Embedded
Paper at DAC
2024 – Second
time in 3 years
Why VisualSim for Aerospace
Power-Performance-
Functionality-Failure Trade-off
Analog, Digital,
Semiconductors, ECU,
Network, Power, 5G and Data
Center
OEM
Tier 1
Semi
OEM
Tier 1
Semi
Executable
Model
Encrypted
Model
Full vehicle system design
and exploration Communication between OEM, Tier
One and Semiconductor Vendors
Shifting Gears- Combining Shift-Left and Shift-Right
• Eliminate defects, reuse and
speed-up Time-to-Market
• Models the Device, system,
software and network
• Ensure reliability, efficiency and
on-field debugging
• Reuse system model with
operating conditions and data
System-level modeling for continuous trade-off, verification and debugging from Requirements to End-of-Life
Research and Engineering
Design
Asset Upgrade and Maintenance
Sustainment
Requirements
Testing
Architecture
Trade-offs
Continuous
Validation
Replaceability
Documentation
Upgrade
Feasibility
(SW/HW)
Failure
Analysis
VisualSim- The Product
Spend time designing … not working on Word/Excel/Powerpoint
Multi-Domain Simulator
- Digital Simulation
- Mixed Signal simulation
- Algorithm design
- Combines IP, Semiconductors, network, software and
embedded systems
IP Blocks
- Define new components by changing parameters
- Import existing models and from third party
- Flexible way to define components
- Scalable classes, hierarchical and graphical modeling
Verification and Integration
- Export SystemVerilog, test benches and traces
- Open API to integrate with hardware or model
- Multiple ways to test software- unit, failure,
correctness
VisualSim IP Library
Custom Creator
Communication
Power
RF, Baseband, Channels
Communication systems,
A/D transceivers, Antenna,
Analog, Signal/audio/Image
Processing
Power States, Allocation,
Transition, Loss, Battery,
Consumption, Management,
Generation, Distribution,
and Thermal
Sensors, Interfaces,
Distribution, Traces,
Software, VCD, ML, DNN
Traffic
Reports
Latency, Throughput,
Utilization, Ave/peak
power (instant, ave) ,
hit-ratio, Heat, Temp
RISC-V and Chiplets
RTOS and
Software
SiFive, In-Order/Out-of-
Order Generator,
Tilelink
Generic RTOS, ARINC
653, AUTOSAR, task
Graph
AMBA (AHB/ APB/ AXI/CHI),Tilelink
Corelink (600, 700), NoC (Generic,
Arteris, Signature, OpenEdges),
Virtual Channel, DMA, Crossbar,
Serial Switch, Bridge, UCie
SOC
Board-
Level
VME, PCI/PCI-X/PCIe 6.0, SPI 3.0,
1553B, FlexRay, CAN-FD/XL,
AFDX, TTEthernet, OpenVPX
Processors ARM (M0-55), R5, Cortex (A8,
A72, A53, A76, A77, A65, A78,
A720), Nvidia- Pascal to Ampere,
Generic GPU, mC, Leon, Power,
X86, DSP- TI and ADI, Tensilica,
Renesas SH, AI Engine, TPU
Stochastic
Queue ,Time
Queue, Quantity
Queue, Resources,
Scheduler
Scripting, RegEx, Task
graph, Use cases,
Hardware Builder,
C/C++/Java/Python
MatLab, STK
Storage Flash, NVMe, Disk, SSD,
NAS, Fibre Channel,
FireWire
TSN, AVB, 10BaseT1S, Switched Ethernet,
Resilient Packet Ring, RP3, WiFi 802.11,
Bluetooth, PAN, Spacewire, SpaceFibre,
IEEE802.1Q, Time-Triggered Ethernet,
AFDX, 5G
Networking
Memory
• Memory Controller, SDR, DDR
DRAM 2,3,4, 5, LPDDR 2, 3, 4,5
HBM2.0, HMC, QDR, RDRAM,
MPMC, cache, Coherent cache
FPGA Xilinx- Versal, Zynq,
Ultrascale, Kintex
Altera-Stratix, Arria,
Microsemi- Smartfusion,
Programmable logic
generator
Trade-Off
Requirements,
Thermal, Power,
Performance, Failure
Verification, Upgrade
VisualSim drives Efficiency & Productivity
Model Creation (6)
Implementation (18)
Using Current Design Methodology
Project Schedule
)
Implementation (12)
Using VisualSim Design Methodology
Time savings
based on 24
month project
is 20-40%
Note: All times in months
TM
Communication and Refinement (4)
Analysis (2.5)
Model Creation (0.5)
Analysis (1.5)
Communication and Refinement (6)
Advantageous over generic modeling environment due to Shorter duration & greater applicability
Power
Generation
Power
Storage
Power
Consumption
Thermal
Management
• Different charging schemes
• Impact of surge and shocks
• Battery Lifecycle
• Battery Consumption
• Statistics
• Heat and
temperature
• Impact of
cooling strategy
• Add impact of
power spikes
• State based power consumption
of electronics (controller, SOC)
and Mechanical (brakes, wheels)
• Average, instant and Cumulative
• Power per device and application
Verification and Debugging
• 4 Types of Power
Generators in VisualSim
• Constant, variable, motor,
solar charge
• Charge sent to battery
1 2 3 5
6
• Optimize and test the power management algorithms
• Sizing of power generators and battery
• Optimize the schedule, supplynet and voltage
• Estimate power consumed by the software application
Downstream Integration
• Generate UPF file with power domains and
associated voltage levels
• Generate SystemVerilog power testbench
• Generate powerState change VCD dump
7
Power
Management
• Change in power
state controlled by
time, utilization,
temperature and
expected activity
4
Add the Power and Thermal
Failure Analysis
Hardware Failure
Loss of processing cores, limited storage, reduced or loss
memory device or bus overload/incorrect signals
Software failure
Resource starvation, deadlocks, data overwrite
Network failure
Network Congestion, misconfiguration, link loss and network
errors
RTOS failure
Unable to achieve real-time deadlines, malicious change in
schedule table, and executes beyond time slots
Power Failure
Both reduced and full power failure. Slower processing speed,
limited number of resources can be executing concurrently
MIRABILIS DESIGN INC. 9
System Verification
• Validate product not just HW/SW
• Application relevant test vectors
• Generate test cases and run against RTL
• Compare simulation output against RTL
• Match architecture timing within range
• Verify functional correctness
• Task sequencing @ DSP/uP
• Resource contention
Eliminate product failure by maximizing relevant
verification
Golden
Reference
Comparator
Match Tag
Architecture
model of IP
Verilog/C/
Hardware
What is Architecture Exploration?
Scheduling/Arbitration
proportional
share
WFQ
static
dynamic
fixed priority
EDF
TDMA
FCFS
Communication Templates
Architecture # 1 Architecture # 2
Computation Templates
DSP
AI
GPU
DRAM
CPU
FPGA
m
E
DSP
TDMA
Priority
EDF
WFQ
RISC
DSP
LookUp
Cipher
AI DS
P
CPU
GPU
mE DD
R
static
Which architecture is better suited
for our application?
Using Task Graph to Evaluate System Architecture
I/O
DSP
CPU1
CPU2
task1 task2 task3 task4
Contention
- limited resources
- scheduling/arbitration
Interference of multiple
applications
- limited resources
- scheduling/arbitration
- anomalies
Complex behavior
- input stream
- data dependent behavior
Analyze the Results
System with faster Bus is slower in places
Unpredictable System Response
28/08/2024 14
Example: Avionics System Model
System settings and
traffic profiles –
normal and
Emergency sequences
are defined using
databases
• Provide power supply
to all subsystems
• Fault is injected to
evaluate system
performance under
limited power supply
• Provides a set of
shared resources for
processing various
sensor signals and
make decisions
• Supports Dual and
Triple redundancy
• Fault is injected to
evaluate the
application
performance under
core failure
Source: VisualSim Architect
Requirement Database:
• Latency
• Temperature
• Power
• Utilization
Base model- Results
This is a dual
redundancy
model without
lockstep
mode. So only
when the
core_0 fails,
core_1 takes
over. Hence
Core_1
utilization is
0.0
28/08/2024 16
Key Findings
No: Use case
scenario
Max Application
latency
IMA Core
utilization
Bus utilization
(AFDX)
Remarks
1 Base model –
settings directly
mapped from
existing system
architecture
11.3 msec 53.6% 99.98% Very high application latency was recorded which kept on
increasing over time. AFDX bus has a very high utilization
hinting the bottleneck. AFDX bus supports 10/100/1000 Mbps
configuration. The base model was defined with 100 Mbps
which clearly doesn’t satisfy the performance requirements.
2 AFDX bandwidth
increased to 1000
Mbps
35.2 usec 66.3% 18.29% Bottleneck was correctly identified and thus acceptable
application latency was obtained.
3 Reduced the
number of IMA
Cores by 2x
3.52 msec 99.99% 16.63% The number of IMA cores are not adequate enough to meet
the processing requirements.
4 Fault injected at
IMA Cores
resulting in its
failure
70.0 usec 67.9% 18.29% Spikes in the application latency were observed. However,
even under core failure, the redundant core was able to kick in
and complete the task while meeting performance
requirements.
VisualSim System Model using UCIe in ADAS SoC
Vary Compute, Interconnect and Traffic
Package_Type = Advanced
Max_Link_Speed_GTps = 32
Number of Modules = 4
Tx_Buffer_Size = 8192 ( No packets dropped)
Protocol = PCIe_Gen6
Flit_Size = 256 Bytes
Num_of_Flits_per_Flow_Control_Check =8
Run Simulation with Different Configurations and Topology
Behavior Task Graph
Power Table
Power management Unit
SystemVerilog Output for Power System Test
VCD Waveform for Verification
create_power_domain PD_Top -include_scope
create_power_domain -name PD_1_2.0 -elements {"CLKMUX"}
create_power_domain -name PD_1_1.0 -elements {"PLL","G2","G3"}
create_power_domain -name PD_1_3.0 -elements {"PROC"}
create_supply_port -port VDD_1.0 -direction in -domain PD_Top
create_supply_port -port VDD_2.0 -direction in -domain PD_Top
create_supply_port -port VDD_3.0 -direction in -domain PD_Top
create_supply_port -port VSS_0.0 -direction in -domain PD_Top
create_supply_net VDD_1.0 -domain PD_Top
create_supply_net VDD_2.0 -domain PD_Top
create_supply_net VDD_3.0 -domain PD_Top
create_supply_net VSS_0.0 -domain PD_Top
connect_supply_net VDD_1.0 -ports VDD_1.0
connect_supply_net VDD_2.0 -ports VDD_2.0
connect_supply_net VDD_3.0 -ports VDD_3.0
connect_supply_net VSS_0.0 -ports VSS_0.0
add_power_state PD_1_2.0 -state Active 
{-supply_expr (VDD_2.0 == {ON, 2.0}) && (VSS_0.0 =={ON,0.0})}
add_power_state PD_1_2.0 -state 
OFF {-supply_expr (VDD_2.0 == {OFF, 0.0}) && (VSS_0.0 =={ON,0.0})}
add_power_state PD_1_1.0 -state Active 
{-supply_expr (VDD_1.0 == {ON, 1.0}) && (VSS_0.0 =={ON,0.0})}
add_power_state PD_1_1.0 -state OFF 
{-supply_expr (VDD_1.0 == {OFF, 0.0}) && (VSS_0.0 =={ON,0.0})}
add_power_state PD_1_3.0 -state Active 
{-supply_expr (VDD_3.0 == {ON, 3.0}) && (VSS_0.0 =={ON,0.0})}
add_power_state PD_1_3.0 -state OFF 
{-supply_expr (VDD_3.0 == {OFF, 0.0}) && (VSS_0.0 =={ON,0.0})}
Power Modeling Integration
Cybersecurity for Electronics
Tradition view
• Cybersecurity is related to networks
• Cyber crime is protected with passports and firewalls
Hardware View
• Buffer overflow, core slowdown and memory area loss
• Value change and schedule modified
• Failures such as core loss, lower power or voltage and
Read before write in coherent cache
• Power spikes, battery lifecycle and thermal shocks
Solution
• Create system model with power, performance and
functionality
• Generate different types of workloads and failures
• Power, network, hardware, software, RTOS
• Create Requirements and monitor failures detected
• Random modification in multiple paths and devices
Debugging
• Monitor metrics for power, performance and values
• List of statistics that identify failures
Domain Domain- Specific Safety Levels
Automotive (ISO 26262) QM ASIL-A ASIL-B/C ASIL - D
General (IEC - 61508) SIL -1 SIL - 2 SIL - 3 SIL - 4
Aviation (DO-178 / DO-254) DAL-E DAL-D DAL-C DAL-B DAL-A
Generating Failures to Observe Behavior and Response
Hardware
 Single Point Faults, Latent Faults, Dual Point Faults
 One of the processor core dies. Tasks get remapped to active cores
 Reduced buffer size due to memory loss
 Data error due to Electro magnetic Interference
 Sudden occurrence of alarms which leads to more core activity
Software
 Deadlock and Livelock
 Resource starvation
RTOS
 App execution within a slot going over to the next slot and not meeting the slot schedule
Power
 Thermal shocks and lifecycle loss
 Processor core shutdown due to not enough power
Network
 Fault Injector
 Brute Force attack
List of faults covered
• Single Point Fault (SPF)
• A fault that leads directly to the violation of a safety goal
• Latent Fault (LF)
• A fault that does not violate the functional safety goal by itself,
but leads to in combination with at least one additional
independent fault to a dual- or multiple-point failure, which
then leads directly to the violation of a functional safety goal
• Dual Point Fault (DPF)
• An individual fault that, in combination with another
independent fault, leads to a dual-point failure, which leads
directly to the violation of a goal
Reference Data:
Mapping Applications onto FPGA
Mapping Algorithm to Multi-Resources
Standard HW
Library
Component
Basic/Starting Configuration
Grayscale_Conversion - PS [A72 Core 1]
IIR – Logic (PL)
FFT – AI Engine Tile
Edge_Image - Logic (PL)
iFFT – AI Engine Tile
Edge_Image_Enhancement – Logic (PL)
Segmentation – PS [A72 Core 2]
Image
Processing
Algorithm
Experiments with Different Implementations
Run 3 – Using Direct Path
between Logic and AI
Run 2 – Segmentation
Mapped to AI Engine
Run 1 – Base Configuration
Mapped to Logic and ARM
Application latency increasing over time.
Latency increases due to Segmentation.
Remap segmentation task AI Tiles
Latency is deterministic
Latency requirement (App latency <
80 msec) is met.
Utilization across NoC is acceptable
Application latency in bounded range.
NoC Utilization is high.
Changed interconnect for Segmentation
from NoC to Direct
Comparing different
Processor Cores
ARM, RISC-V
Generated Statistics
Per Execution
unit stats, stall
percentages,
buffer
occupancies
are reported
• Detailed Cache, Bus
and Memory stats
are generated per
simulation.
• Stats Include – hit
ratio, throughput,
latency, number of
write backs, evictions
etc.
ARM Cortex M4
ARM Cortex M55
Use cases
Run Num Description M4 (Latency) M55 (Latency) U74 (Latency)
1 Running Dhrystone on
core. No
cache/bus/memory access
5.576700039E-4 9.47200014E-5 1.77875568E-5
2 Cache/Bus/Memory
access
8.7438000752E-4 1.6319750281E-4 5.05307708E-5
* Number of loops are different for each core
Reference Data
Example: Cockpit and Image-based Designs
Architecting Hardware-Software for Infotainment System
Mirabilis Design Confidential
DRAM
Display
IO
A
M
B
A
A
X
I
B
u
s
CPU
GPU
Display
Ctrl
P
C
I
e
Video Camera SRAM
Packet
• System Overview
• Camera : 30fps, VGA corresponds
• CPU : Multi-core ARM Cortex-A53 1.2GHz
• GPU : 64Cores(8Warps×8PEs), 32Threads, 1GHz
• DisplayCtrl : DisplayBuffer 293,888Byte
• SRAM : SDR, 64MB, 1.0GHz
• DRAM : DDR3, 64MB, 2.4GHz
Explore at the board- and semiconductor-level to size uP/GPU, memory bandwidth and bus/switch configuration
System Model of an Infotainment System
Mirabilis Design Confidential
NXP i.MX6 /
nVIDIA Drive PX
Xilinx FPGA
Kintex 8
Discrete
DMA
ARM A53
GPU
Display Ctrl
SRAM3
DRAM3
Video IN
Parameters
Video OUT
Conducting Architecture Trade-off
• By changing the amount of video input data (packet number), observe the SRAM -> DRAM transfer
performance and examine the upper limit performance of the video input that the system can tolerate.
210Packet/Sec
12ms
21Packet/Sec
41.4us
300Packet/Sec
• 250 Packet/Sec is the system limit
• With 300 Packet/Sec, simulation cannot be
executed due to FIFO buffer overflow.
VisualSim Chiplet
Solution
Using the Chiplet Library to Design SoC
ADAS SoC Block Diagram
UCIe
AI Engine Tiles
Warp
Scheduler
PE
PE
PE
PE
Local Mem
GPU
Memory chiplet
ADC
DDR5
Processor subsystem
Core L1
B
u
s
SLC
• Optimal
mesh size
(mxn) ?
• Best sample
size (16
bytes vs 32
bytes etc) ?
Use a single protocol
stack or multi protocol
stack?
Do we need PCIe
gen6 or still use
gen5 for meeting
application
requirements?
VisualSim System Model using UCIe in ADAS SoC
Statistics for Multi-Die SoC
• Note the AI Engine
latency spikes
• For multi protocol,
half bandwidth for
each protocol.
• Older gen protocols
are mixed with PCIe 6,
• Lower FLIT size
increases latency.
Comparing Different Configurations using UCIe Interface
All Die Adapters using PCIe 6.0
Die Adapters using PCIe 6.0
and Streaming Protocols (AXI)
Lower latency when using PCIe 6.0
Reference Data
Example: Deep Neural Network
Mask Region-CNN (MR-CNN) for object detection and image segmentation
Overall representation of Mask
R-CNN model
Network Architecture of Mask R-CNN
output
CPU Preprocessing
CPU Postprocessing
Using ChatGPT to translate AI model (Mask R-CNN) in to VisualSim Task Graph
• Each of the layers are defined as different
tasks in the task graph and the dependency
between them is modeled.
• A database is used to list the
layers/functions and the parameters
associated with them.
• These will be used to determine the
number of Multiply Accumulate (MAC)
operations corresponding to each
layer/function
Class, box
mask
VisualSim Model of DNN Hardware and Task Graph
Application sequence from
Task Graph is mapped to
HW architecture
• PE – 12x14
• 4 memory hierarchy
• Power computation
per PE, Buses and
memory
Results – Base model (168 AI Cores, 90% data availability at SRAM)
• Peak Power
consumption at
around 10.8 Watts
• Obtained FPS = 0.414
Results – 8x8 (64) cores, 90% data availability at SRAM
• Peak Power consumption at
around 5.6 Watts as the number
of cores were reduced
• Obtained FPS = 0.29, which is
lower than the base model
results as the number of
resources for doing MAC
operations were lower
Results- 100% data availability at SRAM, 168 cores
• The number of off chip memory
accesses were reduced. The only
accesses made were to load the
images and weights into the
SRAM
• Obtained FPS = 9.93, which is
higher than the base model
results as the number of off chip
memory accesses were reduced
• Peak Power consumption (10.4
W) is lower as off chip memory
accesses were reduced
Results- 60% data availability at SRAM, 168 cores
• The number of off chip memory
accesses were increased
• Obtained FPS = 0.04, which is
lower than the base model
results as the number of off chip
memory accesses were
increased
Reference Data:
Hardware-Software Partitioning SoC Architecture Design
SoC System Specification
Processor Core – RISC-V or ARM A53 core
Processor Speed – 1200 MHz
L1 cache:
I Cache : 32 KB
: 2 way set
associative
D Cache : 32 KB
: 4 way set associative
L2 Cache
Size :1 MB
Associativity :16 way
Ext DRAM
Size :4 GB
Type :DDR4
Speed :2400 MHz
HW Accelerator
Speed : 100 MHz
Software
Multimedia task
Stochastic instruction trace
Goals
Peak Power < 1.0W
Number of Matrices > 19K
VisualSim SoC Model
MPEG Application
IP or RISC-V level
• Evaluate pipeline stages
• Width, Speed
• Number of execution units, Levels of cache
SoC
• Number of RISC-V cores
• Accelerators
• Cache memory hierarchy and coherence
System level
• Development of an IoT device, ECU or an
integrated platform
Behavior
Hardware
Bus Topology
CASE 1: All SW tasks
Observations:
1. Avg power
consumption within
requirements (<1.0 W)
2. Performance
requirement not
achieved (Only a max of
9.4K frames)
Sequence diagram
Rotate Frame
task is found to
be resource
intensive
CASE 2: Run Rotate Frame Task on HW Accelerator
Observations:
1. Avg power consumption
requirement not met (>
1.3 W)
2. Performance
requirement achieved
( max of 19.9K frames)
CASE 3: Run Rotate Frame task on
HW Accelerator + Power management
Observations:
1. Avg power consumption
requirement met (<1.0
W)
2. Performance
requirement achieved
( max of 19.8K frames)
Enabling Better Products

Mirabilis_Presentation_SCC_July_2024.pptx

  • 1.
  • 2.
    Mirabilis Design EDA SoftwareCompany based in Silicon Valley Integrating sub-system teams to the mission using System-Level Design Highly experience Management and Engineering team Over 150 man-years of background in semiconductors, automotive and aerospace VisualSim Architect –Design the Right product Graphical modeling and simulation platform with complete set of system-level modeling IP Eliminate all surprises prior to integration Optimizing specification, collaboration between mission, sub- systems and suppliers, evaluating use-cases and identify test scenarios for system validation Networking 18th companies & 32nd universities Electronics Modeling 35th customer 2008 Company Incorporated 2011 First Engagement with HP and ISRO 2013 Announced VisualSim 2014 University Program 10th Customer 2015 Stochastic and Network modeling 2016 2018 2019 Automotive & Avionics 2020 System-level IP Open API 2022/23 Re-engineered AI, DNN, Power, GPU 2021 Requirements Tracking 60th customer Best Embedded Paper at DAC 2024 – Second time in 3 years
  • 3.
    Why VisualSim forAerospace Power-Performance- Functionality-Failure Trade-off Analog, Digital, Semiconductors, ECU, Network, Power, 5G and Data Center OEM Tier 1 Semi OEM Tier 1 Semi Executable Model Encrypted Model Full vehicle system design and exploration Communication between OEM, Tier One and Semiconductor Vendors
  • 4.
    Shifting Gears- CombiningShift-Left and Shift-Right • Eliminate defects, reuse and speed-up Time-to-Market • Models the Device, system, software and network • Ensure reliability, efficiency and on-field debugging • Reuse system model with operating conditions and data System-level modeling for continuous trade-off, verification and debugging from Requirements to End-of-Life Research and Engineering Design Asset Upgrade and Maintenance Sustainment Requirements Testing Architecture Trade-offs Continuous Validation Replaceability Documentation Upgrade Feasibility (SW/HW) Failure Analysis
  • 5.
    VisualSim- The Product Spendtime designing … not working on Word/Excel/Powerpoint Multi-Domain Simulator - Digital Simulation - Mixed Signal simulation - Algorithm design - Combines IP, Semiconductors, network, software and embedded systems IP Blocks - Define new components by changing parameters - Import existing models and from third party - Flexible way to define components - Scalable classes, hierarchical and graphical modeling Verification and Integration - Export SystemVerilog, test benches and traces - Open API to integrate with hardware or model - Multiple ways to test software- unit, failure, correctness
  • 6.
    VisualSim IP Library CustomCreator Communication Power RF, Baseband, Channels Communication systems, A/D transceivers, Antenna, Analog, Signal/audio/Image Processing Power States, Allocation, Transition, Loss, Battery, Consumption, Management, Generation, Distribution, and Thermal Sensors, Interfaces, Distribution, Traces, Software, VCD, ML, DNN Traffic Reports Latency, Throughput, Utilization, Ave/peak power (instant, ave) , hit-ratio, Heat, Temp RISC-V and Chiplets RTOS and Software SiFive, In-Order/Out-of- Order Generator, Tilelink Generic RTOS, ARINC 653, AUTOSAR, task Graph AMBA (AHB/ APB/ AXI/CHI),Tilelink Corelink (600, 700), NoC (Generic, Arteris, Signature, OpenEdges), Virtual Channel, DMA, Crossbar, Serial Switch, Bridge, UCie SOC Board- Level VME, PCI/PCI-X/PCIe 6.0, SPI 3.0, 1553B, FlexRay, CAN-FD/XL, AFDX, TTEthernet, OpenVPX Processors ARM (M0-55), R5, Cortex (A8, A72, A53, A76, A77, A65, A78, A720), Nvidia- Pascal to Ampere, Generic GPU, mC, Leon, Power, X86, DSP- TI and ADI, Tensilica, Renesas SH, AI Engine, TPU Stochastic Queue ,Time Queue, Quantity Queue, Resources, Scheduler Scripting, RegEx, Task graph, Use cases, Hardware Builder, C/C++/Java/Python MatLab, STK Storage Flash, NVMe, Disk, SSD, NAS, Fibre Channel, FireWire TSN, AVB, 10BaseT1S, Switched Ethernet, Resilient Packet Ring, RP3, WiFi 802.11, Bluetooth, PAN, Spacewire, SpaceFibre, IEEE802.1Q, Time-Triggered Ethernet, AFDX, 5G Networking Memory • Memory Controller, SDR, DDR DRAM 2,3,4, 5, LPDDR 2, 3, 4,5 HBM2.0, HMC, QDR, RDRAM, MPMC, cache, Coherent cache FPGA Xilinx- Versal, Zynq, Ultrascale, Kintex Altera-Stratix, Arria, Microsemi- Smartfusion, Programmable logic generator Trade-Off Requirements, Thermal, Power, Performance, Failure Verification, Upgrade
  • 7.
    VisualSim drives Efficiency& Productivity Model Creation (6) Implementation (18) Using Current Design Methodology Project Schedule ) Implementation (12) Using VisualSim Design Methodology Time savings based on 24 month project is 20-40% Note: All times in months TM Communication and Refinement (4) Analysis (2.5) Model Creation (0.5) Analysis (1.5) Communication and Refinement (6) Advantageous over generic modeling environment due to Shorter duration & greater applicability
  • 8.
    Power Generation Power Storage Power Consumption Thermal Management • Different chargingschemes • Impact of surge and shocks • Battery Lifecycle • Battery Consumption • Statistics • Heat and temperature • Impact of cooling strategy • Add impact of power spikes • State based power consumption of electronics (controller, SOC) and Mechanical (brakes, wheels) • Average, instant and Cumulative • Power per device and application Verification and Debugging • 4 Types of Power Generators in VisualSim • Constant, variable, motor, solar charge • Charge sent to battery 1 2 3 5 6 • Optimize and test the power management algorithms • Sizing of power generators and battery • Optimize the schedule, supplynet and voltage • Estimate power consumed by the software application Downstream Integration • Generate UPF file with power domains and associated voltage levels • Generate SystemVerilog power testbench • Generate powerState change VCD dump 7 Power Management • Change in power state controlled by time, utilization, temperature and expected activity 4 Add the Power and Thermal
  • 9.
    Failure Analysis Hardware Failure Lossof processing cores, limited storage, reduced or loss memory device or bus overload/incorrect signals Software failure Resource starvation, deadlocks, data overwrite Network failure Network Congestion, misconfiguration, link loss and network errors RTOS failure Unable to achieve real-time deadlines, malicious change in schedule table, and executes beyond time slots Power Failure Both reduced and full power failure. Slower processing speed, limited number of resources can be executing concurrently MIRABILIS DESIGN INC. 9
  • 10.
    System Verification • Validateproduct not just HW/SW • Application relevant test vectors • Generate test cases and run against RTL • Compare simulation output against RTL • Match architecture timing within range • Verify functional correctness • Task sequencing @ DSP/uP • Resource contention Eliminate product failure by maximizing relevant verification Golden Reference Comparator Match Tag Architecture model of IP Verilog/C/ Hardware
  • 11.
    What is ArchitectureExploration? Scheduling/Arbitration proportional share WFQ static dynamic fixed priority EDF TDMA FCFS Communication Templates Architecture # 1 Architecture # 2 Computation Templates DSP AI GPU DRAM CPU FPGA m E DSP TDMA Priority EDF WFQ RISC DSP LookUp Cipher AI DS P CPU GPU mE DD R static Which architecture is better suited for our application?
  • 12.
    Using Task Graphto Evaluate System Architecture I/O DSP CPU1 CPU2 task1 task2 task3 task4 Contention - limited resources - scheduling/arbitration Interference of multiple applications - limited resources - scheduling/arbitration - anomalies Complex behavior - input stream - data dependent behavior
  • 13.
    Analyze the Results Systemwith faster Bus is slower in places Unpredictable System Response
  • 14.
    28/08/2024 14 Example: AvionicsSystem Model System settings and traffic profiles – normal and Emergency sequences are defined using databases • Provide power supply to all subsystems • Fault is injected to evaluate system performance under limited power supply • Provides a set of shared resources for processing various sensor signals and make decisions • Supports Dual and Triple redundancy • Fault is injected to evaluate the application performance under core failure Source: VisualSim Architect Requirement Database: • Latency • Temperature • Power • Utilization
  • 15.
    Base model- Results Thisis a dual redundancy model without lockstep mode. So only when the core_0 fails, core_1 takes over. Hence Core_1 utilization is 0.0
  • 16.
    28/08/2024 16 Key Findings No:Use case scenario Max Application latency IMA Core utilization Bus utilization (AFDX) Remarks 1 Base model – settings directly mapped from existing system architecture 11.3 msec 53.6% 99.98% Very high application latency was recorded which kept on increasing over time. AFDX bus has a very high utilization hinting the bottleneck. AFDX bus supports 10/100/1000 Mbps configuration. The base model was defined with 100 Mbps which clearly doesn’t satisfy the performance requirements. 2 AFDX bandwidth increased to 1000 Mbps 35.2 usec 66.3% 18.29% Bottleneck was correctly identified and thus acceptable application latency was obtained. 3 Reduced the number of IMA Cores by 2x 3.52 msec 99.99% 16.63% The number of IMA cores are not adequate enough to meet the processing requirements. 4 Fault injected at IMA Cores resulting in its failure 70.0 usec 67.9% 18.29% Spikes in the application latency were observed. However, even under core failure, the redundant core was able to kick in and complete the task while meeting performance requirements.
  • 17.
    VisualSim System Modelusing UCIe in ADAS SoC
  • 18.
    Vary Compute, Interconnectand Traffic Package_Type = Advanced Max_Link_Speed_GTps = 32 Number of Modules = 4 Tx_Buffer_Size = 8192 ( No packets dropped) Protocol = PCIe_Gen6 Flit_Size = 256 Bytes Num_of_Flits_per_Flow_Control_Check =8 Run Simulation with Different Configurations and Topology
  • 19.
    Behavior Task Graph PowerTable Power management Unit SystemVerilog Output for Power System Test VCD Waveform for Verification create_power_domain PD_Top -include_scope create_power_domain -name PD_1_2.0 -elements {"CLKMUX"} create_power_domain -name PD_1_1.0 -elements {"PLL","G2","G3"} create_power_domain -name PD_1_3.0 -elements {"PROC"} create_supply_port -port VDD_1.0 -direction in -domain PD_Top create_supply_port -port VDD_2.0 -direction in -domain PD_Top create_supply_port -port VDD_3.0 -direction in -domain PD_Top create_supply_port -port VSS_0.0 -direction in -domain PD_Top create_supply_net VDD_1.0 -domain PD_Top create_supply_net VDD_2.0 -domain PD_Top create_supply_net VDD_3.0 -domain PD_Top create_supply_net VSS_0.0 -domain PD_Top connect_supply_net VDD_1.0 -ports VDD_1.0 connect_supply_net VDD_2.0 -ports VDD_2.0 connect_supply_net VDD_3.0 -ports VDD_3.0 connect_supply_net VSS_0.0 -ports VSS_0.0 add_power_state PD_1_2.0 -state Active {-supply_expr (VDD_2.0 == {ON, 2.0}) && (VSS_0.0 =={ON,0.0})} add_power_state PD_1_2.0 -state OFF {-supply_expr (VDD_2.0 == {OFF, 0.0}) && (VSS_0.0 =={ON,0.0})} add_power_state PD_1_1.0 -state Active {-supply_expr (VDD_1.0 == {ON, 1.0}) && (VSS_0.0 =={ON,0.0})} add_power_state PD_1_1.0 -state OFF {-supply_expr (VDD_1.0 == {OFF, 0.0}) && (VSS_0.0 =={ON,0.0})} add_power_state PD_1_3.0 -state Active {-supply_expr (VDD_3.0 == {ON, 3.0}) && (VSS_0.0 =={ON,0.0})} add_power_state PD_1_3.0 -state OFF {-supply_expr (VDD_3.0 == {OFF, 0.0}) && (VSS_0.0 =={ON,0.0})} Power Modeling Integration
  • 20.
    Cybersecurity for Electronics Traditionview • Cybersecurity is related to networks • Cyber crime is protected with passports and firewalls Hardware View • Buffer overflow, core slowdown and memory area loss • Value change and schedule modified • Failures such as core loss, lower power or voltage and Read before write in coherent cache • Power spikes, battery lifecycle and thermal shocks Solution • Create system model with power, performance and functionality • Generate different types of workloads and failures • Power, network, hardware, software, RTOS • Create Requirements and monitor failures detected • Random modification in multiple paths and devices Debugging • Monitor metrics for power, performance and values • List of statistics that identify failures Domain Domain- Specific Safety Levels Automotive (ISO 26262) QM ASIL-A ASIL-B/C ASIL - D General (IEC - 61508) SIL -1 SIL - 2 SIL - 3 SIL - 4 Aviation (DO-178 / DO-254) DAL-E DAL-D DAL-C DAL-B DAL-A
  • 21.
    Generating Failures toObserve Behavior and Response Hardware  Single Point Faults, Latent Faults, Dual Point Faults  One of the processor core dies. Tasks get remapped to active cores  Reduced buffer size due to memory loss  Data error due to Electro magnetic Interference  Sudden occurrence of alarms which leads to more core activity Software  Deadlock and Livelock  Resource starvation RTOS  App execution within a slot going over to the next slot and not meeting the slot schedule Power  Thermal shocks and lifecycle loss  Processor core shutdown due to not enough power Network  Fault Injector  Brute Force attack
  • 22.
    List of faultscovered • Single Point Fault (SPF) • A fault that leads directly to the violation of a safety goal • Latent Fault (LF) • A fault that does not violate the functional safety goal by itself, but leads to in combination with at least one additional independent fault to a dual- or multiple-point failure, which then leads directly to the violation of a functional safety goal • Dual Point Fault (DPF) • An individual fault that, in combination with another independent fault, leads to a dual-point failure, which leads directly to the violation of a goal
  • 23.
  • 24.
    Mapping Algorithm toMulti-Resources Standard HW Library Component Basic/Starting Configuration Grayscale_Conversion - PS [A72 Core 1] IIR – Logic (PL) FFT – AI Engine Tile Edge_Image - Logic (PL) iFFT – AI Engine Tile Edge_Image_Enhancement – Logic (PL) Segmentation – PS [A72 Core 2] Image Processing Algorithm
  • 25.
    Experiments with DifferentImplementations Run 3 – Using Direct Path between Logic and AI Run 2 – Segmentation Mapped to AI Engine Run 1 – Base Configuration Mapped to Logic and ARM Application latency increasing over time. Latency increases due to Segmentation. Remap segmentation task AI Tiles Latency is deterministic Latency requirement (App latency < 80 msec) is met. Utilization across NoC is acceptable Application latency in bounded range. NoC Utilization is high. Changed interconnect for Segmentation from NoC to Direct
  • 26.
  • 27.
    Generated Statistics Per Execution unitstats, stall percentages, buffer occupancies are reported • Detailed Cache, Bus and Memory stats are generated per simulation. • Stats Include – hit ratio, throughput, latency, number of write backs, evictions etc.
  • 28.
  • 29.
  • 30.
    Use cases Run NumDescription M4 (Latency) M55 (Latency) U74 (Latency) 1 Running Dhrystone on core. No cache/bus/memory access 5.576700039E-4 9.47200014E-5 1.77875568E-5 2 Cache/Bus/Memory access 8.7438000752E-4 1.6319750281E-4 5.05307708E-5 * Number of loops are different for each core
  • 31.
    Reference Data Example: Cockpitand Image-based Designs
  • 32.
    Architecting Hardware-Software forInfotainment System Mirabilis Design Confidential DRAM Display IO A M B A A X I B u s CPU GPU Display Ctrl P C I e Video Camera SRAM Packet • System Overview • Camera : 30fps, VGA corresponds • CPU : Multi-core ARM Cortex-A53 1.2GHz • GPU : 64Cores(8Warps×8PEs), 32Threads, 1GHz • DisplayCtrl : DisplayBuffer 293,888Byte • SRAM : SDR, 64MB, 1.0GHz • DRAM : DDR3, 64MB, 2.4GHz Explore at the board- and semiconductor-level to size uP/GPU, memory bandwidth and bus/switch configuration
  • 33.
    System Model ofan Infotainment System Mirabilis Design Confidential NXP i.MX6 / nVIDIA Drive PX Xilinx FPGA Kintex 8 Discrete DMA ARM A53 GPU Display Ctrl SRAM3 DRAM3 Video IN Parameters Video OUT
  • 34.
    Conducting Architecture Trade-off •By changing the amount of video input data (packet number), observe the SRAM -> DRAM transfer performance and examine the upper limit performance of the video input that the system can tolerate. 210Packet/Sec 12ms 21Packet/Sec 41.4us 300Packet/Sec • 250 Packet/Sec is the system limit • With 300 Packet/Sec, simulation cannot be executed due to FIFO buffer overflow.
  • 35.
    VisualSim Chiplet Solution Using theChiplet Library to Design SoC
  • 36.
    ADAS SoC BlockDiagram UCIe AI Engine Tiles Warp Scheduler PE PE PE PE Local Mem GPU Memory chiplet ADC DDR5 Processor subsystem Core L1 B u s SLC • Optimal mesh size (mxn) ? • Best sample size (16 bytes vs 32 bytes etc) ? Use a single protocol stack or multi protocol stack? Do we need PCIe gen6 or still use gen5 for meeting application requirements?
  • 37.
    VisualSim System Modelusing UCIe in ADAS SoC
  • 38.
    Statistics for Multi-DieSoC • Note the AI Engine latency spikes • For multi protocol, half bandwidth for each protocol. • Older gen protocols are mixed with PCIe 6, • Lower FLIT size increases latency.
  • 39.
    Comparing Different Configurationsusing UCIe Interface All Die Adapters using PCIe 6.0 Die Adapters using PCIe 6.0 and Streaming Protocols (AXI) Lower latency when using PCIe 6.0
  • 40.
  • 41.
    Mask Region-CNN (MR-CNN)for object detection and image segmentation Overall representation of Mask R-CNN model Network Architecture of Mask R-CNN output CPU Preprocessing CPU Postprocessing
  • 42.
    Using ChatGPT totranslate AI model (Mask R-CNN) in to VisualSim Task Graph • Each of the layers are defined as different tasks in the task graph and the dependency between them is modeled. • A database is used to list the layers/functions and the parameters associated with them. • These will be used to determine the number of Multiply Accumulate (MAC) operations corresponding to each layer/function Class, box mask
  • 43.
    VisualSim Model ofDNN Hardware and Task Graph Application sequence from Task Graph is mapped to HW architecture • PE – 12x14 • 4 memory hierarchy • Power computation per PE, Buses and memory
  • 44.
    Results – Basemodel (168 AI Cores, 90% data availability at SRAM) • Peak Power consumption at around 10.8 Watts • Obtained FPS = 0.414
  • 45.
    Results – 8x8(64) cores, 90% data availability at SRAM • Peak Power consumption at around 5.6 Watts as the number of cores were reduced • Obtained FPS = 0.29, which is lower than the base model results as the number of resources for doing MAC operations were lower
  • 46.
    Results- 100% dataavailability at SRAM, 168 cores • The number of off chip memory accesses were reduced. The only accesses made were to load the images and weights into the SRAM • Obtained FPS = 9.93, which is higher than the base model results as the number of off chip memory accesses were reduced • Peak Power consumption (10.4 W) is lower as off chip memory accesses were reduced
  • 47.
    Results- 60% dataavailability at SRAM, 168 cores • The number of off chip memory accesses were increased • Obtained FPS = 0.04, which is lower than the base model results as the number of off chip memory accesses were increased
  • 48.
  • 49.
    SoC System Specification ProcessorCore – RISC-V or ARM A53 core Processor Speed – 1200 MHz L1 cache: I Cache : 32 KB : 2 way set associative D Cache : 32 KB : 4 way set associative L2 Cache Size :1 MB Associativity :16 way Ext DRAM Size :4 GB Type :DDR4 Speed :2400 MHz HW Accelerator Speed : 100 MHz Software Multimedia task Stochastic instruction trace Goals Peak Power < 1.0W Number of Matrices > 19K
  • 50.
    VisualSim SoC Model MPEGApplication IP or RISC-V level • Evaluate pipeline stages • Width, Speed • Number of execution units, Levels of cache SoC • Number of RISC-V cores • Accelerators • Cache memory hierarchy and coherence System level • Development of an IoT device, ECU or an integrated platform Behavior Hardware Bus Topology
  • 51.
    CASE 1: AllSW tasks Observations: 1. Avg power consumption within requirements (<1.0 W) 2. Performance requirement not achieved (Only a max of 9.4K frames)
  • 52.
    Sequence diagram Rotate Frame taskis found to be resource intensive
  • 53.
    CASE 2: RunRotate Frame Task on HW Accelerator Observations: 1. Avg power consumption requirement not met (> 1.3 W) 2. Performance requirement achieved ( max of 19.9K frames)
  • 54.
    CASE 3: RunRotate Frame task on HW Accelerator + Power management Observations: 1. Avg power consumption requirement met (<1.0 W) 2. Performance requirement achieved ( max of 19.8K frames)
  • 55.

Editor's Notes

  • #5 VisualSim is a fully integrated modeling and simulation environment for systems design. VisualSim enables Architects, systems engineers and designers to describe the users cases, traffic patterns and stimulus, model the system behavior and map these tasks onto validated architectures. VisualSim minimizes model development by providing pre-built parameterized libraries and enables engineers to architect better rather than focus on coding and model development. The software enables better architecture decisions and very flexible trade-off and analysis studies. The core engine consists of 5 simulators connected by a single calendar kernel. The 5 simulators include Discrete-event, synchronous data flow, continuous time, SystemC and Finite State Machine. Multiple simulators are required to create models of the system in native operating mode. For example mixed signal requires synchronous dataflow (digital) and continuous time (analog), while modeling internal operations of the processor requires discrete-event (queues, registers and pipelines) and finite state machine (instruction-execution). Libraries of queuing components, architecture resources, processing definitions, traffic or stimulus generation and statistics generators are provided. The libraries provided as parameterized graphical blocks that can be instantiated and connected on a Block Diagram Editor. In addition, there is a custom editor for the finite state machine definition. There are signal waveform viewers, plotters and interactive text displays to view the results. To enable engineers to develop models quickly, libraries of various application-specific functionality in DSP. Imaging and control systems are available. VisualSim contains an Expression Language in the core of the product. This expression is user-extendable and Chapter 2, Section3 has good description of this expression language. It contains application-specific functions, distributors, logical operations, math functions, geometry and debugging commands. These expression can be used in block and window parameters. The models are all defined in XML file formats which contain a open DTD that can be configured by the user to add extensions. The open DTD enables models to be exported into and out of VisualSim. The data types at every block port and in the expression language are data-type polymorphic. The block parameters are defined with an expression once and every execution adjusts the data types for the input and output based on the arriving transaction being a complex, integer, floating or fixed-point. VisualSim is available on all major Operating Systems including Windows, Linux, Solaris, MAC OS/X and HP.