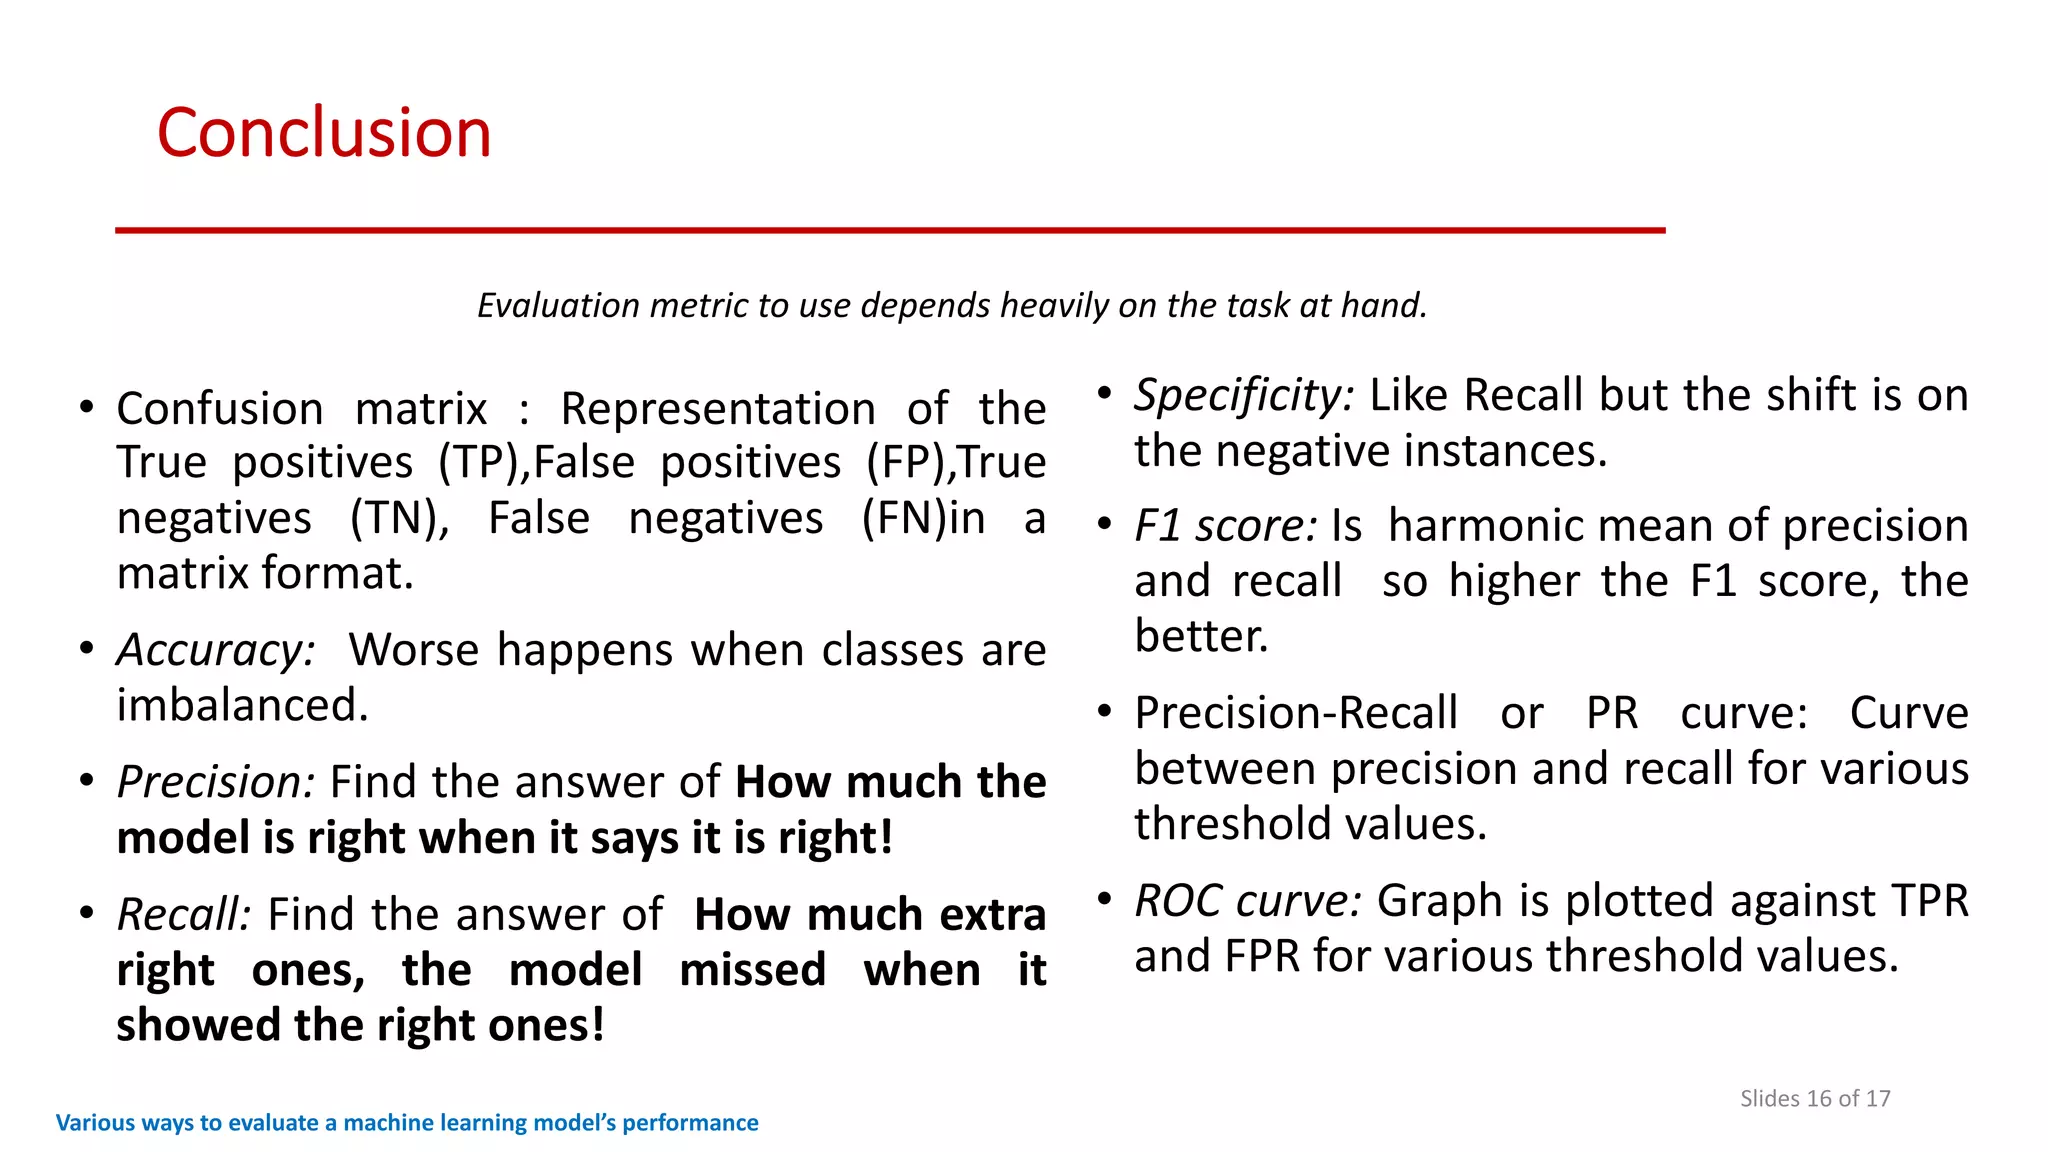
Machine Learning
Various ways to evaluate a machine learning model’s performance
February 26, 2020
Mala Deep Upadhaya
Table of Content
Slides 2 of 17
Various ways to evaluate a machine learning model’s performance
1.Warm Up With Concept
2. Confusion matrix
3.Accuracy
4.Precision
5.Recall
6.Specificity
7.F1 score
8.Precision-Recall or PR curve
9.ROC (Receiver Operating Characteristics) curve
10.PR vs ROC curve.
Warm Up With Concept
Slides 3 of 17
• Dealing around binary
classification Problem
Example: we’ll have to find if an image is
of a cat or a dog
Or
a patient is having cancer (positive) or is
found healthy (negative)
Various ways to evaluate a machine learning model’s performance
Source: https://towardsdatascience.com/decoding-the-
confusion-matrix-bb4801decbb
Confusion Matrix
Slides 4 of 17
• True positives (TP): Predicted positive and are actually
positive
• False positives (FP): Predicted positive and are actually
negative
• True negatives (TN): Predicted negative and are actually
negative
• False negatives (FN): Predicted negative and are actually
positive.
Various ways to evaluate a machine learning model’s performance
Accuracy
Slides 5 of 17
• Most used metric to judge a model
• Not clear indicator of the performance.
Example: Cancer detection model
• Chances of having cancer are very low. Say out of 100, 90 of the patients don’t have cancer
and the remaining 10 have it.
• We don’t want to miss on a patient who is having cancer but goes undetected (false
negative).
• Detecting everyone as not having cancer gives an accuracy of 90% straight.
The model did nothing here but just gave cancer free for all the 100 predictions.
Various ways to evaluate a machine learning model’s performance
Worse happens when classes are
imbalanced.
Formula:
We surely need better alternatives.
Precision
Slides 6 of 17
• Gives percentage of positive instances out of the total
predicted positive instances.
Various ways to evaluate a machine learning model’s performance
Formula:
Denominator is the model prediction
done as positive from the whole given
dataset.
How much the model is right when it says it is right!
Use it when you want to find the answer for the:
Recall/Sensitivity/True Positive Rate
Slides 7 of 17
• Gives percentage of positive instances out of the total actual
positive instances.
Various ways to evaluate a machine learning model’s performance
Formula:
Denominator is actual number of
positive instances present in the
dataset
How much extra right ones, the model missed when it showed
the right ones!
Use it when you want to find the answer for the:
Specificity
Slides 8 of 17
• Gives percentage of negative instances out of the total
actual negative instances.
• Like Recall but the shift is on the negative instances.
Various ways to evaluate a machine learning model’s performance
Formula: Denominator is actual number of
negative instances present in the
dataset
It is finding out how many healthy patients were not having cancer and were told they don’t have cancer
F1 score
Slides 9 of 17
• It is harmonic mean of precision and recall so higher the F1 score, the
better.
• Model does well in F1 score if the positive predicted are actually positives
(precision) and doesn't miss out on positives and predicts them negative
(recall).
Various ways to evaluate a machine learning model’s performance
Formula:
One drawback: Both precision and recall are given equal importance due to which according to our application we
may need one higher than the other and F1 score may not be the exact metric for it.
PR curve
Slides 10 of 17
• It is the curve between precision and recall for various
threshold values.
• In figure: 6 predictors showing their respective precision-
recall curve for various threshold values.
• Top right part of the graph is the ideal space where we get
high precision and recall
• PR AUC is just the area under the curve.
Various ways to evaluate a machine learning model’s performance
How to choose the predictor and the threshold value?
Based on our application nature
Source: https://github.com/MenuPolis/MLT/wiki/PR-Curve
ROC curve
Slides 11 of 17
• ROC stands for Receiver Operating
Characteristic.
• Graph is plotted against TPR and FPR for various
threshold values.
• TPR increases, FPR also increases.
• Eg: We have four categories and we want the
threshold value that leads us closer to the top
left corner.
Various ways to evaluate a machine learning model’s performance
ROC curve
Slides 12 of 17
• Comparing different predictors (here
3) on a given dataset also becomes
easy as you can see in right side
figure, one can choose the threshold
according to the application at
hand.
• ROC AUC is just the area under the
curve, the higher its numerical value
the better.
Various ways to evaluate a machine learning model’s performance
Source:https://en.wikipedia.org/wiki/Receiver_operating_characteristic
PR vs ROC curve
Slides 13 of 17
• Which one to use PR or ROC?
The answer lies in TRUE NEGATIVES.
Various ways to evaluate a machine learning model’s performance
PR vs ROC curve
Slides 14 of 17
• Due to the absence of TN in the precision-recall equation, they are useful in
imbalanced classes.
• Class imbalance means when there is a majority of the negative class.
• Metric doesn’t take much into consideration the high number of TRUE NEGATIVES of
the negative class which is in majority, giving better resistance to the imbalance.
Various ways to evaluate a machine learning model’s performance
This is important when the
detection of the positive class is
very important.
• Eg: To detect cancer patients, which has a high-class
imbalance because very few have it out of all the
diagnosed. We certainly don’t want to miss on a person
having cancer and going undetected (recall) and be sure
the detected one is having it (precision).
PR vs ROC curve
Slides 15 of 17
Various ways to evaluate a machine learning model’s performance
• Due to the consideration of TN or the negative class in the ROC equation, it is useful
when both the classes are important to us.
• Like the detection of cats and dog. The importance of true negatives makes sure that
both the classes are given importance, like the output of a CNN model in
determining the image is of a cat or a dog.
Conclusion
Slides 16 of 17
Various ways to evaluate a machine learning model’s performance
• Confusion matrix : Representation of the
True positives (TP),False positives (FP),True
negatives (TN), False negatives (FN)in a
matrix format.
• Accuracy: Worse happens when classes are
imbalanced.
• Precision: Find the answer of How much the
model is right when it says it is right!
• Recall: Find the answer of How much extra
right ones, the model missed when it
showed the right ones!
• Specificity: Like Recall but the shift is on
the negative instances.
• F1 score: Is harmonic mean of precision
and recall so higher the F1 score, the
better.
• Precision-Recall or PR curve: Curve
between precision and recall for various
threshold values.
• ROC curve: Graph is plotted against TPR
and FPR for various threshold values.
Evaluation metric to use depends heavily on the task at hand.
References
• https://towardsdatascience.com/various-ways-to-evaluate-a-machine-learning-models-performance-230449055f15
Slides 17 of 17
Various ways to evaluate a machine learning model’s performance

Ways to evaluate a machine learning model’s performance

  • 1.
    Machine Learning Various waysto evaluate a machine learning model’s performance February 26, 2020 Mala Deep Upadhaya
  • 2.
    Table of Content Slides2 of 17 Various ways to evaluate a machine learning model’s performance 1.Warm Up With Concept 2. Confusion matrix 3.Accuracy 4.Precision 5.Recall 6.Specificity 7.F1 score 8.Precision-Recall or PR curve 9.ROC (Receiver Operating Characteristics) curve 10.PR vs ROC curve.
  • 3.
    Warm Up WithConcept Slides 3 of 17 • Dealing around binary classification Problem Example: we’ll have to find if an image is of a cat or a dog Or a patient is having cancer (positive) or is found healthy (negative) Various ways to evaluate a machine learning model’s performance Source: https://towardsdatascience.com/decoding-the- confusion-matrix-bb4801decbb
  • 4.
    Confusion Matrix Slides 4of 17 • True positives (TP): Predicted positive and are actually positive • False positives (FP): Predicted positive and are actually negative • True negatives (TN): Predicted negative and are actually negative • False negatives (FN): Predicted negative and are actually positive. Various ways to evaluate a machine learning model’s performance
  • 5.
    Accuracy Slides 5 of17 • Most used metric to judge a model • Not clear indicator of the performance. Example: Cancer detection model • Chances of having cancer are very low. Say out of 100, 90 of the patients don’t have cancer and the remaining 10 have it. • We don’t want to miss on a patient who is having cancer but goes undetected (false negative). • Detecting everyone as not having cancer gives an accuracy of 90% straight. The model did nothing here but just gave cancer free for all the 100 predictions. Various ways to evaluate a machine learning model’s performance Worse happens when classes are imbalanced. Formula: We surely need better alternatives.
  • 6.
    Precision Slides 6 of17 • Gives percentage of positive instances out of the total predicted positive instances. Various ways to evaluate a machine learning model’s performance Formula: Denominator is the model prediction done as positive from the whole given dataset. How much the model is right when it says it is right! Use it when you want to find the answer for the:
  • 7.
    Recall/Sensitivity/True Positive Rate Slides7 of 17 • Gives percentage of positive instances out of the total actual positive instances. Various ways to evaluate a machine learning model’s performance Formula: Denominator is actual number of positive instances present in the dataset How much extra right ones, the model missed when it showed the right ones! Use it when you want to find the answer for the:
  • 8.
    Specificity Slides 8 of17 • Gives percentage of negative instances out of the total actual negative instances. • Like Recall but the shift is on the negative instances. Various ways to evaluate a machine learning model’s performance Formula: Denominator is actual number of negative instances present in the dataset It is finding out how many healthy patients were not having cancer and were told they don’t have cancer
  • 9.
    F1 score Slides 9of 17 • It is harmonic mean of precision and recall so higher the F1 score, the better. • Model does well in F1 score if the positive predicted are actually positives (precision) and doesn't miss out on positives and predicts them negative (recall). Various ways to evaluate a machine learning model’s performance Formula: One drawback: Both precision and recall are given equal importance due to which according to our application we may need one higher than the other and F1 score may not be the exact metric for it.
  • 10.
    PR curve Slides 10of 17 • It is the curve between precision and recall for various threshold values. • In figure: 6 predictors showing their respective precision- recall curve for various threshold values. • Top right part of the graph is the ideal space where we get high precision and recall • PR AUC is just the area under the curve. Various ways to evaluate a machine learning model’s performance How to choose the predictor and the threshold value? Based on our application nature Source: https://github.com/MenuPolis/MLT/wiki/PR-Curve
  • 11.
    ROC curve Slides 11of 17 • ROC stands for Receiver Operating Characteristic. • Graph is plotted against TPR and FPR for various threshold values. • TPR increases, FPR also increases. • Eg: We have four categories and we want the threshold value that leads us closer to the top left corner. Various ways to evaluate a machine learning model’s performance
  • 12.
    ROC curve Slides 12of 17 • Comparing different predictors (here 3) on a given dataset also becomes easy as you can see in right side figure, one can choose the threshold according to the application at hand. • ROC AUC is just the area under the curve, the higher its numerical value the better. Various ways to evaluate a machine learning model’s performance Source:https://en.wikipedia.org/wiki/Receiver_operating_characteristic
  • 13.
    PR vs ROCcurve Slides 13 of 17 • Which one to use PR or ROC? The answer lies in TRUE NEGATIVES. Various ways to evaluate a machine learning model’s performance
  • 14.
    PR vs ROCcurve Slides 14 of 17 • Due to the absence of TN in the precision-recall equation, they are useful in imbalanced classes. • Class imbalance means when there is a majority of the negative class. • Metric doesn’t take much into consideration the high number of TRUE NEGATIVES of the negative class which is in majority, giving better resistance to the imbalance. Various ways to evaluate a machine learning model’s performance This is important when the detection of the positive class is very important. • Eg: To detect cancer patients, which has a high-class imbalance because very few have it out of all the diagnosed. We certainly don’t want to miss on a person having cancer and going undetected (recall) and be sure the detected one is having it (precision).
  • 15.
    PR vs ROCcurve Slides 15 of 17 Various ways to evaluate a machine learning model’s performance • Due to the consideration of TN or the negative class in the ROC equation, it is useful when both the classes are important to us. • Like the detection of cats and dog. The importance of true negatives makes sure that both the classes are given importance, like the output of a CNN model in determining the image is of a cat or a dog.
  • 16.
    Conclusion Slides 16 of17 Various ways to evaluate a machine learning model’s performance • Confusion matrix : Representation of the True positives (TP),False positives (FP),True negatives (TN), False negatives (FN)in a matrix format. • Accuracy: Worse happens when classes are imbalanced. • Precision: Find the answer of How much the model is right when it says it is right! • Recall: Find the answer of How much extra right ones, the model missed when it showed the right ones! • Specificity: Like Recall but the shift is on the negative instances. • F1 score: Is harmonic mean of precision and recall so higher the F1 score, the better. • Precision-Recall or PR curve: Curve between precision and recall for various threshold values. • ROC curve: Graph is plotted against TPR and FPR for various threshold values. Evaluation metric to use depends heavily on the task at hand.
  • 17.