Evaluation Metrics-Classification
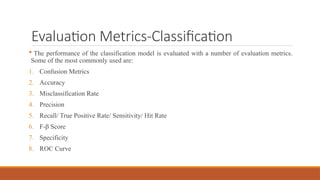
Theperformance of the classification model is evaluated with a number of evaluation metrics.
Some of the most commonly used are:
1. Confusion Metrics
2. Accuracy
3. Misclassification Rate
4. Precision
5. Recall/ True Positive Rate/ Sensitivity/ Hit Rate
6. F-β Score
7. Specificity
8. ROC Curve
3.
Confusion Matrix
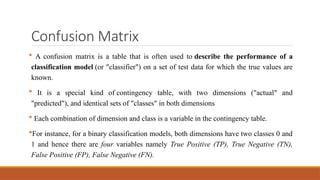
Aconfusion matrix is a table that is often used to describe the performance of a
classification model (or "classifier") on a set of test data for which the true values are
known.
It is a special kind of contingency table, with two dimensions ("actual" and
"predicted"), and identical sets of "classes" in both dimensions
Each combination of dimension and class is a variable in the contingency table.
For instance, for a binary classification models, both dimensions have two classes 0 and
1 and hence there are four variables namely True Positive (TP), True Negative (TN),
False Positive (FP), False Negative (FN).
4.
Confusion Matrix Contd….
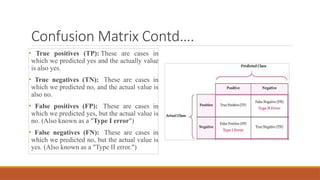
•True positives (TP): These are cases in
which we predicted yes and the actually value
is also yes.
• True negatives (TN): These are cases in
which we predicted no, and the actual value is
also no.
• False positives (FP): These are cases in
which we predicted yes, but the actual value is
no. (Also known as a "Type I error")
• False negatives (FN): These are cases in
which we predicted no, but the actual value is
yes. (Also known as a "Type II error.")
5.
Which error (TypeI/Type II) is important?
Though, we want to minimize both False positive and False Negative errors. But, sometimes it is not
possible to minimize both.
So, it depends upon the application that which error must be minimized.
For example, consider an application of classifying a patient as cancer patient (positive) or non-cancer
patient (negative). In this application, diagnosing a cancer patient as healthy (False negative) is more
important as compared to diagnosing a healthy patient as cancer (False Positive). So, False Negative
must be minimized.
Consider another application of classifying emails as spam (positive) or ham (negative). In this
application, classifying a ham email as spam (False Positive) is more important than spam as ham (False
Negative). So, False Positive must be minimized.
6.
Accuracy
Accuracy ofa classification model is defined as number of correct predictions made by the
model to the total number of predictions.
Accuracy is an important metric to be used when the data is approximately balanced (i.e., when
the number of examples of each output class are approximately same). But, it should not be
used for imbalanced datasets.
For instance, in the cancer patient diagnosis system, if we have 100 patients (95 non-cancer, 5
cancer) and our model predicts every patient as non- cancer patient. So, for such a poor model
the accuracy is 95%.
7.
Misclassification Rate
MisclassificationRate of a classification model is defined as number of
incorrect predictions made by the model to the total number of predictions.
Lower the misclassification rate, better is the model.
8.
Precision
Precision ofa classification model is defined as the number of correct
positive predictions made by the model to the total positive predictions made
by the model.
Precision is high when False Positive is low.
Therefore, precision must be used when we want to minimize False Positive
error (such as spam classification applications).
9.
Recall
Recall ofa classification model is defined as the number of correct positive
predictions made by the model to the total correct positive predictions for the model.
Recall is high when False Negative is low.
Therefore, recall must be used when we want to minimize False Negative error
(such as medical diagnosis applications).
Recall is also called sensitivity/ hit rate/ True Positive Rate
10.
F-β Score
Itis a weighted metric that considers both Precision and Recall.
It is a weighted harmonic mean of Precision and Recall.
If we want to give recall higher weightage over precision, then we take β > 1
In case precision has to be given more weightage over recall, then we take β <1.
Generally, we take value β =0.5 (for giving importance to precision over recall)
and β = 2 (for giving importance to recall over precision)
11.
F1-Score
If wegive equal weightage to Precision and Recall in F-β score, then we take
β=1 and it is called as F1-score.
It is thus, the unweighted harmonic mean of Precision and Recall.
12.
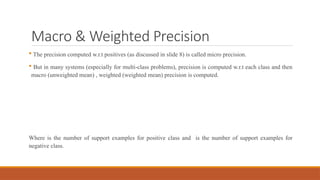
Macro & WeightedPrecision
The precision computed w.r.t positives (as discussed in slide 8) is called micro precision.
But in many systems (especially for multi-class problems), precision is computed w.r.t each class and then
macro (unweighted mean) , weighted (weighted mean) precision is computed.
Where is the number of support examples for positive class and is the number of support examples for
negative class.
13.
Macro & WeightedRecall
The recall computed w.r.t positives (as discussed in slide 9) is called micro recall.
But in many systems (especially for multi-class problems), recall is computed w.r.t each class and then
macro (unweighted mean) , weighted (weighted mean) recall is computed.
Where is the number of support examples for positive class and is the number of support examples for
negative class.
14.
Macro & WeightedF1-Score
Where is the number of support examples for positive class and is the number of support
examples for negative class.
15.
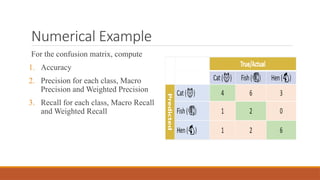
Numerical Example
For theconfusion matrix, compute
1. Accuracy
2. Precision for each class, Macro
Precision and Weighted Precision
3. Recall for each class, Macro Recall
and Weighted Recall
Sensitivity and Specificity
The terms "sensitivity" and "specificity" were introduced by American
biostatistician Jacob. It is widely used in medical diagnosis system.
Sensitivity (as discussed earlier) is the true positive rate or recall.
Specificity is True Negative rate that measures the proportion of negatives that
are correctly identified.
In medical diagnosis systems, both are important. As sensitivity tells that how
many sick patients are correctly identified as sick and specificity tells that how
many healthy patients are identified as healthy.
Thus, if a test's sensitivity is 97% and its specificity is 92%, its rate of false
negatives is 3% and its rate of false positives is 8%.
19.
ROC Curve
TheReceiver Operator Characteristic (ROC) curve is an evaluation metric for binary
classification problems.
. It is a probability curve that plots the TPR against FPR (FPR=1-Specificity) at
various threshold values.
The Area Under the Curve (AUC) is the measure of the ability of a classifier to
distinguish between classes and is used as a summary of the ROC curve.
When AUC = 1, then the classifier is able to perfectly distinguish between all the
Positive and the Negative class points correctly.
If, however, the AUC had been 0, then the classifier would be predicting all Negatives
as Positives, and all Positives as Negatives.
20.
ROC Curve (Contd…)
When 0.5<AUC<1, there is a high chance that the classifier will be able to distinguish
the positive class values from the negative class values. This is so because the classifier
is able to detect more numbers of True positives and True negatives than False negatives
and False positives.
21.
ROC Curve (Contd…)
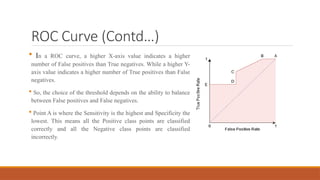
In a ROC curve, a higher X-axis value indicates a higher
number of False positives than True negatives. While a higher Y-
axis value indicates a higher number of True positives than False
negatives.
So, the choice of the threshold depends on the ability to balance
between False positives and False negatives.
Point A is where the Sensitivity is the highest and Specificity the
lowest. This means all the Positive class points are classified
correctly and all the Negative class points are classified
incorrectly.
22.
ROC Curve (Contd…)
Although Point B has the same Sensitivity as Point A, it has a
higher Specificity. Meaning the number of incorrectly
Negative class points is lower compared to the previous
threshold. This indicates that this threshold is better than the
previous one.
Between points C and D, the Sensitivity at point C is higher
than point D for the same Specificity. This means, for the same
number of incorrectly classified Negative class points, the
classifier predicted a higher number of Positive class points.
Point E is where the Specificity becomes highest. Meaning
there are no False Positives classified by the model. The model
can correctly classify all the Negative class points!


![[English Version]Maker-Ray Product Brochure V3 .pdf](https://cdn.slidesharecdn.com/ss_thumbnails/englishversionmaker-rayproductbrochurev3-260113094444-0156dbdc-thumbnail.jpg?width=640&height=640&fit=bounds)


