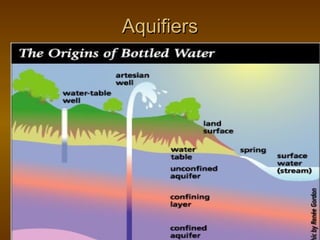
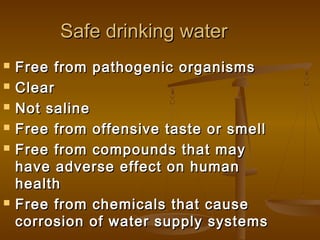
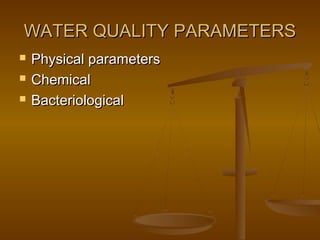
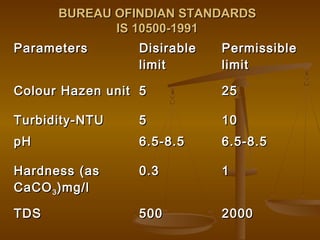
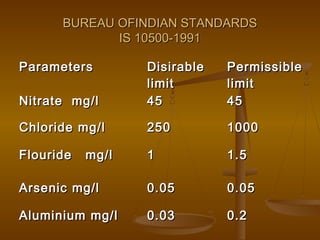
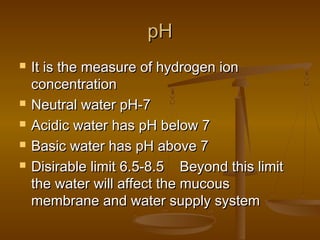
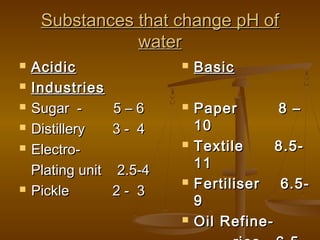
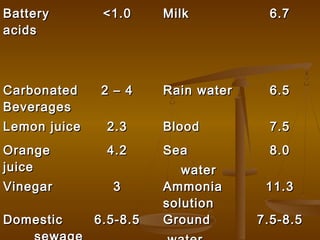
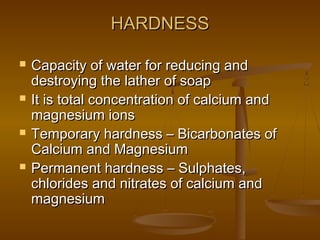
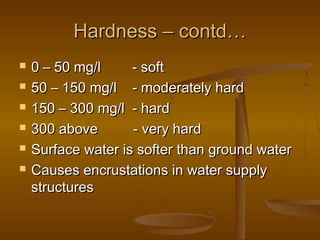
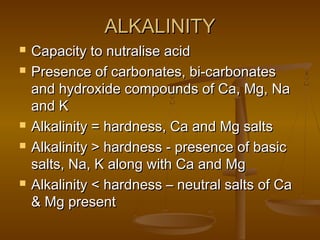
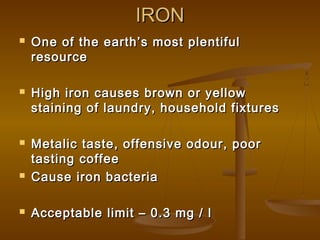
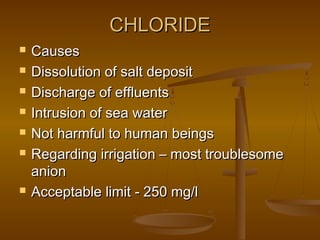
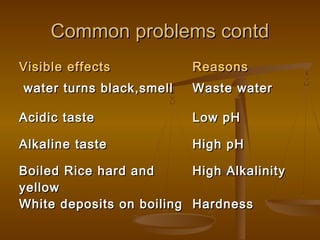
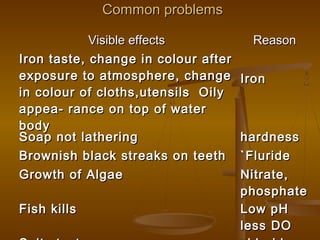
This document discusses water quality standards and parameters for drinking water. It outlines the physical, chemical, and bacteriological contamination sources that can affect water. The key water quality parameters discussed include turbidity, pH, hardness, alkalinity, iron, chloride, nitrate, fluoride, arsenic, and heavy metals. BIS drinking water standards for various parameters are provided. The importance of residual chlorine is also mentioned. Overall, the document provides an overview of water quality issues and the standards used to define safe drinking water.
Water Quality Monitoring Management Powerpoint Presentation SlidesSlideTeam
Introducing Water Quality Monitoring Management PowerPoint Presentation Slides which will assist in developing, distributing, and managing the optimum use of water resources. By taking advantage of our readily available water testing PPT visuals, discuss the six main indicators of the water quality. This water resource management PPT slide deck can be used by the department of water for analyzing information about water quality and to underpin decisions about water resource management. You can provide an overview of water market size, growth rate, and capital expenditure by using our readily available water quality modeling PPT slideshow. Describe how you can monitor and assess the water quality in order to manage the water resources. You can also showcase the wastewater treatment according to various industry types by utilizing these water quality monitoring PowerPoint slides. Highlight the trends that can influence the water industry in the future. Also, showcase the factors that can affect the performance of the water technology market. Hence, download our ready-to-use assessing water quality PowerPoint presentation and ensure the optimum use of water resources. https://bit.ly/30tFhdE
Well this is my first presentation in the slide share. In this presentation i have mentioned about the concept of water quality and guidelines for it in with the perspective to human health and its management in Nepal.
Suggestion and feedbacks are really welcome.
Over the last decade, demand for spring management has increased as traditional spring sources have started drying up or becoming contaminated. In response, communities, NGOs and state agencies began dedicated spring protection programmes. In the Himalayas, the State of Sikkim and organizations such as Central Himalayan Action and Research Group (CHIRAG) and People Science Institute (PSI) started identifying and protecting spring recharge areas around 2007. The difference between these programmes and many other previous efforts is that they went beyond supply-side improvements to focus on the use of hydrogeology to map springsheds for targeted interventions.
The Advanced Centre for Water Resources Development and Management (ACWADAM), a research and capacity-building organization comprised of hydrogeologists and other experts began lending their expertise and building capacity of stakeholders. ACWADAM provides technical support, training and materials in hydrogeology to all network partners as well as others in India and the region. Similar programmes began independently in most of the mountain regions of India. Arghyam, a funding organization that was supporting many of these programmes, noticed that these disparate initiatives shared commonalities despite geographic diversity. They thus organized and funded a meeting of these various organizations in June 2014, and the Springs Initiative was born.
The springs initiative aims to tackle the current water crisis and to ensure safe and sustainable access to water for all, by promoting responsible and appropriate management of aquifers, springsheds, and watersheds and conserving ecosystems in partnership with communities, governments and other stakeholders.
This presentation has been developed as a part of the springs initiative to promote an understanding of springs and their role in mountainous areas.
Quality of water :
It includes all the physical, chemical and biological parameters along with test to be used for defining water quality and water schemes for city
This presentation describes, how the water can be analyzed using the basic parameters like DO, COD, BOD, Alkalinity and so on. The physical, chemical, and biological parameters were discussed here.
Water Quality Assessment Powerpoint Presentation SlidesSlideTeam
Introducing Water Quality Assessment Powerpoint Presentation Slides. Our readily available water monitoring system PowerPoint slide designs provide an overview of market size, growth rate, and capital expenditure. Demonstrate the division of the wastewater treatment market by editing our content-ready water quality check PPT slide deck. You can easily present the key statistics that play a vital role in analyzing the water industry by using this water treatment PPT slideshow. It is easy to present the key trends that will influence the water industry in the future such as increasing regulation, failing infrastructure, greater conservation, and efficiency, etc. Showcase the leading factors that will affect the performance of the water technology market by using content-ready water quality assurance PowerPoint visuals. You can edit water quality testing PPT themes to present the sources of water pollution. Highlight the natural processes and human processes that affect water quality. Provide an overview of the optimization of deterioration in water quality. You also can present the chemicals and biological pollutants that deteriorate the water quality. Showcase the water quality monitoring types and their objectives by downloading our visually attention-grabbing water quality monitoring PPT slides. https://bit.ly/3lzljrF
COMPARATIVE ANALYSIS OF WATER QUALITY IN TAMIRABARANI RIVER ENCROACHED BY WAT...Jenson Samraj
This dissertation explains the analysis of water quality in which the Eichhornia crassipes lives further from many different samples the water was analyzed by my friend Mr. Esakki Raja
In this presentation, application of some parameters of water wwater analysis (i.e., Acidity, Sulfate, Volatile Acid,Nitrogen,greases and oils) , procedure to measure that parameter, environmental significance of that parameter and importance of that parameter in waste water analysis.
most important topic for more clearance of water quality standards which covers latest Indian and WHO guidelines and provides a real scenario of water standards in India and the recent advances made for purification of water in India and worldwide. The presentation is little bit lengthy but deals with all required aspects in short.
Surface Water Management Powerpoint Presentation SlidesSlideTeam
Introducing Surface Water Management PowerPoint Presentation Slides. Take the advantage of high-quality water management plan PPT infographics to give an overview of market size, growth rate, and capital expenditure of the water industry, etc. Demonstrate the process of planning, developing, and managing the optimum use of water with the help of this PPT slide deck. The slideshow effectively depicts the division of the wastewater treatment market. Highlight the key trends that will influence the water industry in the future such as, failing infrastructure, greater conservation, increasing regulation and efficiency. Modify our water resources PPT presentation to portray the natural and human processes that affect water quality. Our groundwater management PPT templates can aptly present the organization chart for the water supply authority. The slideshow also explains various topics like the wastewater treatment process, reuse by sector, and treated wastewater quality parameters. Highlight the water management KPI metrics by downloading this sustainable water management PowerPoint slide deck. https://bit.ly/3yKotPp
This presentation discusses the drinking water quality parameters, drinking water quality standards, water quality index and classification of water bodies and standards
wholesomeness, Requirements for Domestic Use. Impurities in Water. Objects & purpose of Water Analysis.Collection of Samples. Classification of Analysis of Water: Physical,
Chemical & Biological Examination of Water.
INTRODUCTION TO WATER POLLUTION PARAMETERS -CONCEPT, OBJECTIVES AND NEED OF W...Arvind Kumar
INTRODUCTION TO WATER POLLUTION PARAMETERS
-CONCEPT, OBJECTIVES AND NEED OF WATER QUALITY MONITORING, SAMPLING AND ANALYSIS
by DR. I.D. MALLDepartment of Chemical Engg.Indian Institute of Technology, RoorkeeRoorkee- 247667
This presentation is in two parts made by me for non technical staff of Kindasa water during my tenure, any person may use this for education purpose with my identity,
Palestine last event orientationfvgnh .pptxRaedMohamed3
An EFL lesson about the current events in Palestine. It is intended to be for intermediate students who wish to increase their listening skills through a short lesson in power point.
We all have good and bad thoughts from time to time and situation to situation. We are bombarded daily with spiraling thoughts(both negative and positive) creating all-consuming feel , making us difficult to manage with associated suffering. Good thoughts are like our Mob Signal (Positive thought) amidst noise(negative thought) in the atmosphere. Negative thoughts like noise outweigh positive thoughts. These thoughts often create unwanted confusion, trouble, stress and frustration in our mind as well as chaos in our physical world. Negative thoughts are also known as “distorted thinking”.
Welcome to TechSoup New Member Orientation and Q&A (May 2024).pdfTechSoup
In this webinar you will learn how your organization can access TechSoup's wide variety of product discount and donation programs. From hardware to software, we'll give you a tour of the tools available to help your nonprofit with productivity, collaboration, financial management, donor tracking, security, and more.
Model Attribute Check Company Auto PropertyCeline George
In Odoo, the multi-company feature allows you to manage multiple companies within a single Odoo database instance. Each company can have its own configurations while still sharing common resources such as products, customers, and suppliers.
Students, digital devices and success - Andreas Schleicher - 27 May 2024..pptxEduSkills OECD
Andreas Schleicher presents at the OECD webinar ‘Digital devices in schools: detrimental distraction or secret to success?’ on 27 May 2024. The presentation was based on findings from PISA 2022 results and the webinar helped launch the PISA in Focus ‘Managing screen time: How to protect and equip students against distraction’ https://www.oecd-ilibrary.org/education/managing-screen-time_7c225af4-en and the OECD Education Policy Perspective ‘Students, digital devices and success’ can be found here - https://oe.cd/il/5yV
The French Revolution, which began in 1789, was a period of radical social and political upheaval in France. It marked the decline of absolute monarchies, the rise of secular and democratic republics, and the eventual rise of Napoleon Bonaparte. This revolutionary period is crucial in understanding the transition from feudalism to modernity in Europe.
For more information, visit-www.vavaclasses.com
2024.06.01 Introducing a competency framework for languag learning materials ...Sandy Millin
http://sandymillin.wordpress.com/iateflwebinar2024
Published classroom materials form the basis of syllabuses, drive teacher professional development, and have a potentially huge influence on learners, teachers and education systems. All teachers also create their own materials, whether a few sentences on a blackboard, a highly-structured fully-realised online course, or anything in between. Despite this, the knowledge and skills needed to create effective language learning materials are rarely part of teacher training, and are mostly learnt by trial and error.
Knowledge and skills frameworks, generally called competency frameworks, for ELT teachers, trainers and managers have existed for a few years now. However, until I created one for my MA dissertation, there wasn’t one drawing together what we need to know and do to be able to effectively produce language learning materials.
This webinar will introduce you to my framework, highlighting the key competencies I identified from my research. It will also show how anybody involved in language teaching (any language, not just English!), teacher training, managing schools or developing language learning materials can benefit from using the framework.
7. Safe drinking water
Free from pathogenic organisms
Clear
Not saline
Free from offensive taste or smell
Free from compounds that may
have adverse effect on human
health
Free from chemicals that cause
corrosion of water supply systems
11. Colour
May be due to the Presence of organic
matter,metals(iron, manganese) or highly
coloured industrial waste
Aesthetically displeasing
Disirable that drinking water be colourless
Disirable limit, 5 Hazen unit
Permissible limit 25 Hazen Unit
12. Taste and Odour
Mainly due to organic
substances, ,Biological activity,
industrial pollution
Taste buds in the oral cavity
specially detect inorganic
compounds of metals like
magnesium, calcium, sodium,
copper, iron and zinc
Water should be free from
objectionable taste and odour.
13. Turbidity
Caused by suspended matter
High level turbidity shield and
protect bacteria from the action of
disinfecting agents
Disirable limit-5NTU
should be below 1 NTU when
disinfection is practiced
Permissible limit-10NTU
14. pH
It is the measure of hydrogen ion
concentration
Neutral water pH-7
Acidic water has pH below 7
Basic water has pH above 7
Disirable limit 6.5-8.5 Beyond this limit
the water will affect the mucous
membrane and water supply system
15. Substances that change pH of
water
Acidic
Industries
Sugar Distillery
ElectroPlating unit
Pickle
5–6
3- 4
2.5-4
2- 3
Basic
Paper
8 –
10
Textile
8.511
Fertiliser
6.59
Oil Refine-
17. HARDNESS
Capacity of water for reducing and
destroying the lather of soap
It is total concentration of calcium and
magnesium ions
Temporary hardness – Bicarbonates of
Calcium and Magnesium
Permanent hardness – Sulphates,
chlorides and nitrates of calcium and
magnesium
18. Hardness – contd…
0 – 50 mg/l
- soft
50 – 150 mg/l - moderately hard
150 – 300 mg/l - hard
300 above
- very hard
Surface water is softer than ground water
Causes encrustations in water supply
structures
19. ALKALINITY
Capacity to nutralise acid
Presence of carbonates, bi-carbonates
and hydroxide compounds of Ca, Mg, Na
and K
Alkalinity = hardness, Ca and Mg salts
Alkalinity > hardness - presence of basic
salts, Na, K along with Ca and Mg
Alkalinity < hardness – neutral salts of Ca
& Mg present
20. IRON
One of the earth’s most plentiful
resource
High iron causes brown or yellow
staining of laundry, household fixtures
Metalic taste, offensive odour, poor
tasting coffee
Cause iron bacteria
Acceptable limit – 0.3 mg / l
21. CHLORIDE
Causes
Dissolution of salt deposit
Discharge of effluents
Intrusion of sea water
Not harmful to human beings
Regarding irrigation – most troublesome
anion
Acceptable limit - 250 mg/l
22. NITRATE
Increasing level of nitrate is due to
Agricultural fertilizers, manure,animal
dung, nitrogenous material ,sewage
pollution
(blue baby diseases to infants)
Maximum permissible limit 45 mg / l
23. FLOURIDE
Occurs naturally
Long term consumption above
permissible level can cause –
dental flurosis (molting of teeth)
Skeletal flurosis
Acceptable limit – 1 mg / l
Maximum permissible limit – 1.5 mg / l
Remedy – 1) Deflouridation
2) Mixing Fluride free water
3) Intake of vitamin C,D,
calcium,antioxidants
24. FLOURIDE CAUSES
Three types of
Fluorosis
1. Dental
Fluorosis
2. Skeletal
Fluorosis
3. Non-skeletal
Fluorosis
25. ARSENIC
Occur in ground water from arseniferous
belt
Industrial waste, agricultural insecticide
High arsenic causes 1) various type of
dermatological lesions, muscular
weakness, paralysis of lower limbs, can
also cause skin and lung cancer
Acceptable limit – 0.05 mg / l
26. Heavy Metals
Present as mineral in soil and rocks of
earth
Human activities
Battery – Lead & Nickel
Textile - Copper
Photography – Silver
Steel production – Iron
29. RESIDUAL CHLORINE
Chlorine added to water forms
hypochlorite ions and hypochlorite acids
Chlorine demand – Quantity required for
killing micro organisms and reacting with
ammonia, organic compounds etc.
Free residual chlorine – To take care of
post contamination
Desirable – 0.2 mg / liter
30. Common problems contd
Visible effects
water turns black,smell
Reasons
Waste water
Acidic taste
Low pH
Alkaline taste
High pH
Boiled Rice hard and
High Alkalinity
yellow
White deposits on boiling Hardness
31. Common problems
Visible effects
Iron taste, change in colour after
exposure to atmosphere, change
in colour of cloths,utensils Oily
appea- rance on top of water
body
Soap not lathering
Brownish black streaks on teeth
Growth of Algae
Fish kills
Reason
Iron
hardness
`Fluride
Nitrate,
phosphate
Low pH
less DO