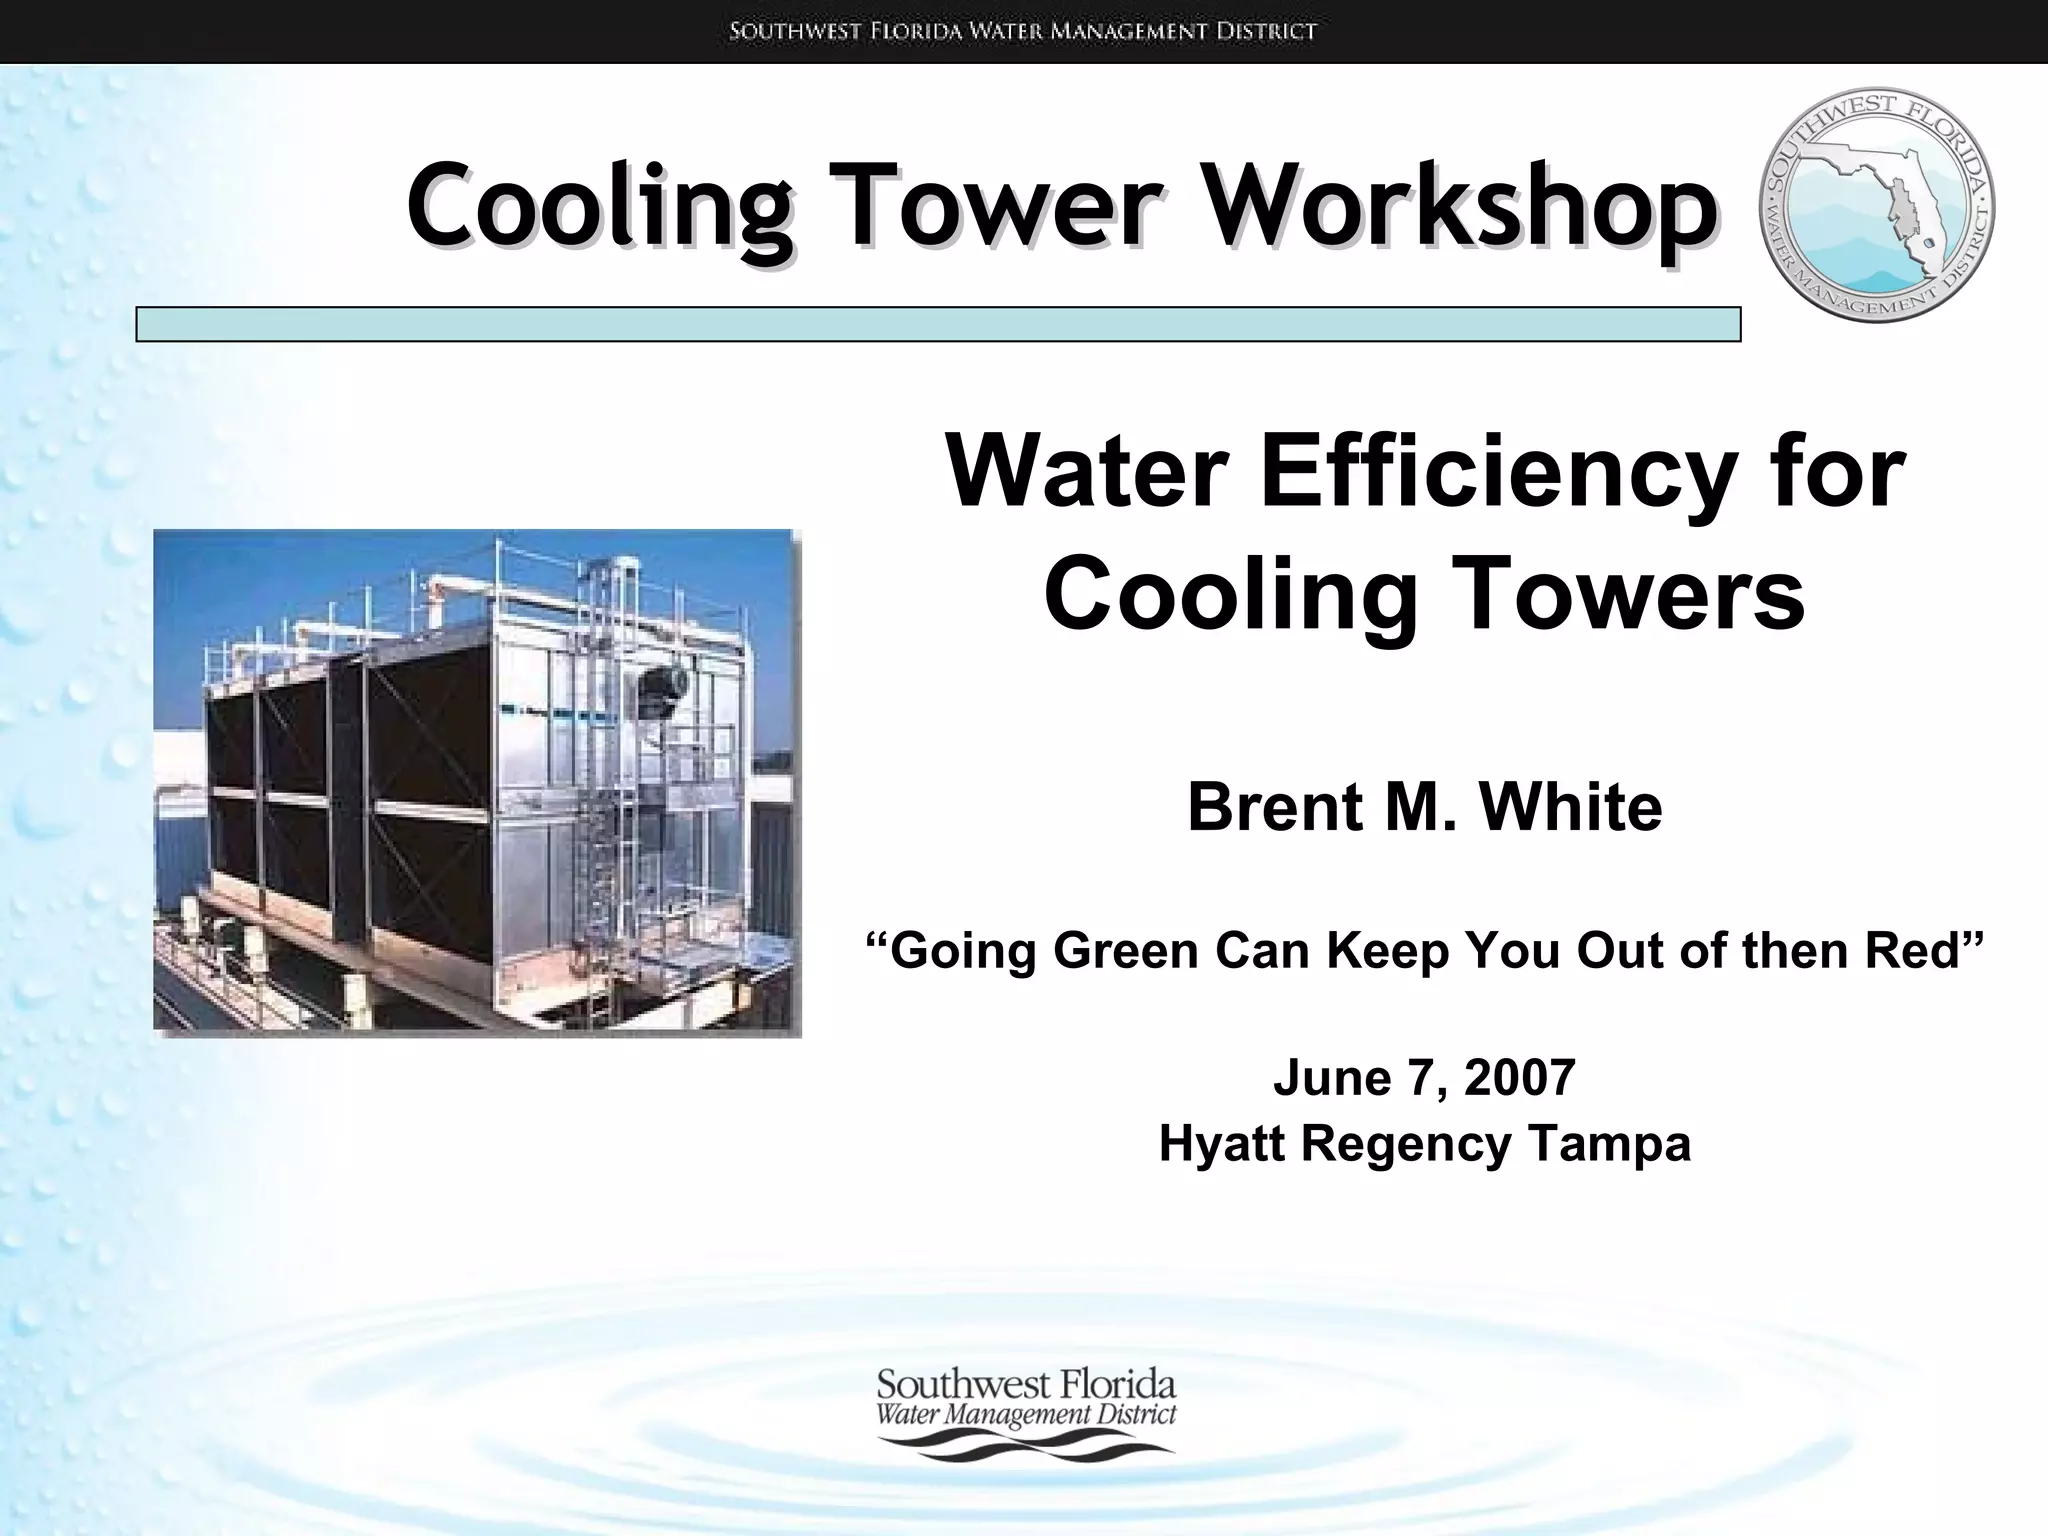
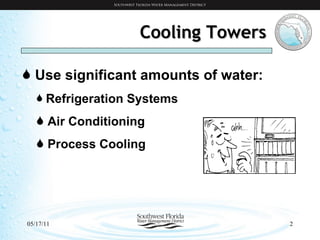
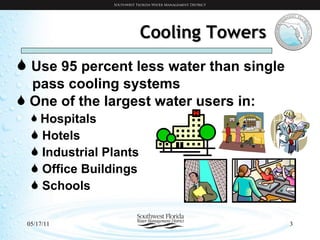
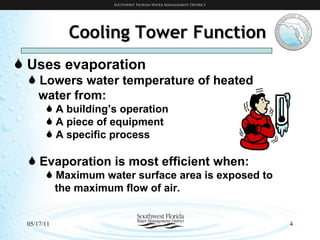
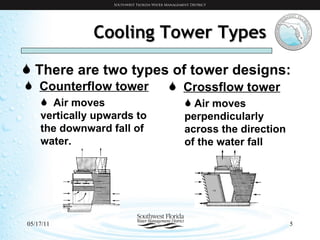
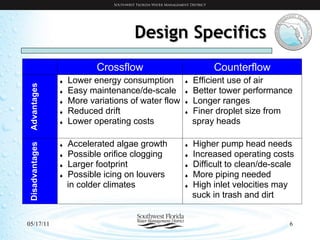
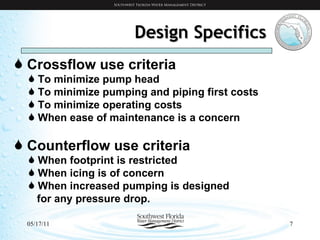
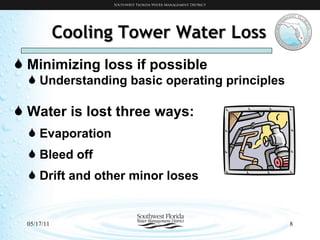
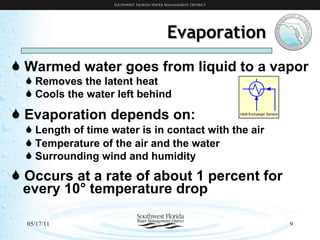
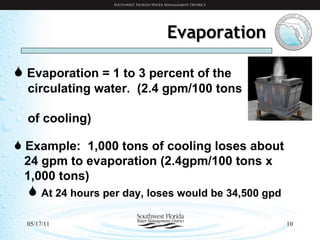
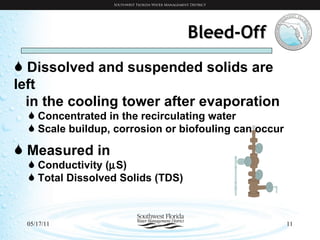
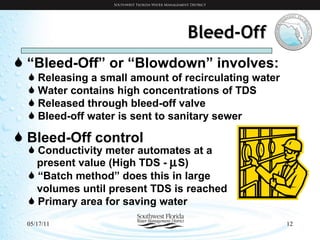
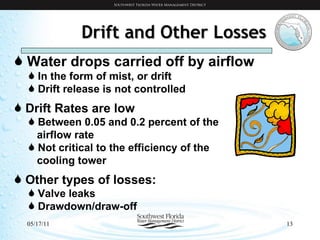
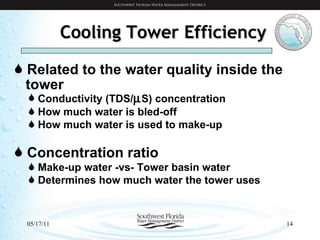
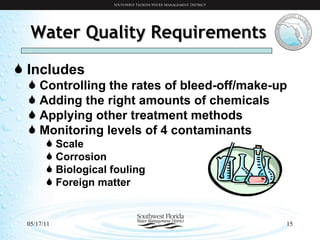
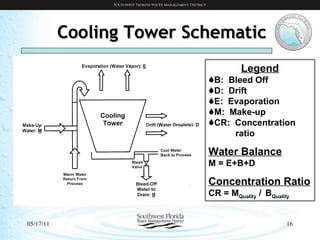
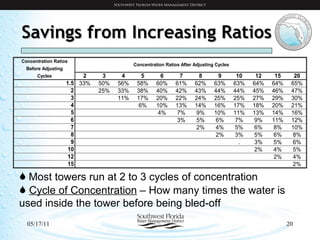
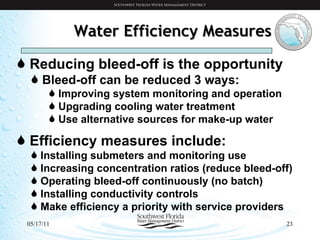
Cooling towers use significant amounts of water for processes like air conditioning and refrigeration. They are one of the largest water users in places like hospitals, hotels, and office buildings. Cooling towers work by evaporating a small portion of water to lower the temperature of the remaining water in an efficient closed-loop system. There are two main types of cooling tower designs, and water is lost primarily through evaporation, bleed-off of concentrated water, and minor drift. Increasing the concentration ratio by reducing bleed-off through improved monitoring, treatment, and alternative water sources can significantly conserve water use.
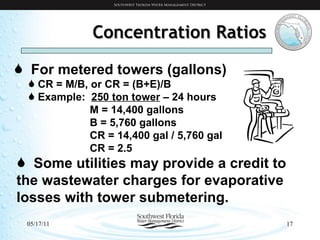
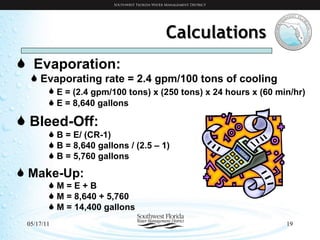
![Concentration Ratios For unmetered towers (gallons) Calculation based on the conductivity concentration ratio (TDS/ S) CR = [B] / [M] Example: Bleed-off conductivity = 1,400 S Make-up conductivity = 550 S CR = 1,400 / 550 CR = 2.5](https://image.slidesharecdn.com/coolingtowermanagementoverview-5-6-2007v2-110517142406-phpapp02/85/Water-Conservation-Cooling-Tower-Management-Overview-18-320.jpg)
![Thank You! Any Questions? For more info: [email_address]](https://image.slidesharecdn.com/coolingtowermanagementoverview-5-6-2007v2-110517142406-phpapp02/85/Water-Conservation-Cooling-Tower-Management-Overview-26-320.jpg)