Downloaded 257 times
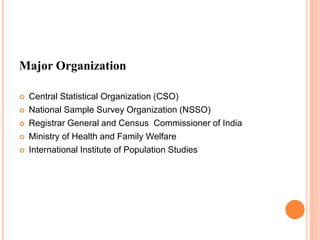
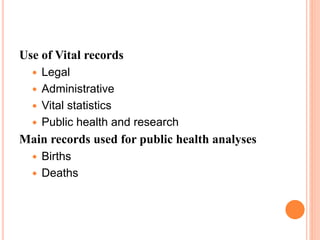
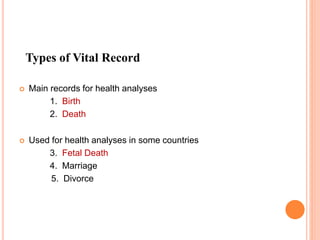


Vital statistics in India provide information on births, deaths, marriages and other demographic events. The collection and dissemination of vital statistics involves several organizations under different ministries. Key organizations include the Central Statistical Organization, National Sample Survey Organization, and Registrar General and Census Commissioner of India. Vital statistics data is used for administrative, legal and public health purposes like analyzing disease patterns and justifying health programs. Factors like population census, civil registration and sample registration systems contribute to India's vital statistics.