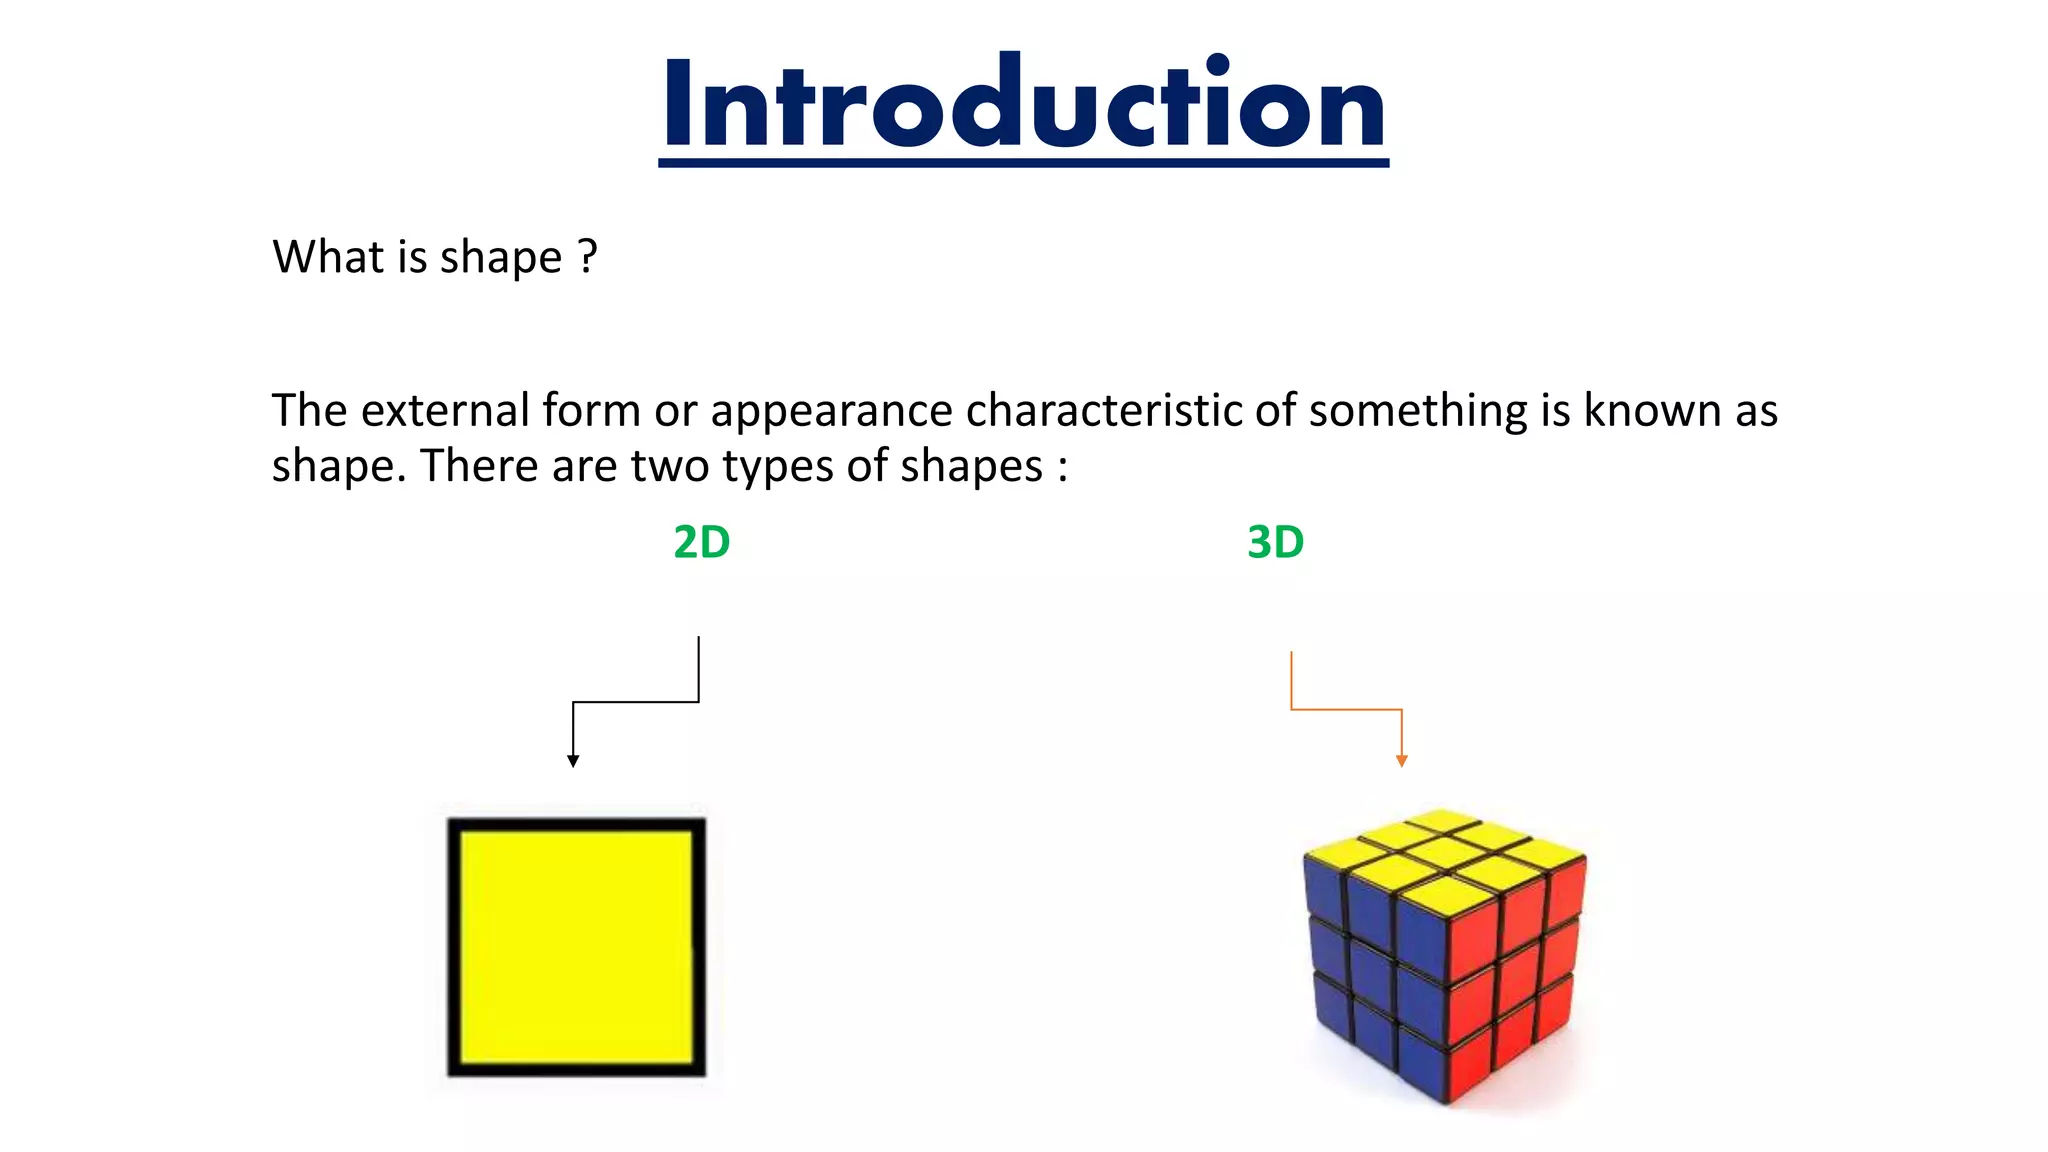
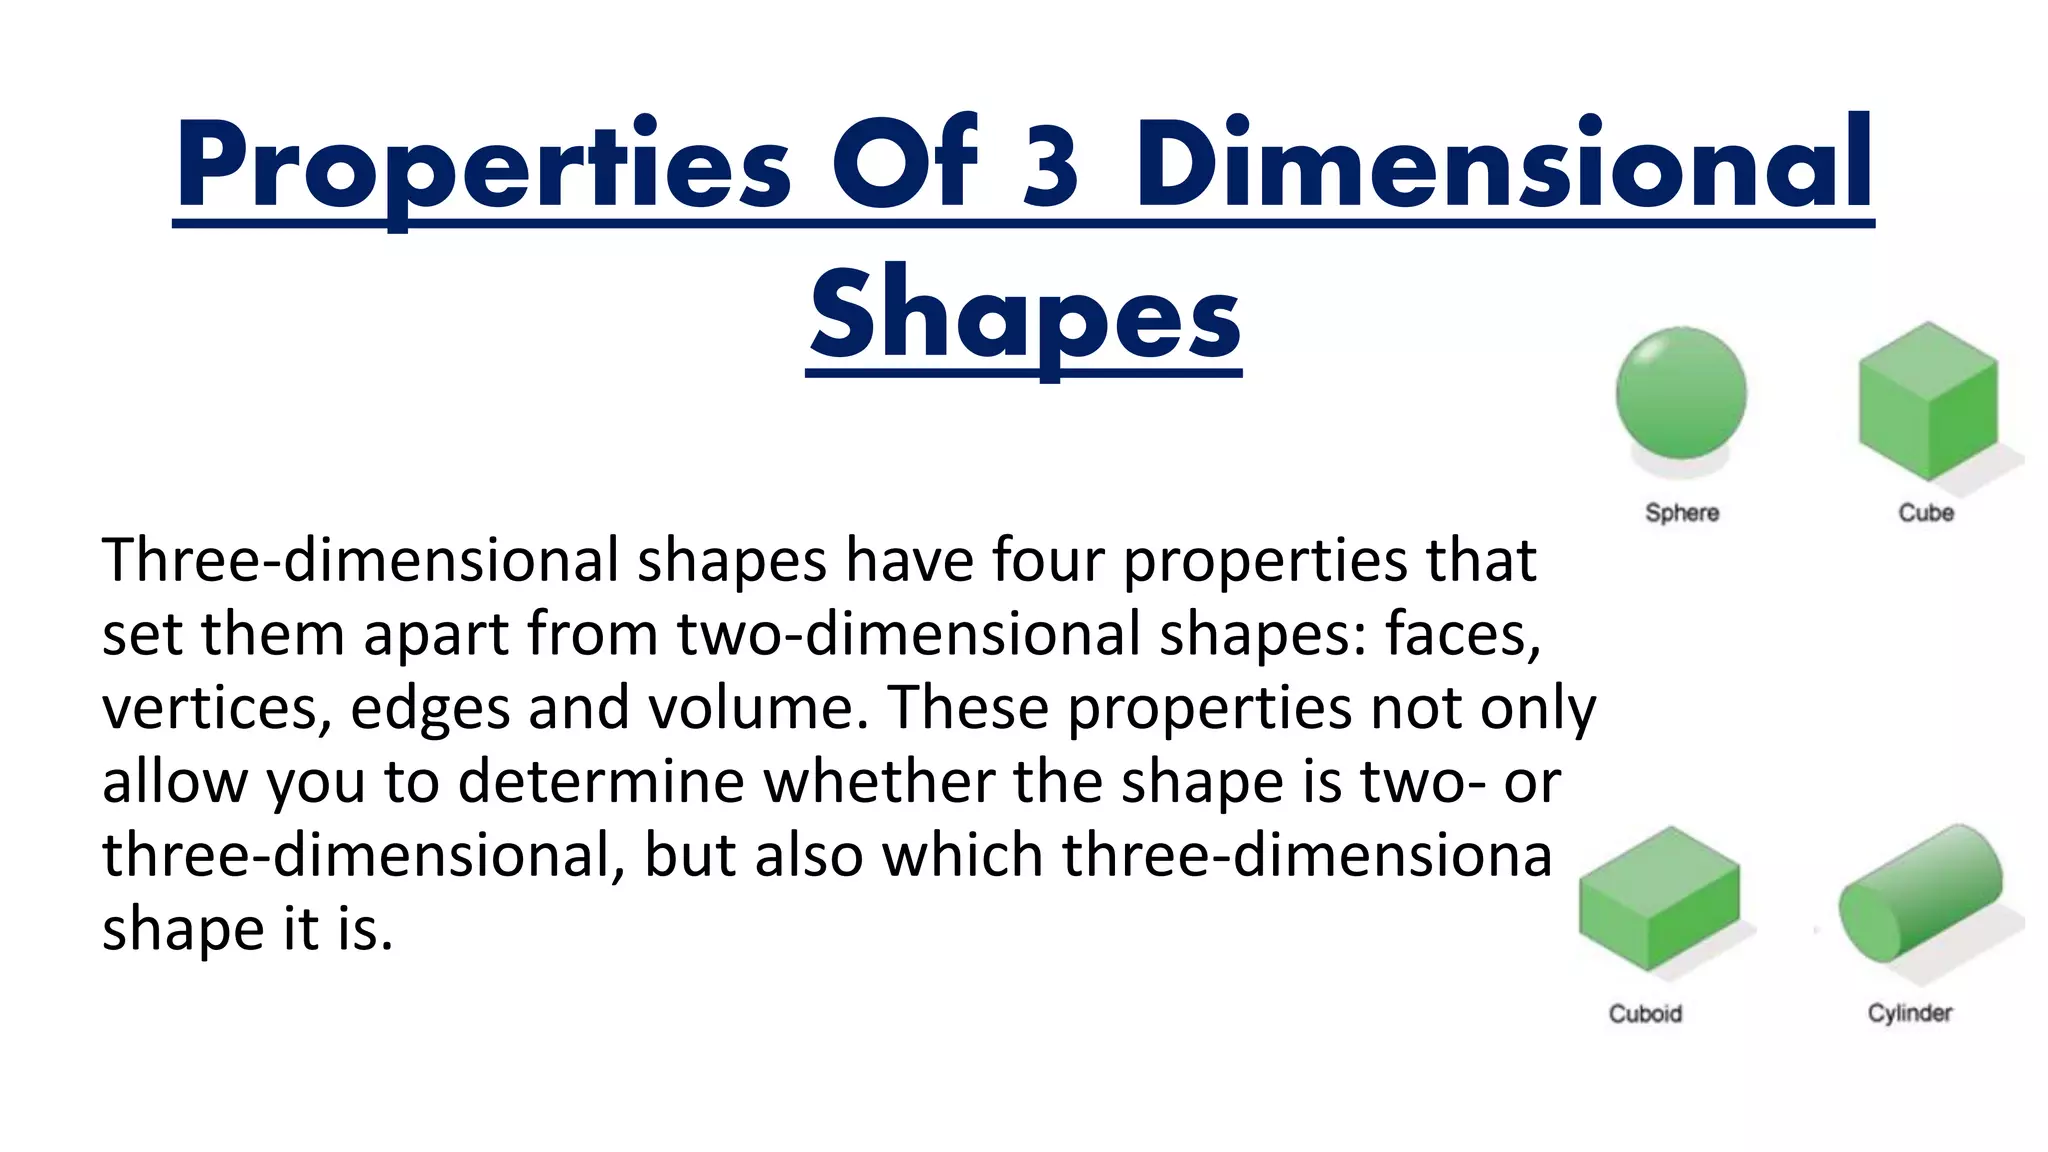
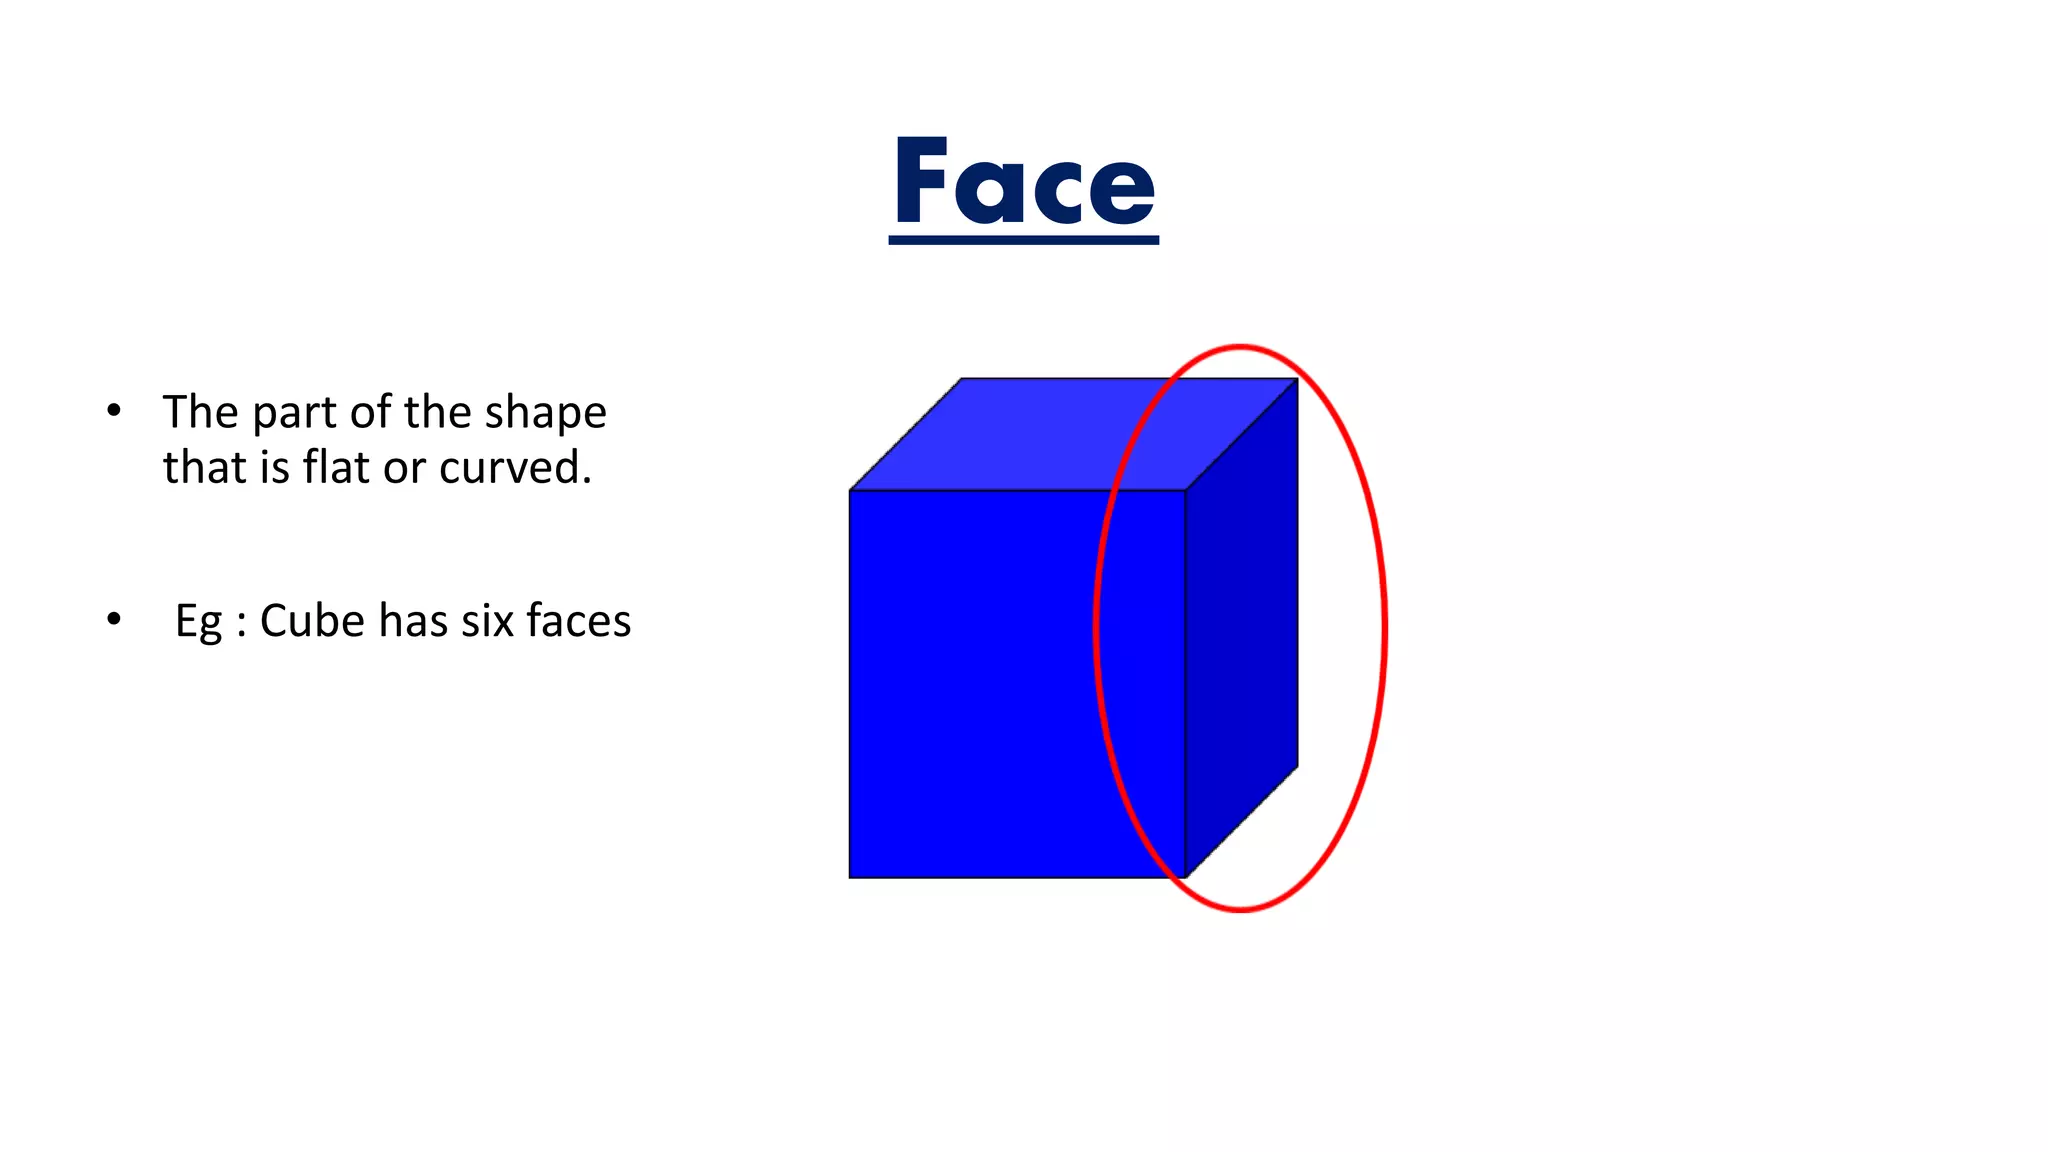
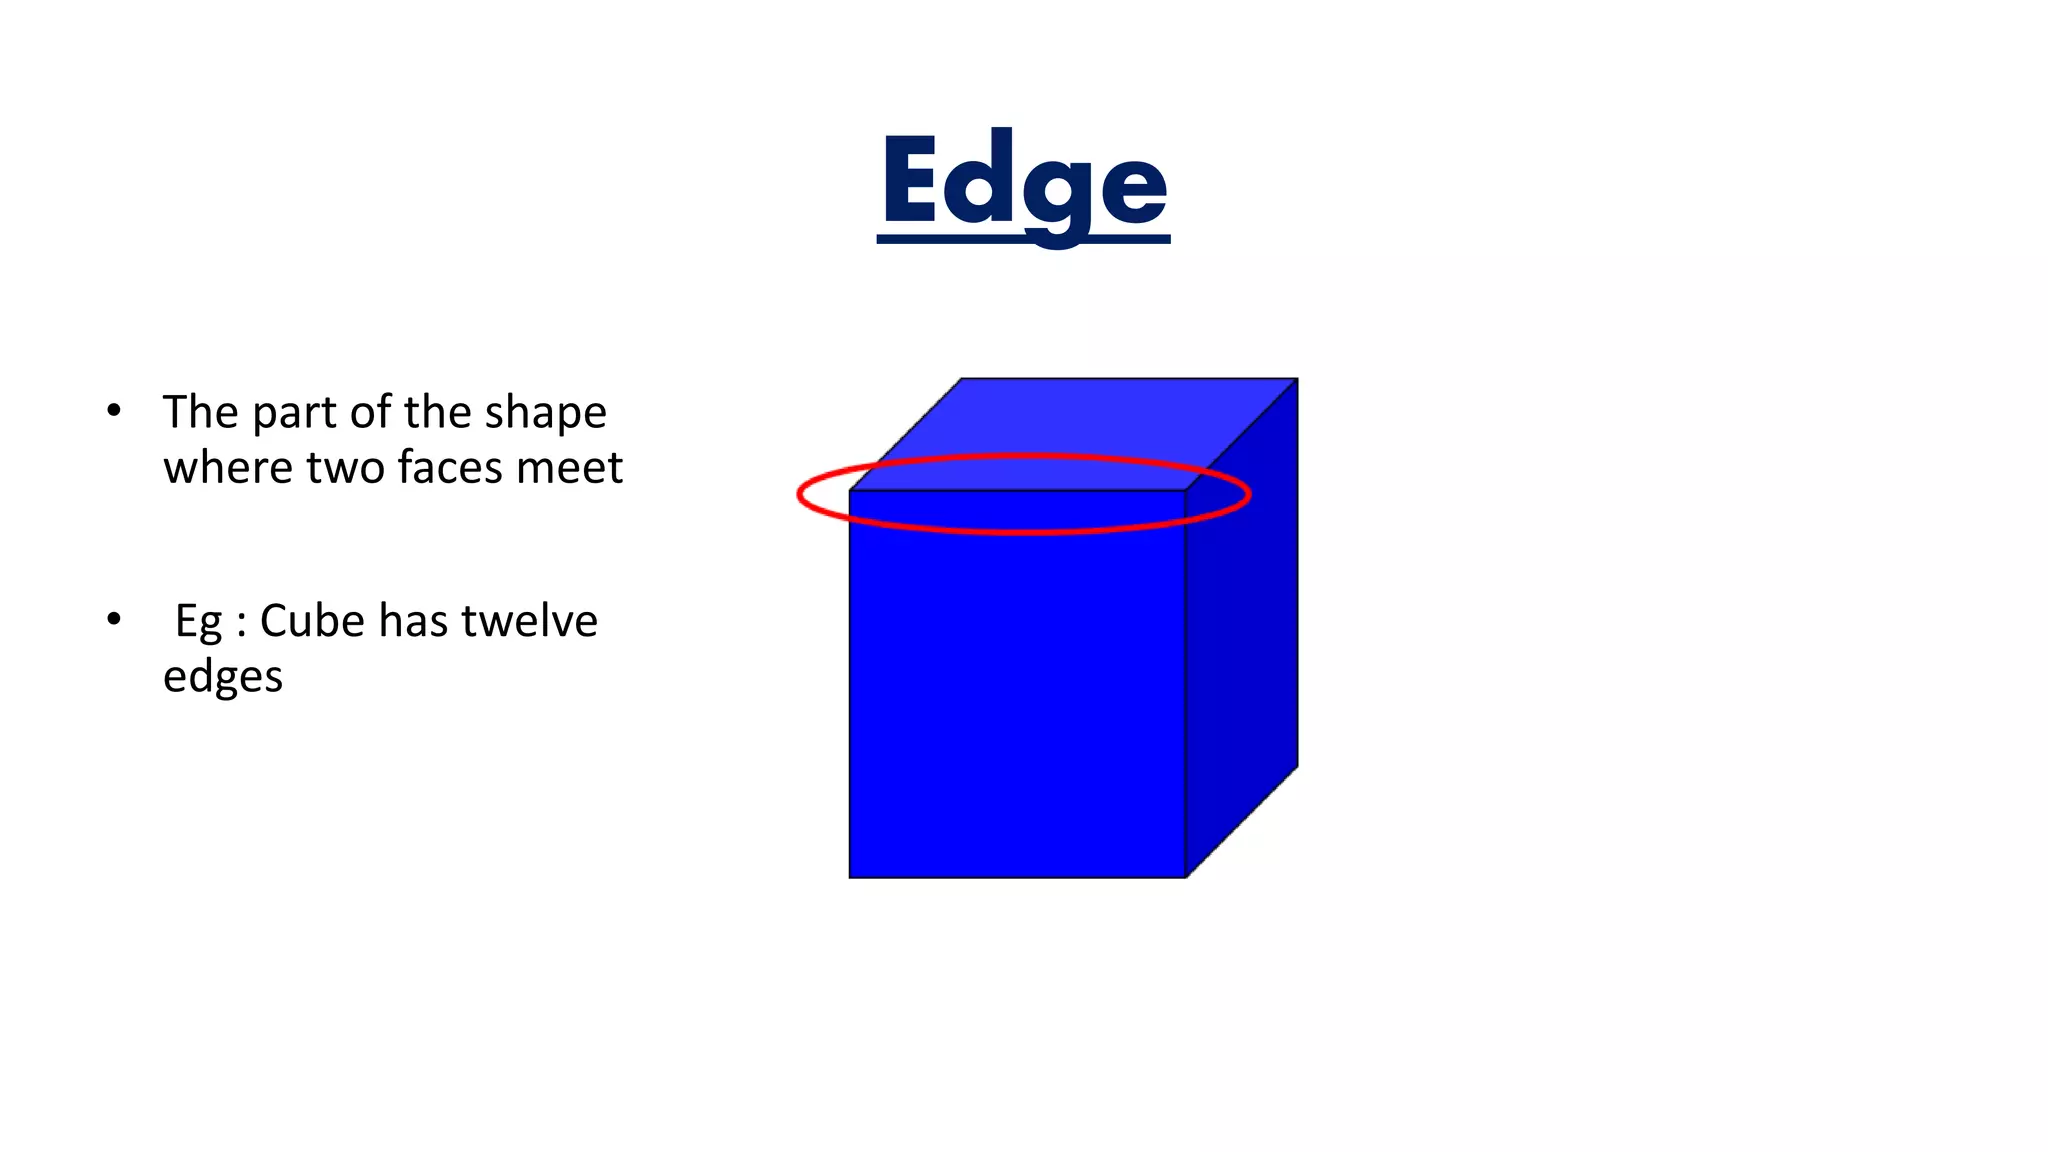
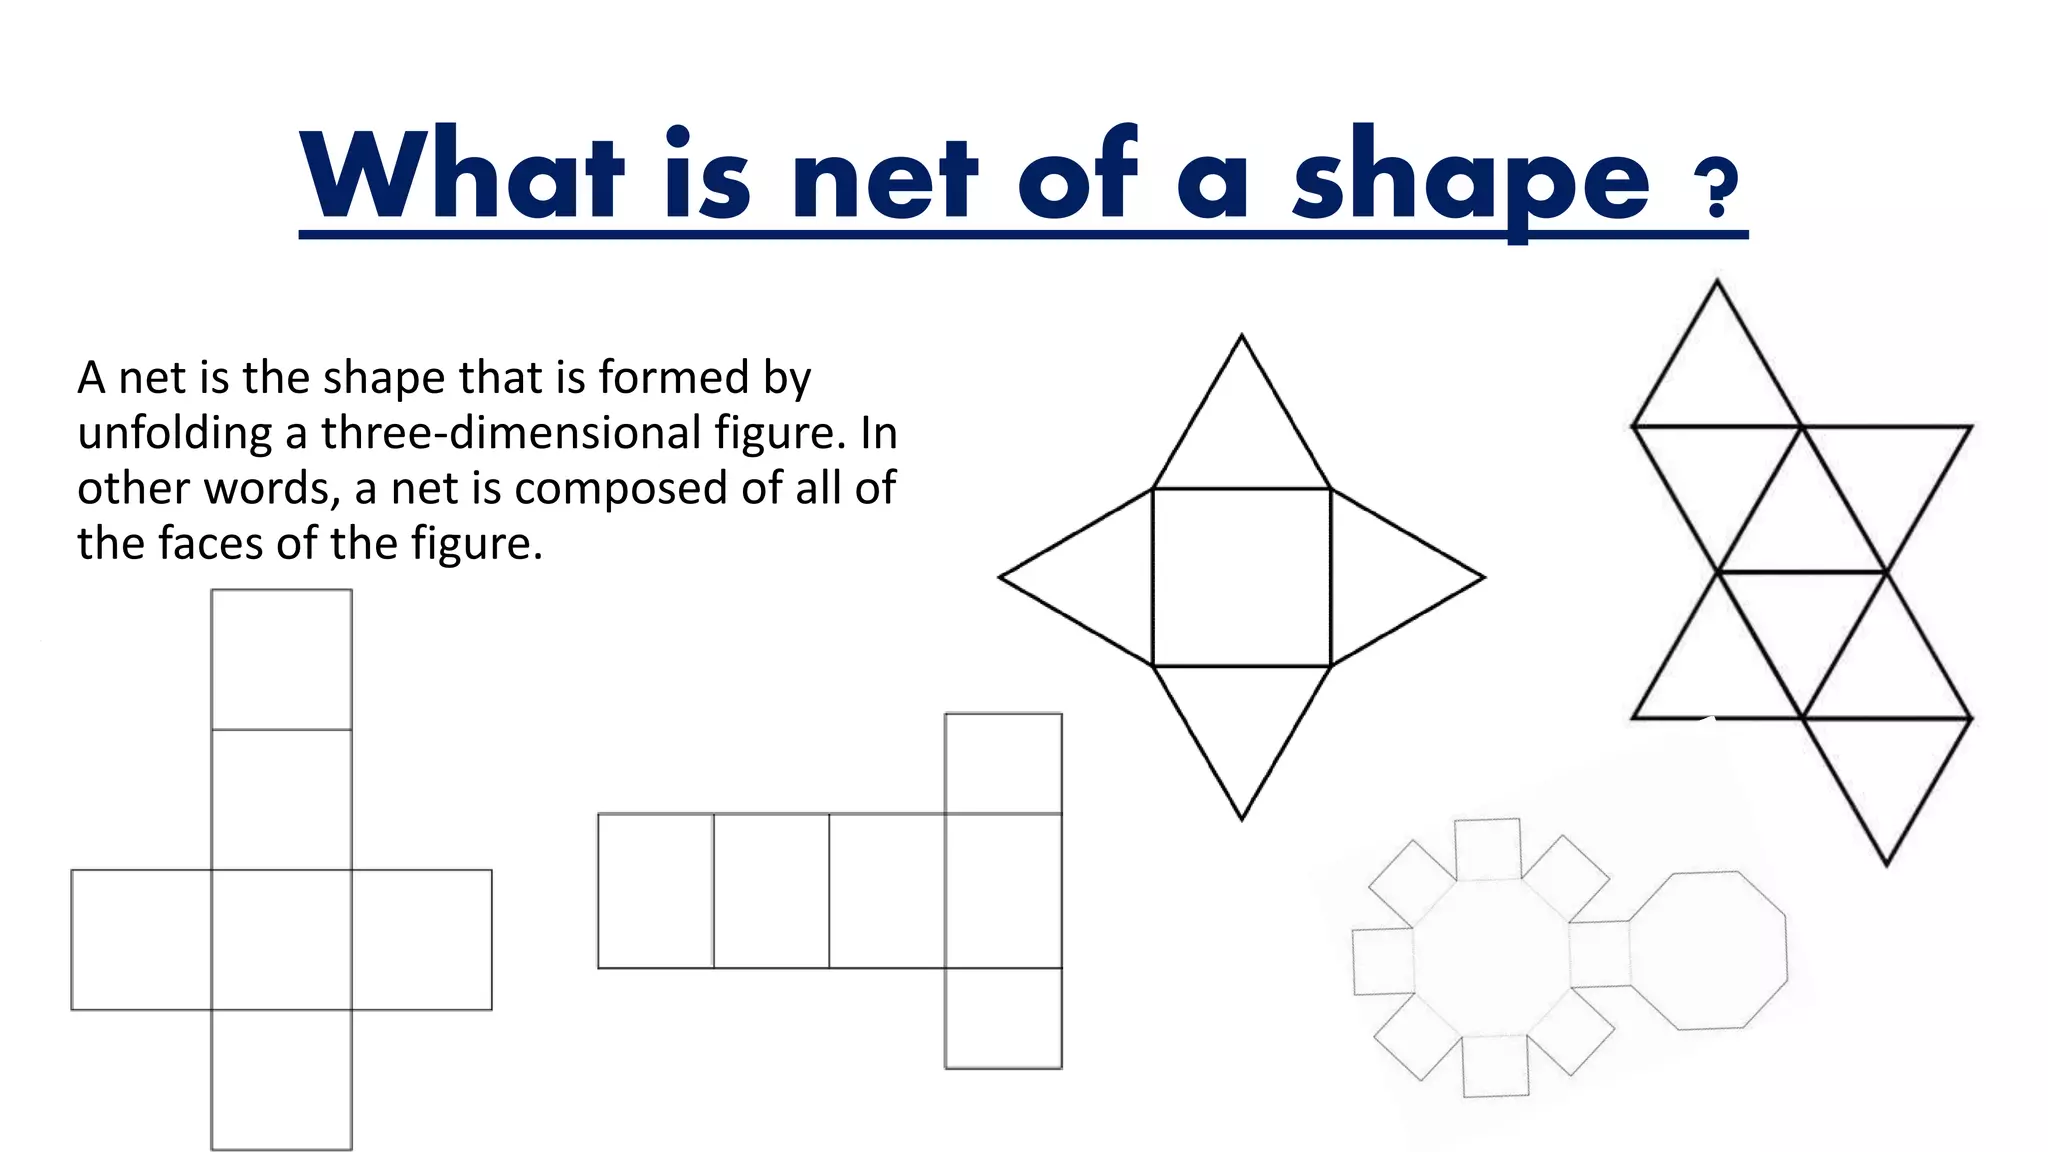
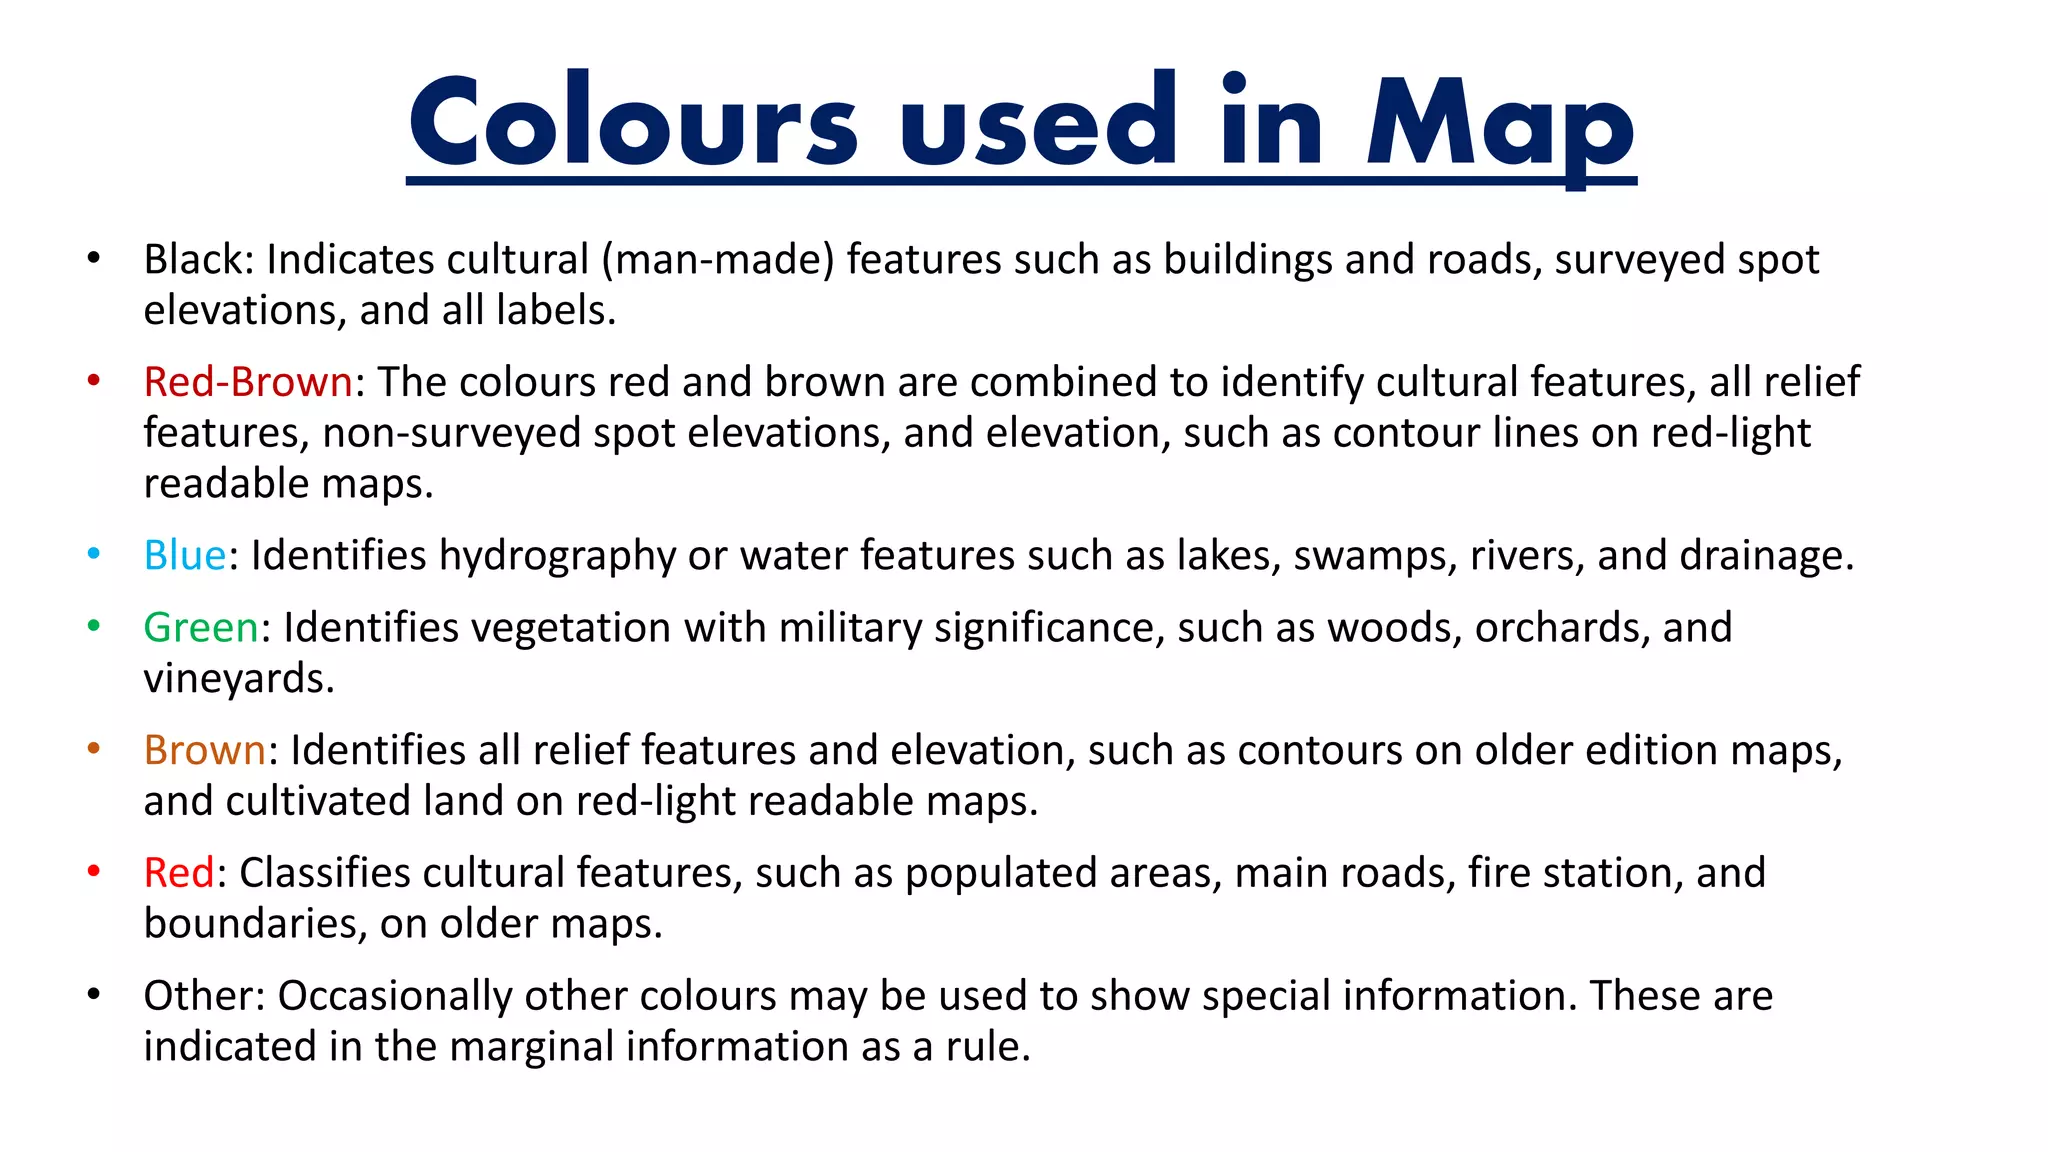
Visualizing Solid Shapes
Fa – 4 Math's Individual activity
Done By : AADHAVAN 8B
Introduction
What is shape ?
The external form or appearance characteristic of something is known as
shape. There are two types of shapes :
2D 3D
Properties Of 3 Dimensional
Shapes
Three-dimensional shapes have four properties that
set them apart from two-dimensional shapes: faces,
vertices, edges and volume. These properties not only
allow you to determine whether the shape is two- or
three-dimensional, but also which three-dimensional
shape it is.
Face
• The part of the shape
that is flat or curved.
• Eg : Cube has six faces
Edge
• The part of the shape
where two faces meet
• Eg : Cube has twelve
edges
Vertex
• The part of the shape
where three or four
edges meet
• Eg : Pyramid has four
edges
What is net of a shape ?
A net is the shape that is formed by
unfolding a three-dimensional figure. In
other words, a net is composed of all of
the faces of the figure.
Platonic
Solid
Picture
Number
of Faces
Shape of
Faces
Number
of Faces
at Each
Vertex
Number
of
Vertices
Number
of Edges
Unfolded
Polyhedron (Net)
Tetrahedron 4
Equilateral
Triangle
(3-sided)
3 4 6
Cube 6
Square
(4-sided)
3 8 12
Octahedron 8
Equilateral
Triangle
(3-sided)
4 6 12
Dodecahedron 12
Regular
Pentagon
(5-sided)
3 20 30
Icosahedron 20
Equilateral
Triangle
(3-sided)
5 12 30
Polyhedrons
A polyhedron is a solid shape bounded by polygons whereas non-polyhedrons do not
have polygon shaped faces. Cubes, cuboids, prisms, and pyramids are few examples of
polyhedrons. Spheres, cones and cylinders are a few examples of non-polyhedrons.
Polyhedrons Non-polyhedrons
What is a Map ?
• A map is a graphic representation of a portion of
the earth's surface drawn to scale, as seen from
above.
• It uses colors, symbols, scales and labels to
represent features found on the ground.
Colours used in Map
• Black: Indicates cultural (man-made) features such as buildings and roads, surveyed spot
elevations, and all labels.
• Red-Brown: The colours red and brown are combined to identify cultural features, all relief
features, non-surveyed spot elevations, and elevation, such as contour lines on red-light
readable maps.
• Blue: Identifies hydrography or water features such as lakes, swamps, rivers, and drainage.
• Green: Identifies vegetation with military significance, such as woods, orchards, and
vineyards.
• Brown: Identifies all relief features and elevation, such as contours on older edition maps,
and cultivated land on red-light readable maps.
• Red: Classifies cultural features, such as populated areas, main roads, fire station, and
boundaries, on older maps.
• Other: Occasionally other colours may be used to show special information. These are
indicated in the marginal information as a rule.
Scales used in Maps
• A map is a scaled graphic representation of a portion of the earth's
surface.
• The scale of the map permits the user to convert distance on the map
to distance on the ground or vice versa.
• The ability to determine distance on a map, as well as on the earth's
surface, is an important factor in planning and executing military
missions.
• Distances Shown on the map are proportional to
the actual distance on the ground.
• While drawing a map, we should take care about:
How much of actual distance is denoted by :
1mm or 1cm in the map
• It can be : 1cm = 1 Kilometres or 10 Km or 100Km
etc.
• This scale can vary from map to map but not with
in the map.
VISUALISING  SOLID SHAPES

VISUALISING SOLID SHAPES

  • 1.
    Visualizing Solid Shapes Fa– 4 Math's Individual activity Done By : AADHAVAN 8B
  • 2.
    Introduction What is shape? The external form or appearance characteristic of something is known as shape. There are two types of shapes : 2D 3D
  • 3.
    Properties Of 3Dimensional Shapes Three-dimensional shapes have four properties that set them apart from two-dimensional shapes: faces, vertices, edges and volume. These properties not only allow you to determine whether the shape is two- or three-dimensional, but also which three-dimensional shape it is.
  • 4.
    Face • The partof the shape that is flat or curved. • Eg : Cube has six faces
  • 5.
    Edge • The partof the shape where two faces meet • Eg : Cube has twelve edges
  • 6.
    Vertex • The partof the shape where three or four edges meet • Eg : Pyramid has four edges
  • 7.
    What is netof a shape ? A net is the shape that is formed by unfolding a three-dimensional figure. In other words, a net is composed of all of the faces of the figure.
  • 8.
    Platonic Solid Picture Number of Faces Shape of Faces Number ofFaces at Each Vertex Number of Vertices Number of Edges Unfolded Polyhedron (Net) Tetrahedron 4 Equilateral Triangle (3-sided) 3 4 6 Cube 6 Square (4-sided) 3 8 12 Octahedron 8 Equilateral Triangle (3-sided) 4 6 12 Dodecahedron 12 Regular Pentagon (5-sided) 3 20 30 Icosahedron 20 Equilateral Triangle (3-sided) 5 12 30
  • 9.
    Polyhedrons A polyhedron isa solid shape bounded by polygons whereas non-polyhedrons do not have polygon shaped faces. Cubes, cuboids, prisms, and pyramids are few examples of polyhedrons. Spheres, cones and cylinders are a few examples of non-polyhedrons. Polyhedrons Non-polyhedrons
  • 10.
    What is aMap ? • A map is a graphic representation of a portion of the earth's surface drawn to scale, as seen from above. • It uses colors, symbols, scales and labels to represent features found on the ground.
  • 11.
    Colours used inMap • Black: Indicates cultural (man-made) features such as buildings and roads, surveyed spot elevations, and all labels. • Red-Brown: The colours red and brown are combined to identify cultural features, all relief features, non-surveyed spot elevations, and elevation, such as contour lines on red-light readable maps. • Blue: Identifies hydrography or water features such as lakes, swamps, rivers, and drainage. • Green: Identifies vegetation with military significance, such as woods, orchards, and vineyards. • Brown: Identifies all relief features and elevation, such as contours on older edition maps, and cultivated land on red-light readable maps. • Red: Classifies cultural features, such as populated areas, main roads, fire station, and boundaries, on older maps. • Other: Occasionally other colours may be used to show special information. These are indicated in the marginal information as a rule.
  • 12.
    Scales used inMaps • A map is a scaled graphic representation of a portion of the earth's surface. • The scale of the map permits the user to convert distance on the map to distance on the ground or vice versa. • The ability to determine distance on a map, as well as on the earth's surface, is an important factor in planning and executing military missions.
  • 13.
    • Distances Shownon the map are proportional to the actual distance on the ground. • While drawing a map, we should take care about: How much of actual distance is denoted by : 1mm or 1cm in the map • It can be : 1cm = 1 Kilometres or 10 Km or 100Km etc. • This scale can vary from map to map but not with in the map.