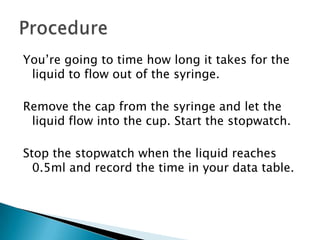
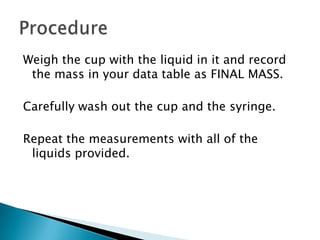
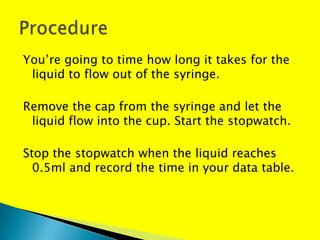
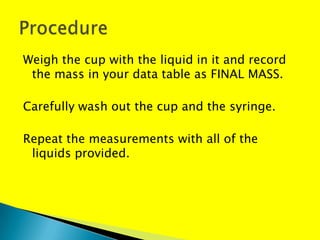
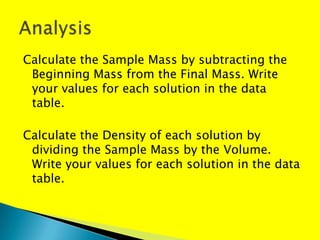
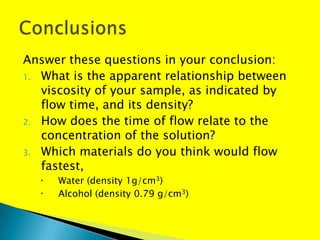
Go with the flow
   While the screen is WHITE, read and plan
   When the screen is YELLOW, do what the
    instructions tell you

   Everything will make more sense if you read
    the instructions from beginning to end before
    you start – so read wihen the screen is white.
1.   Measure the rate of flow of liquids and look
     for a relationship with concentration
2.   Measure the density of liquids and look for a
     relationship with concentration
Viscosity is defined as “the resistance to flow of
a liquid or gas”. Or, in other words, how thick
or runny it is.

A liquid with a high viscosity does not flow
easily – think of honey.
Viscosity is a physical property of a substance.

It is due to intermolecular forces – forces
  between the molecules that make the
  molecules a little bit sticky.
   Liquid samples: Water, Corn Syrup solutions
    of different concetrations
   Weighing cups
   3ml syringe and cap– PLEASE DON’T LOSE
    THIS
   Balance
   Stopwatch
REMEMBER – the screen is WHITE – you are
 reading these instructions so that you know
 the whole procedure before you start.

Do not begin until the screen turns YELLOW.
Fill the 3ml syringe with one of the liquids.
  Adjust the level of the liquid in syringe so
  that the liquid is exactly at the 3ml mark.

Place the syringe cap firmly on the syringe.
Weigh the empty cup and record the mass in
 your data table as the BEGINNING MASS.
Hold the syringe in a vertical position over the
 cup.

Remove the plunger from the syringe.
You’re going to time how long it takes for the
 liquid to flow out of the syringe.

Remove the cap from the syringe and let the
 liquid flow into the cup. Start the stopwatch.

Stop the stopwatch when the liquid reaches
  0.5ml and record the time in your data table.
Weigh the cup with the liquid in it and record
 the mass in your data table as FINAL MASS.

Carefully wash out the cup and the syringe.

Repeat the measurements with all of the
 liquids provided.
Now you know what you’re going to do, let’s
 get started.
Write a heading for the experiment

Write a sub heading: “Hypothesis”
All experiments start with a Hypothesis – a
 prediction of what will happen. It doesn’t
 have to be correct, it just has to a prediction
 that you can TEST.
A simple hypothesis is often written like this:
 “If …. then ….”

For example: “If the sky is blue, then it is not
 raining”.
That is a hypothesis that you could test by
 recording whether or not it is raining when
 the sky is blue.
How do you think the density of liquids and
 their viscosities will change if you increase
 their concentration?

Write your hypothesis:
“If the concentration of the solution increases,
  then the density of the solution will _________
  and the viscosity of the solution will
  ___________.”
You need to set up a data table in which to
 record your results. Write a heading, “Results”
 and copy this data table beneath it.
   Sample        Time Volum Beginnin    Final   Sample     Density
                 (secs) e (ml) g mass   Mass    mass (g)   (g/ml)
                                 (g)     (g)
0% corn syrup
(water)
20% corn syrup
33% corn syrup
50% corn syrup
75% corn syrup
100% corn
syrup
Fill the 3ml syringe with one of the liquids.
  Adjust the level of the liquid in syringe so
  that the liquid is exactly at the 3ml mark.

Place the syringe cap firmly on the syringe.
Weigh the empty cup and record the mass in
 your data table as the BEGINNING MASS.
Hold the syringe in a vertical position over the
 cup.

Remove the plunger from the syringe.
You’re going to time how long it takes for the
 liquid to flow out of the syringe.

Remove the cap from the syringe and let the
 liquid flow into the cup. Start the stopwatch.

Stop the stopwatch when the liquid reaches
  0.5ml and record the time in your data table.
Weigh the cup with the liquid in it and record
 the mass in your data table as FINAL MASS.

Carefully wash out the cup and the syringe.

Repeat the measurements with all of the
 liquids provided.
Calculate the Sample Mass by subtracting the
 Beginning Mass from the Final Mass. Write
 your values for each solution in the data
 table.

Calculate the Density of each solution by
 dividing the Sample Mass by the Volume.
 Write your values for each solution in the data
 table.
Plot a graph of Time against Concentration.

The Independent Variable goes on the x-axis.
 Which value did you change or choose?

The Dependent Variable goes on the y-axis.
 Which value did you measure?
Plot a graph of Time against Density.

Plot Time on the Y-axis and Density on the X-
  axis.
Look at your graphs. Look back at your
 Hypothesis.

Was your prediction correct?

Write the heading “Conclusions” and write a
 sentence commenting on your prediction now
 that you’ve done your experiment.
Answer these questions in your conclusion:
1. What is the apparent relationship between
   viscosity of your sample, as indicated by
   flow time, and its density?
2. How does the time of flow relate to the
   concentration of the solution?
3. Which materials do you think would flow
   fastest,
     Water (density 1g/cm3)
     Alcohol (density 0.79 g/cm3)
Congratuations.

Viscosity and density lab

  • 1.
  • 2.
    While the screen is WHITE, read and plan  When the screen is YELLOW, do what the instructions tell you  Everything will make more sense if you read the instructions from beginning to end before you start – so read wihen the screen is white.
  • 3.
    1. Measure the rate of flow of liquids and look for a relationship with concentration 2. Measure the density of liquids and look for a relationship with concentration
  • 4.
    Viscosity is definedas “the resistance to flow of a liquid or gas”. Or, in other words, how thick or runny it is. A liquid with a high viscosity does not flow easily – think of honey.
  • 5.
    Viscosity is aphysical property of a substance. It is due to intermolecular forces – forces between the molecules that make the molecules a little bit sticky.
  • 6.
    Liquid samples: Water, Corn Syrup solutions of different concetrations  Weighing cups  3ml syringe and cap– PLEASE DON’T LOSE THIS  Balance  Stopwatch
  • 7.
    REMEMBER – thescreen is WHITE – you are reading these instructions so that you know the whole procedure before you start. Do not begin until the screen turns YELLOW.
  • 8.
    Fill the 3mlsyringe with one of the liquids. Adjust the level of the liquid in syringe so that the liquid is exactly at the 3ml mark. Place the syringe cap firmly on the syringe.
  • 9.
    Weigh the emptycup and record the mass in your data table as the BEGINNING MASS.
  • 10.
    Hold the syringein a vertical position over the cup. Remove the plunger from the syringe.
  • 11.
    You’re going totime how long it takes for the liquid to flow out of the syringe. Remove the cap from the syringe and let the liquid flow into the cup. Start the stopwatch. Stop the stopwatch when the liquid reaches 0.5ml and record the time in your data table.
  • 12.
    Weigh the cupwith the liquid in it and record the mass in your data table as FINAL MASS. Carefully wash out the cup and the syringe. Repeat the measurements with all of the liquids provided.
  • 13.
    Now you knowwhat you’re going to do, let’s get started.
  • 14.
    Write a headingfor the experiment Write a sub heading: “Hypothesis” All experiments start with a Hypothesis – a prediction of what will happen. It doesn’t have to be correct, it just has to a prediction that you can TEST.
  • 15.
    A simple hypothesisis often written like this: “If …. then ….” For example: “If the sky is blue, then it is not raining”. That is a hypothesis that you could test by recording whether or not it is raining when the sky is blue.
  • 16.
    How do youthink the density of liquids and their viscosities will change if you increase their concentration? Write your hypothesis: “If the concentration of the solution increases, then the density of the solution will _________ and the viscosity of the solution will ___________.”
  • 17.
    You need toset up a data table in which to record your results. Write a heading, “Results” and copy this data table beneath it. Sample Time Volum Beginnin Final Sample Density (secs) e (ml) g mass Mass mass (g) (g/ml) (g) (g) 0% corn syrup (water) 20% corn syrup 33% corn syrup 50% corn syrup 75% corn syrup 100% corn syrup
  • 18.
    Fill the 3mlsyringe with one of the liquids. Adjust the level of the liquid in syringe so that the liquid is exactly at the 3ml mark. Place the syringe cap firmly on the syringe.
  • 19.
    Weigh the emptycup and record the mass in your data table as the BEGINNING MASS.
  • 20.
    Hold the syringein a vertical position over the cup. Remove the plunger from the syringe.
  • 21.
    You’re going totime how long it takes for the liquid to flow out of the syringe. Remove the cap from the syringe and let the liquid flow into the cup. Start the stopwatch. Stop the stopwatch when the liquid reaches 0.5ml and record the time in your data table.
  • 22.
    Weigh the cupwith the liquid in it and record the mass in your data table as FINAL MASS. Carefully wash out the cup and the syringe. Repeat the measurements with all of the liquids provided.
  • 23.
    Calculate the SampleMass by subtracting the Beginning Mass from the Final Mass. Write your values for each solution in the data table. Calculate the Density of each solution by dividing the Sample Mass by the Volume. Write your values for each solution in the data table.
  • 24.
    Plot a graphof Time against Concentration. The Independent Variable goes on the x-axis. Which value did you change or choose? The Dependent Variable goes on the y-axis. Which value did you measure?
  • 25.
    Plot a graphof Time against Density. Plot Time on the Y-axis and Density on the X- axis.
  • 26.
    Look at yourgraphs. Look back at your Hypothesis. Was your prediction correct? Write the heading “Conclusions” and write a sentence commenting on your prediction now that you’ve done your experiment.
  • 27.
    Answer these questionsin your conclusion: 1. What is the apparent relationship between viscosity of your sample, as indicated by flow time, and its density? 2. How does the time of flow relate to the concentration of the solution? 3. Which materials do you think would flow fastest,  Water (density 1g/cm3)  Alcohol (density 0.79 g/cm3)
  • 28.