Downloaded 236 times


![EXECUTIVE SUMMARY
3
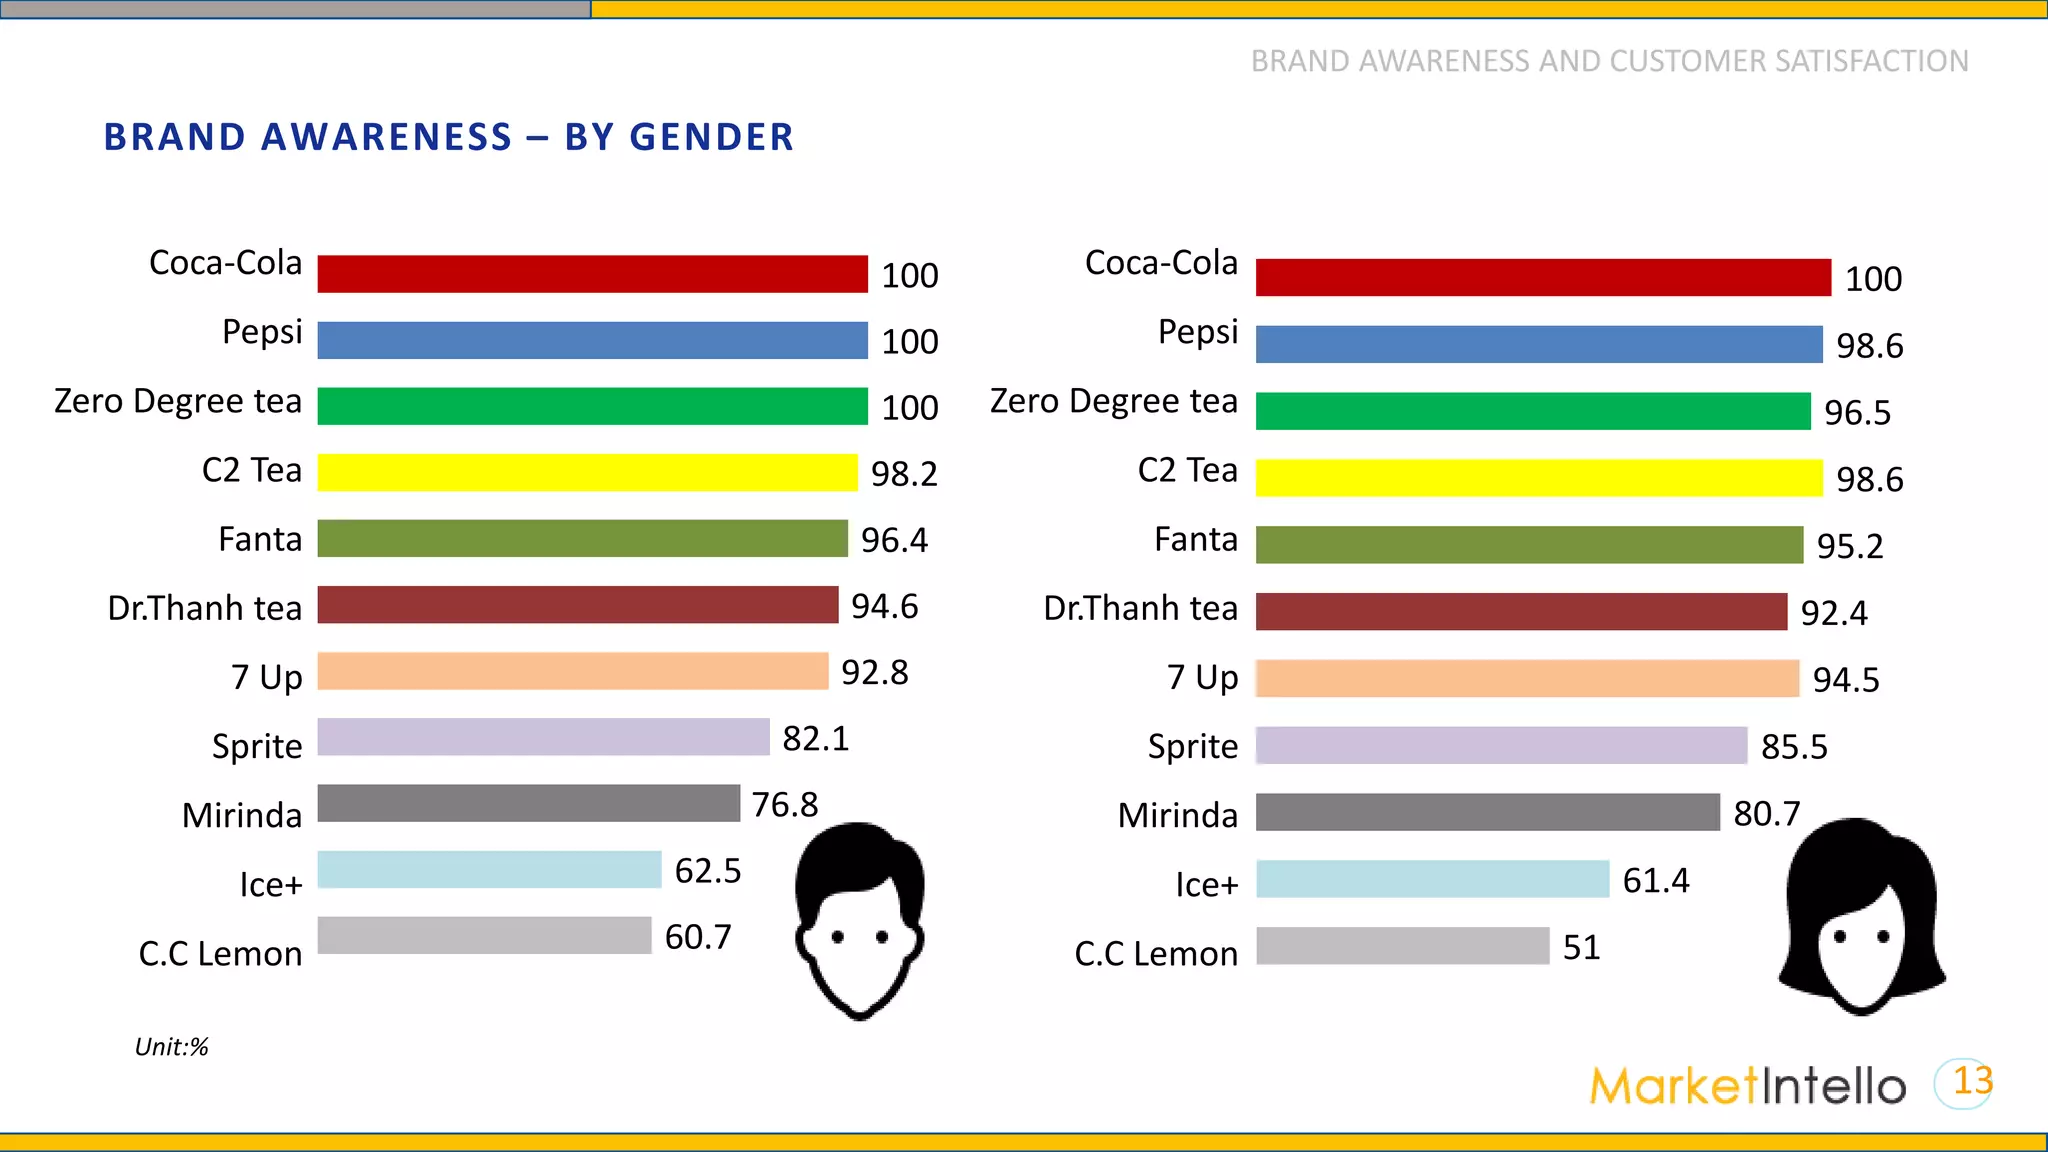
[1] Brand awareness
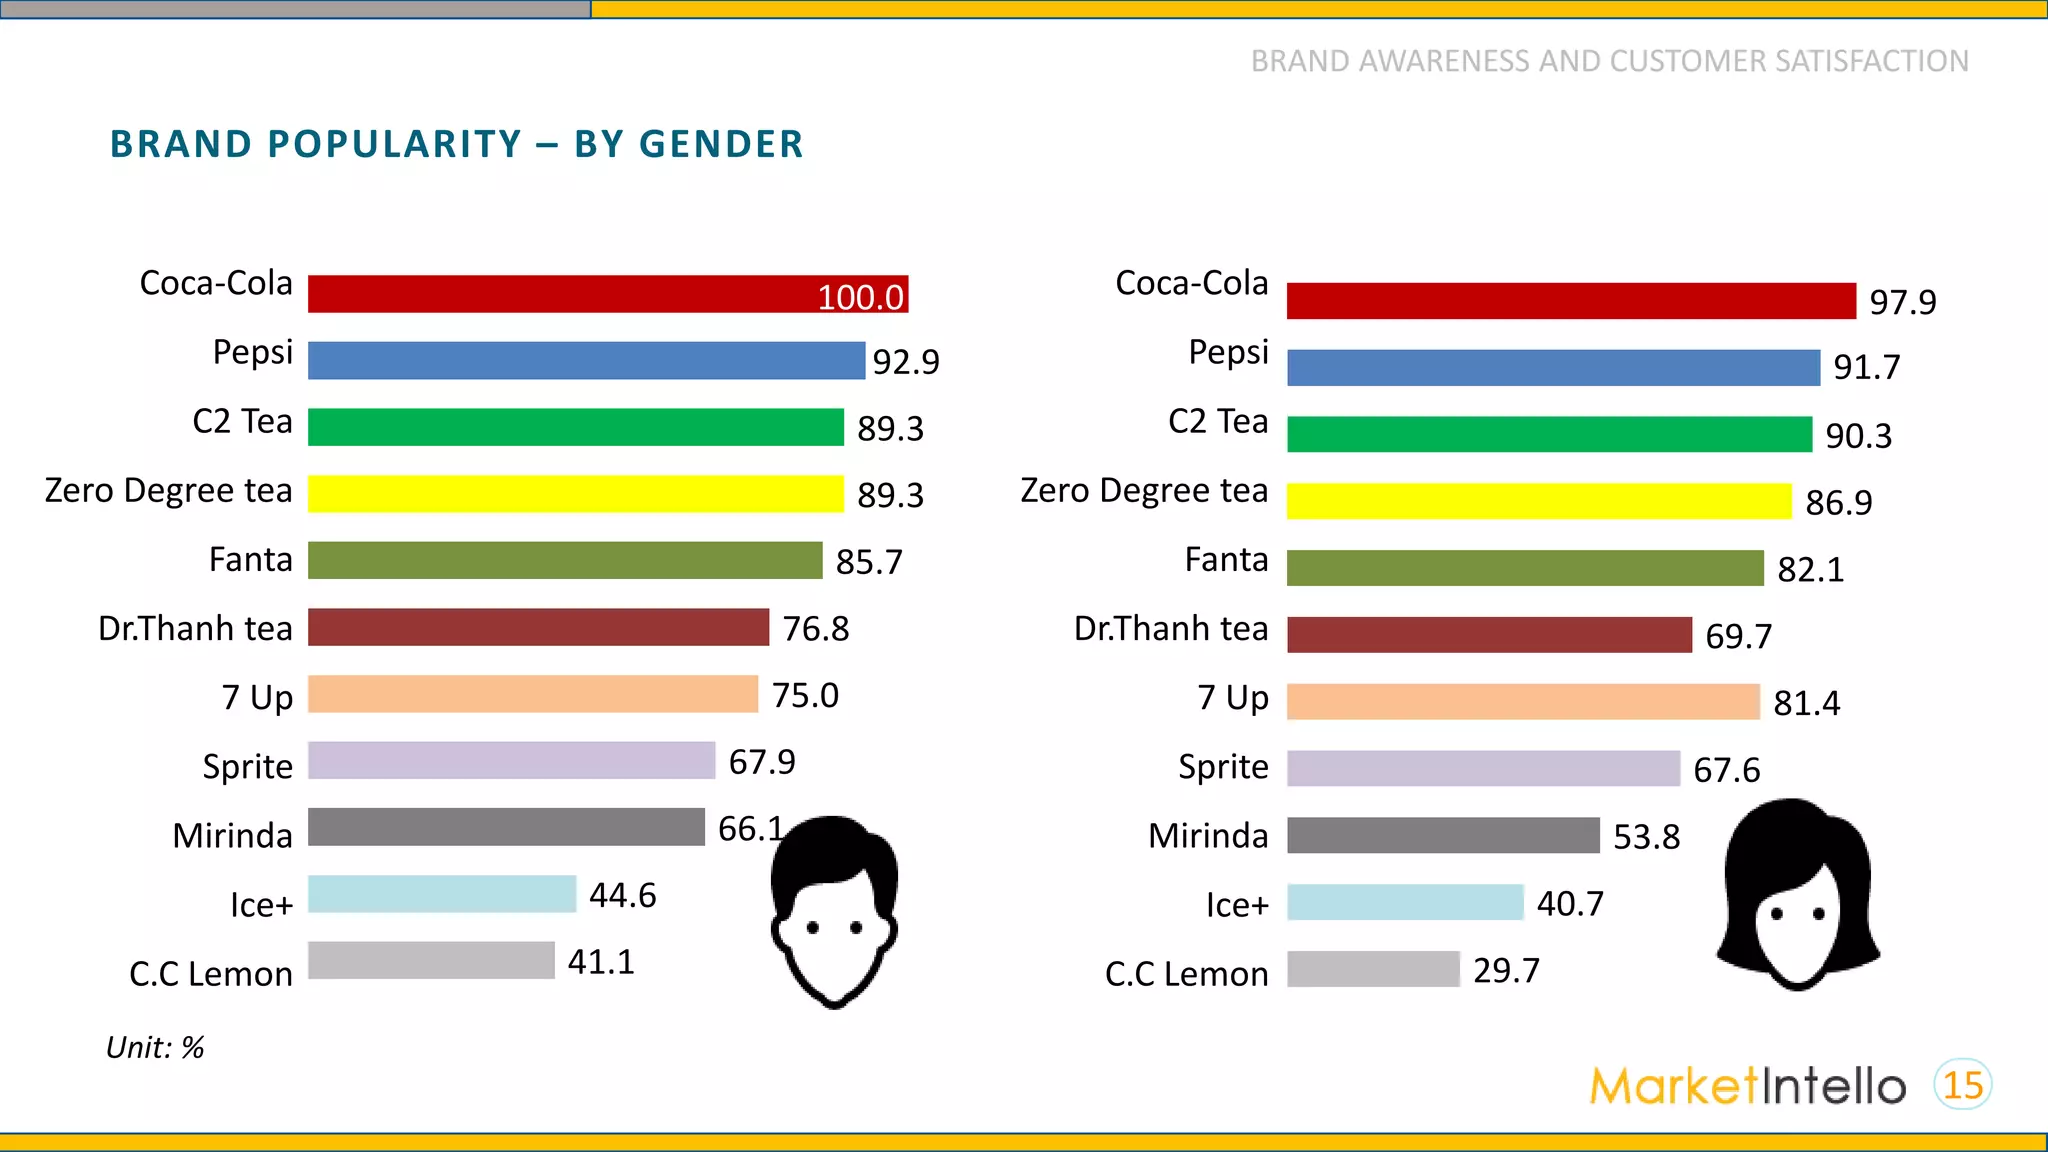
Coca-Cola is the brand with the highest level of brand awareness, followed by Pepsi
and Zero Degree Green tea.
Coca-Cola, Pepsi and C2 Green tea are three most popular brands.
Tea brands such as Zero Degree Green tea, C2 Green tea and Dr.Thanh tea have
relatively high proportions of consumers.
Coca-Cola has the highest proportion of customers using products in the last month
(34.5%), significantly higher than those of other brands.
[2] Customer satisfaction
Coca-Cola has the highest level of consumer satisfaction, followed by Pepsi
Zero Degree Green tea has the highest proportion of satisfied consumers among tea
brands](https://image.slidesharecdn.com/enreport-softdrinks-170309094558/75/Vietnam-s-soft-drink-consumer-behavior-3-2048.jpg)
![4
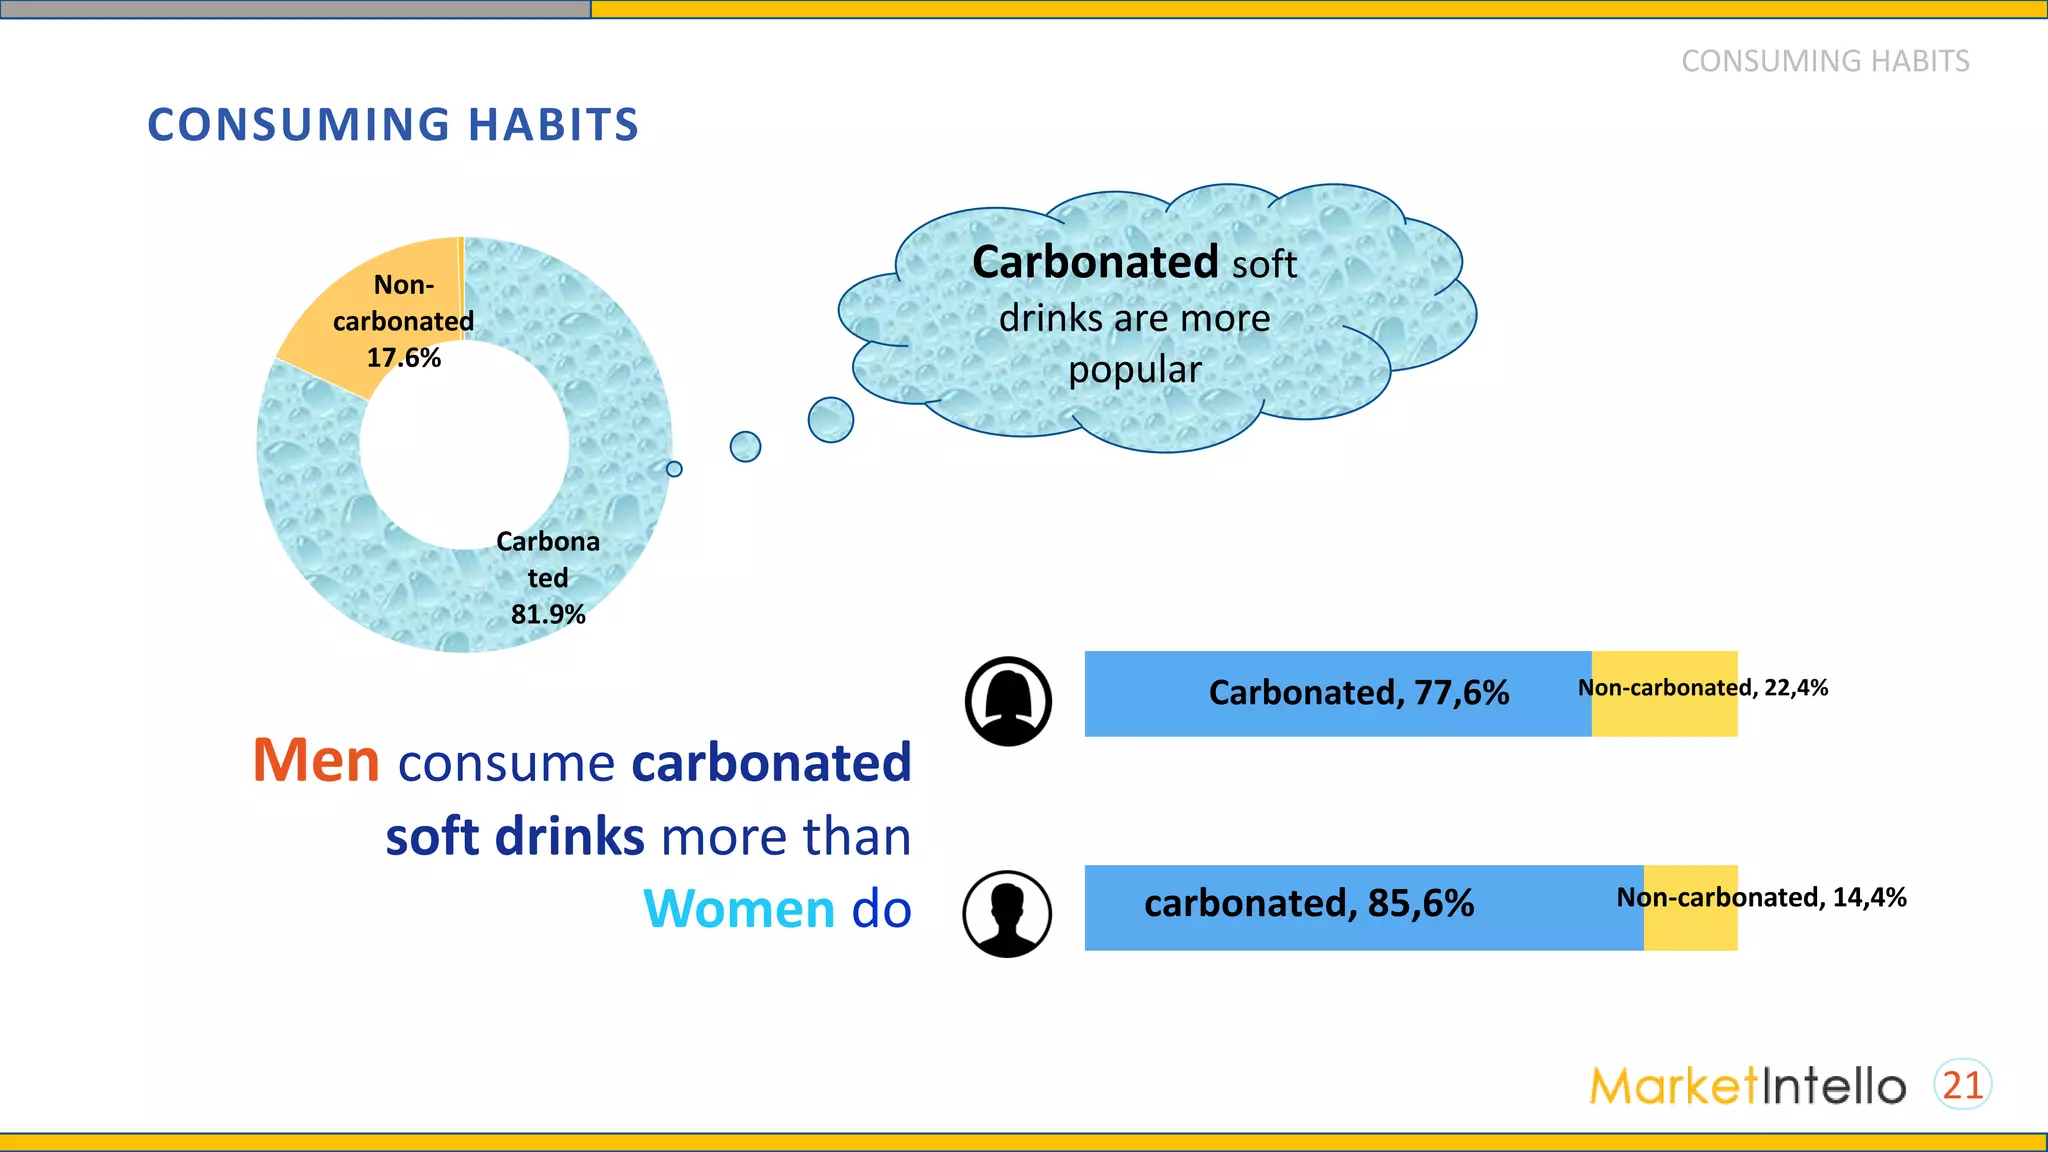
[3] Consuming habits
Almost respondents prefer carbonated soft drinks, 81.9%
Buy in single bottles is the most preferred form of purchasing, 56%
Plastic bottles packaging with the volume of 350 ml to under 1 liter is the
most pervasive, 45.2%
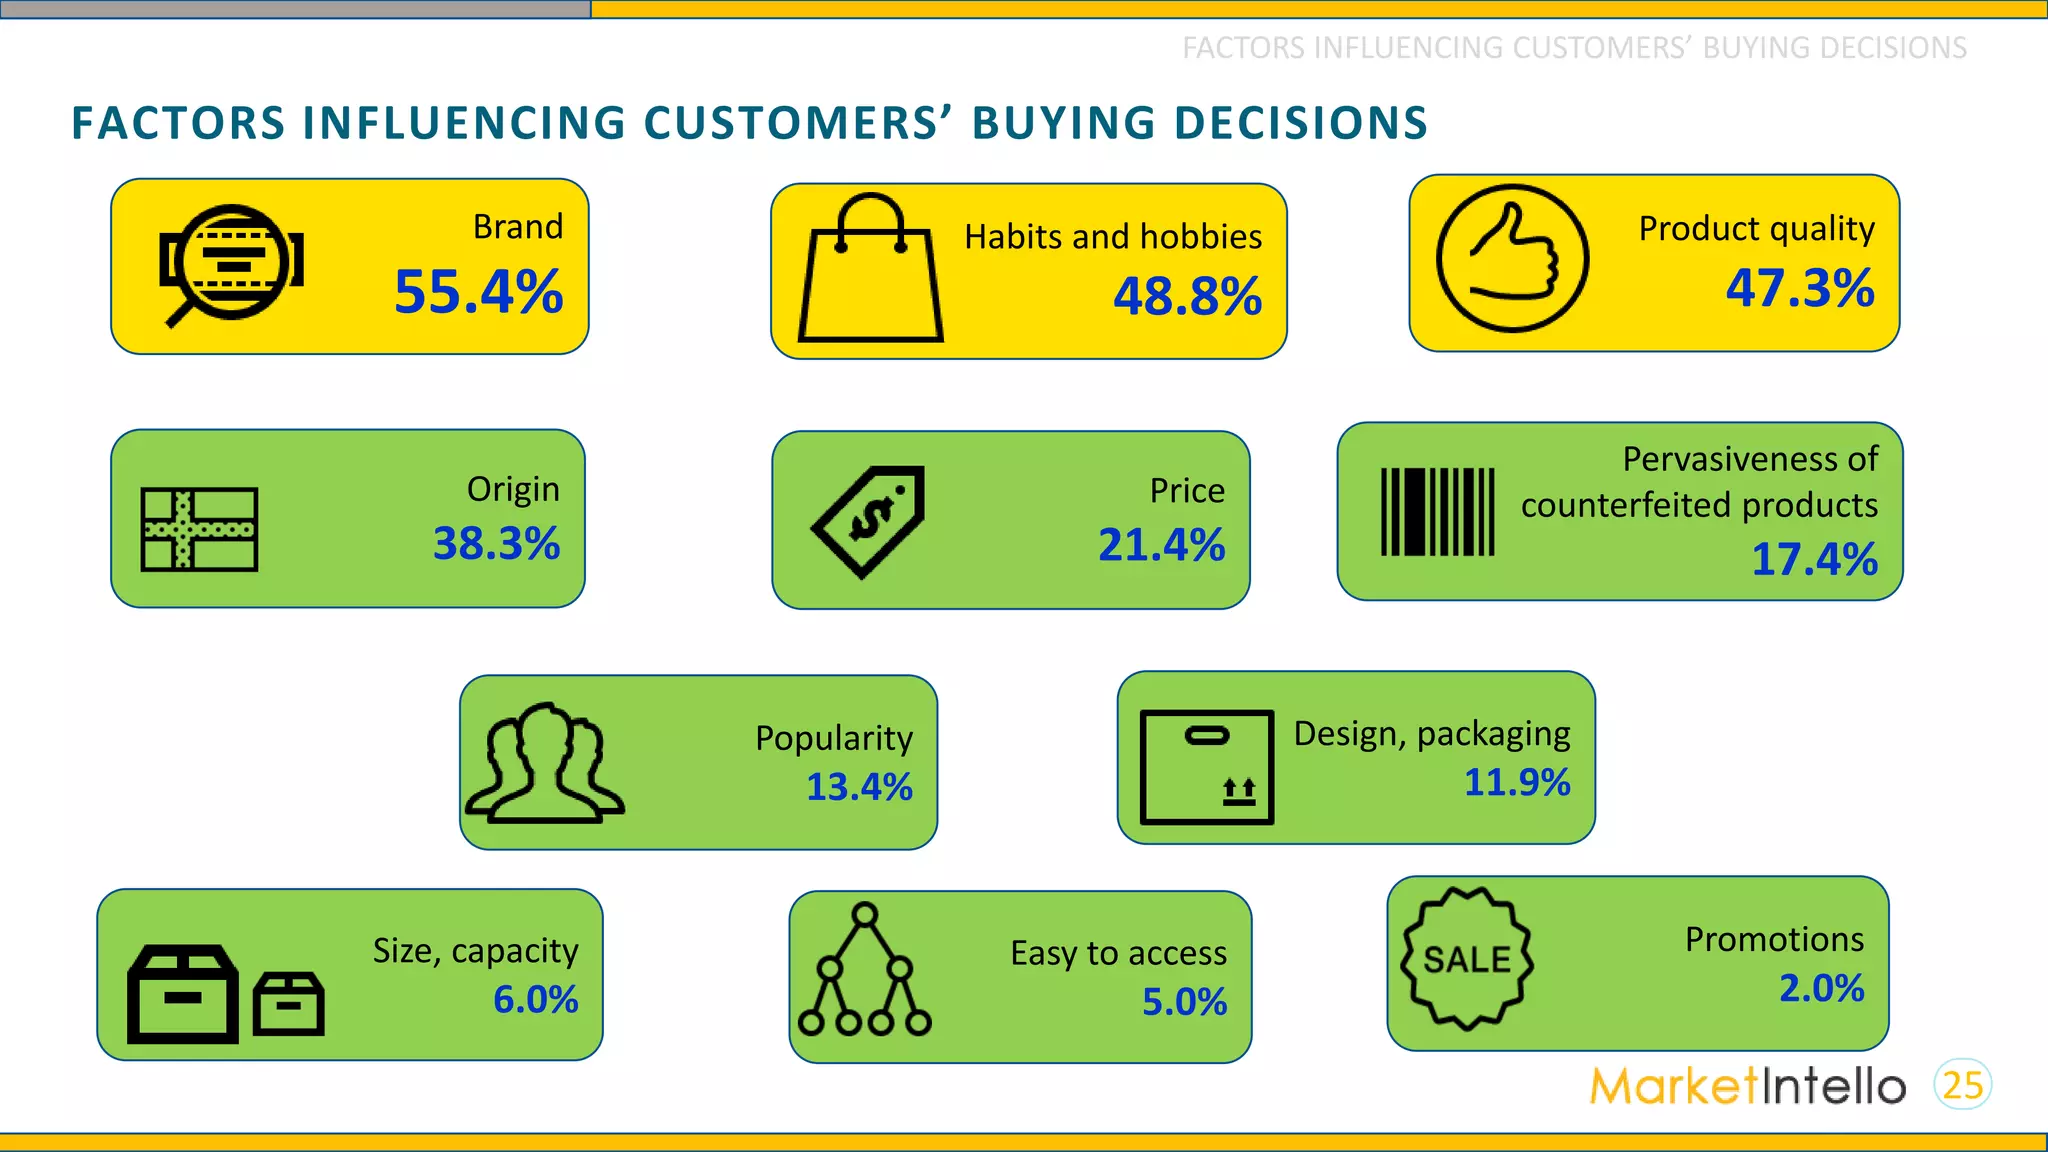
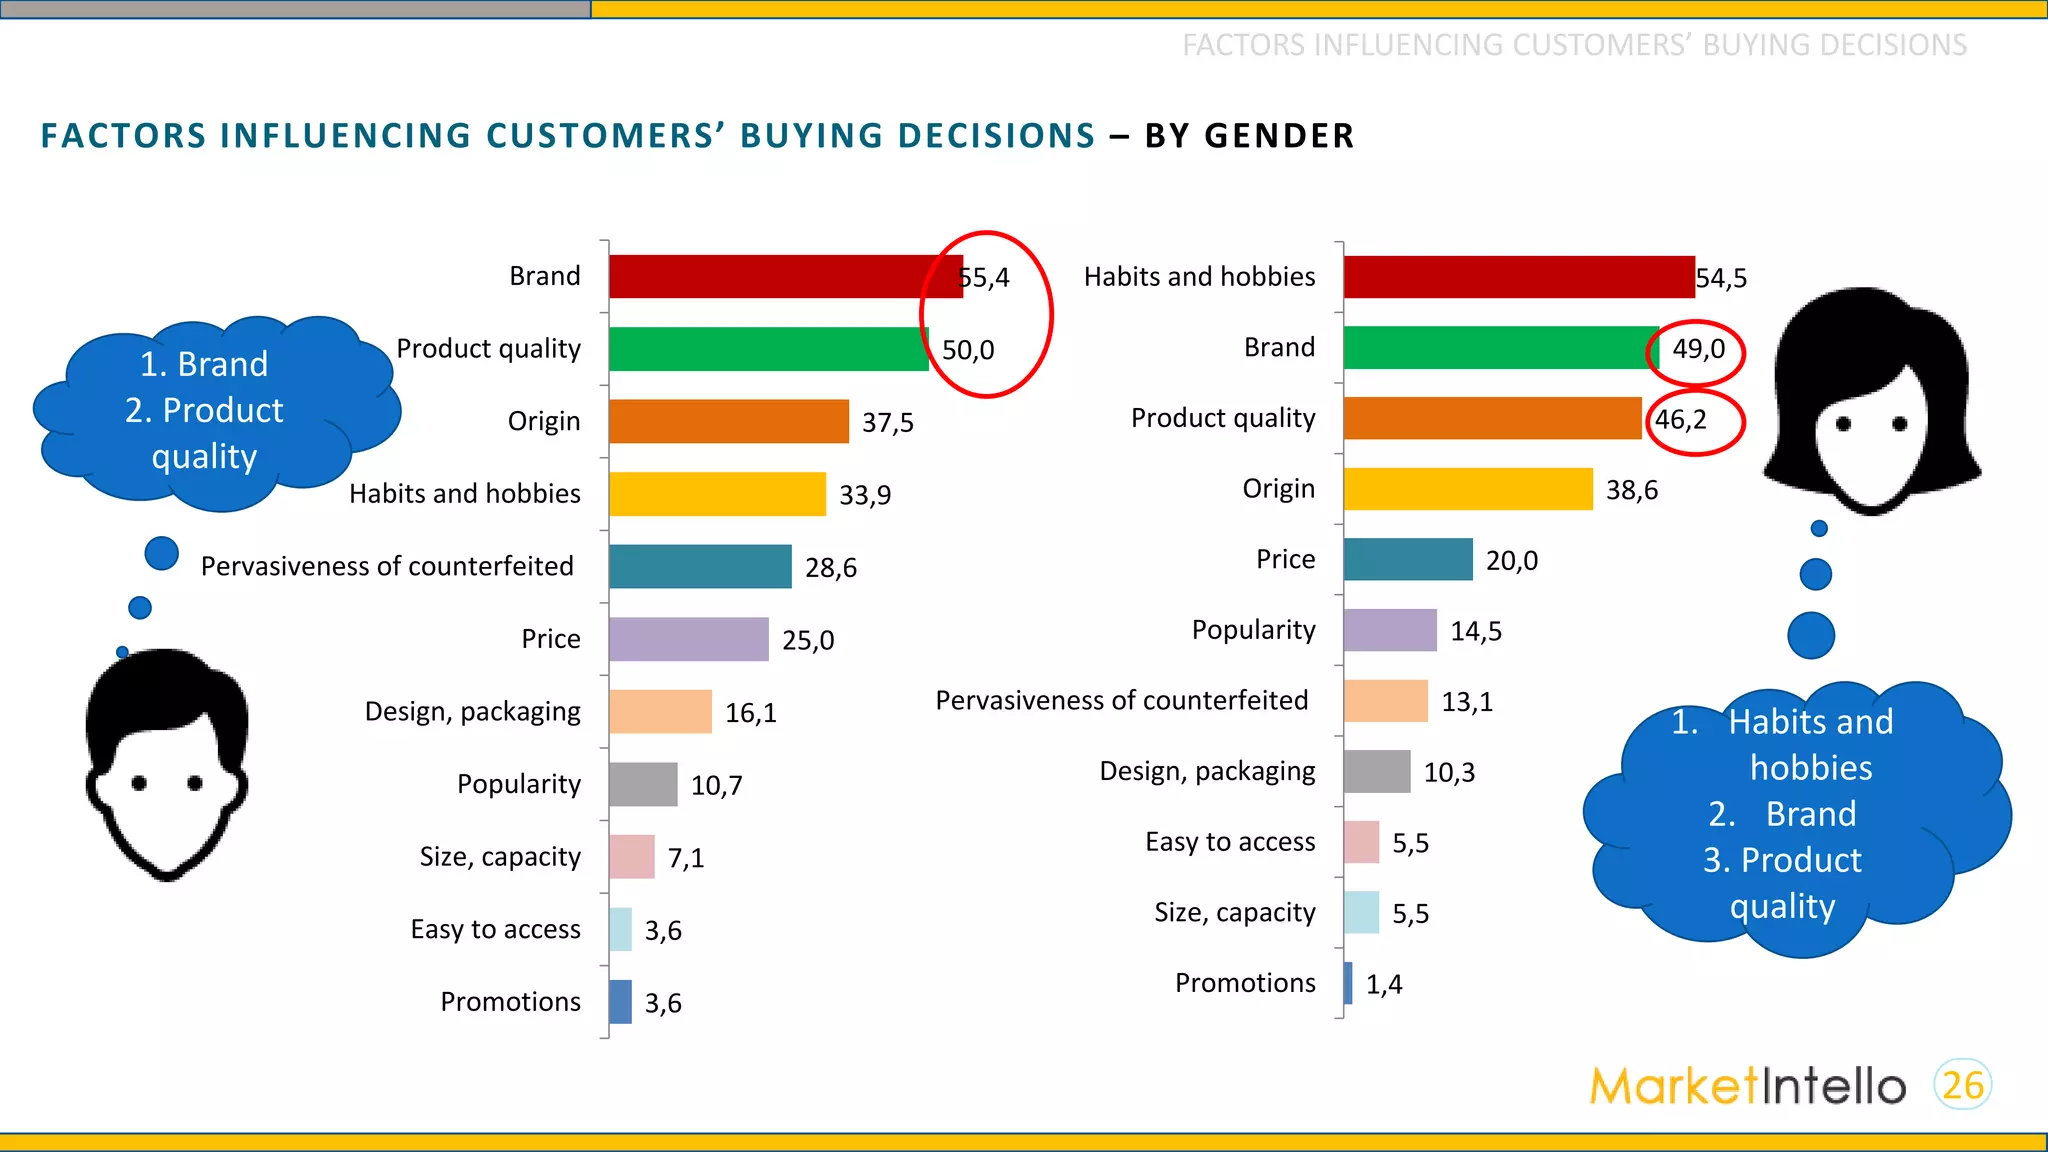
[4] Factors influencing customers’ purchase decisions
Brand, habits and hobbies and products quality mainly influence customers’
purchase decisions.
Men are mainly influenced by brand and products quality.
Women are mainly influenced by habits and hobbies.
EXECUTIVE SUMMARY](https://image.slidesharecdn.com/enreport-softdrinks-170309094558/75/Vietnam-s-soft-drink-consumer-behavior-4-2048.jpg)
![5
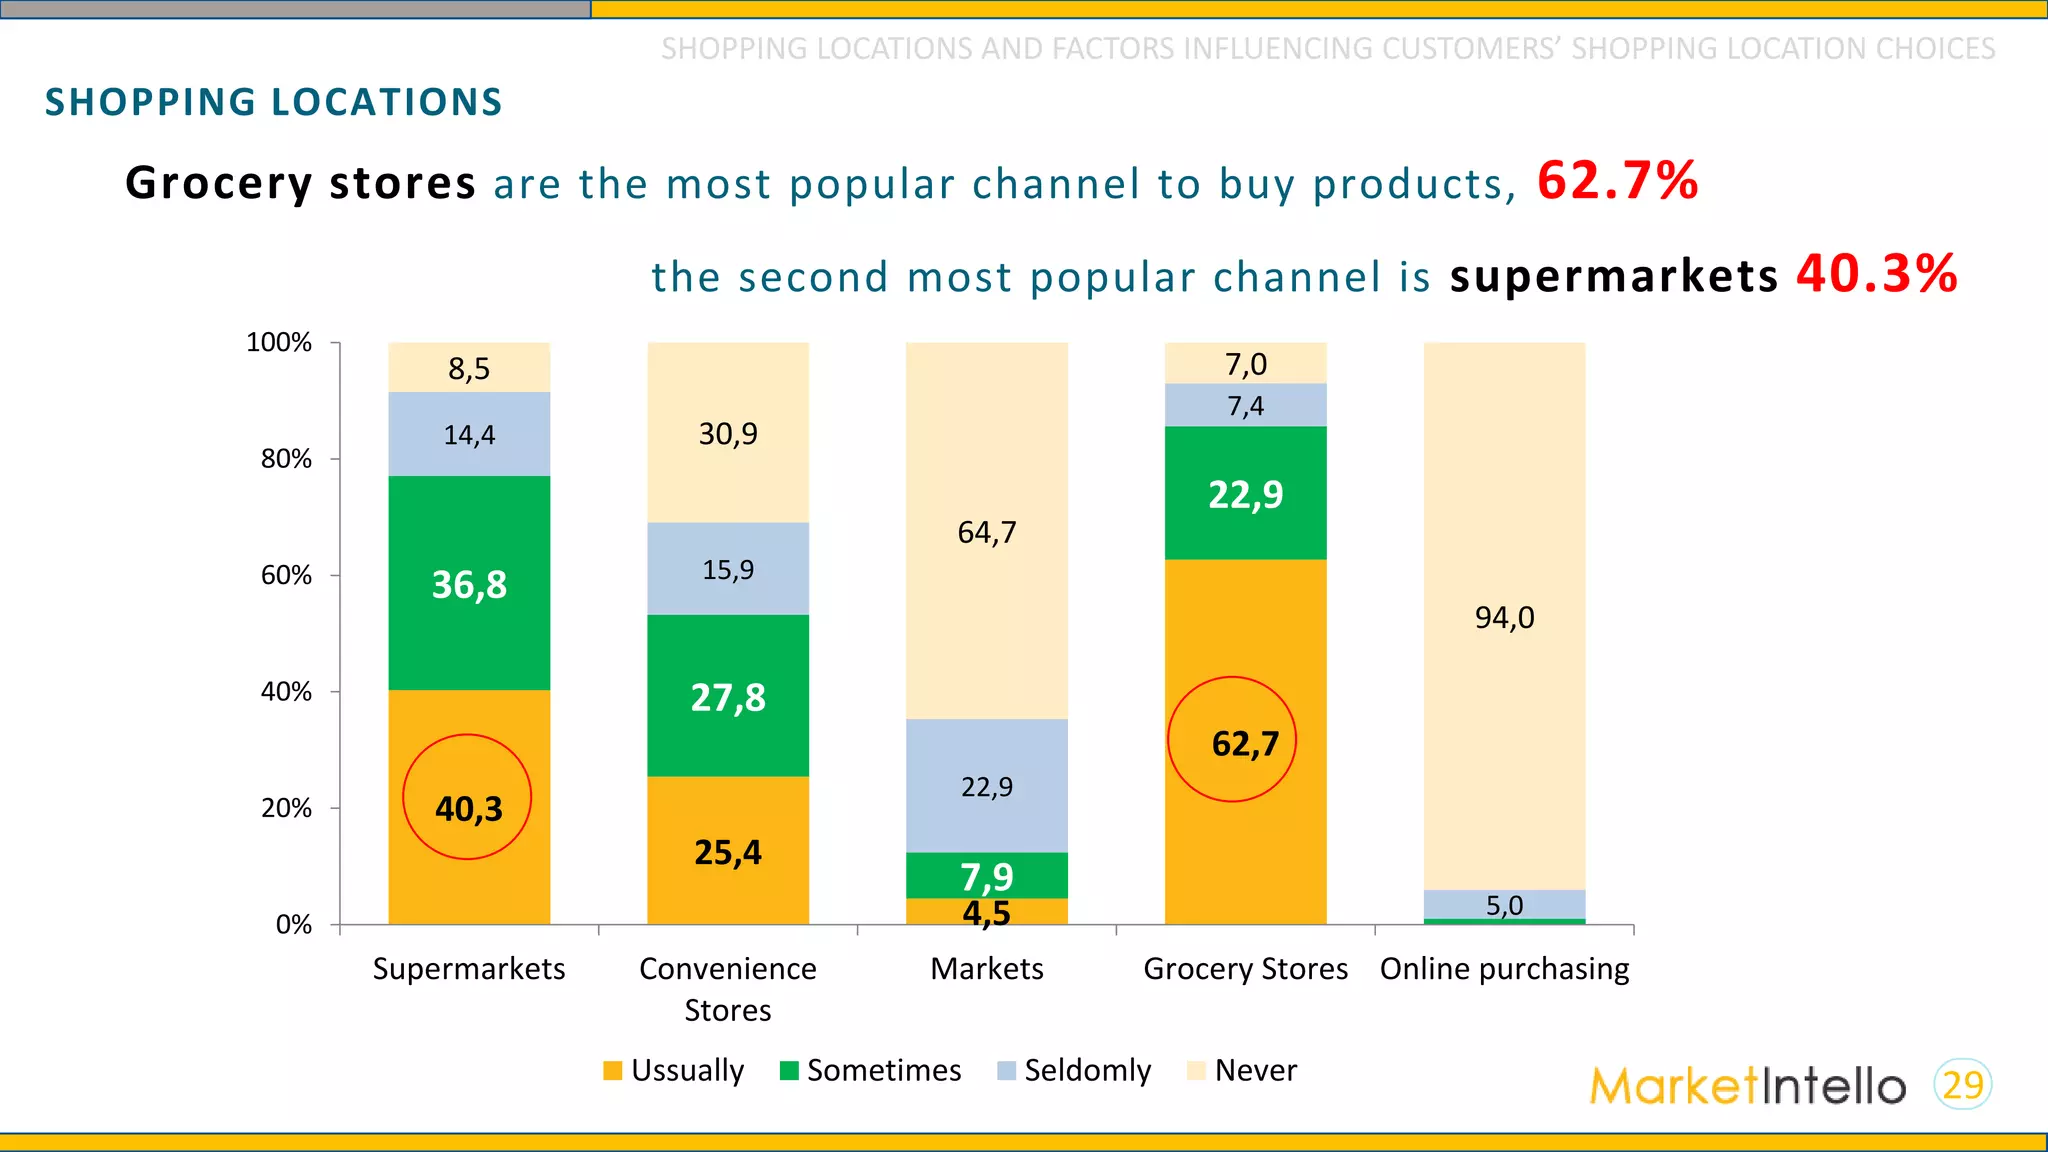
[5] Channels to access product information
Grocery stores are the most common channel to buy products (62.7%), the
second most common channel is supermarkets, (40.3%)
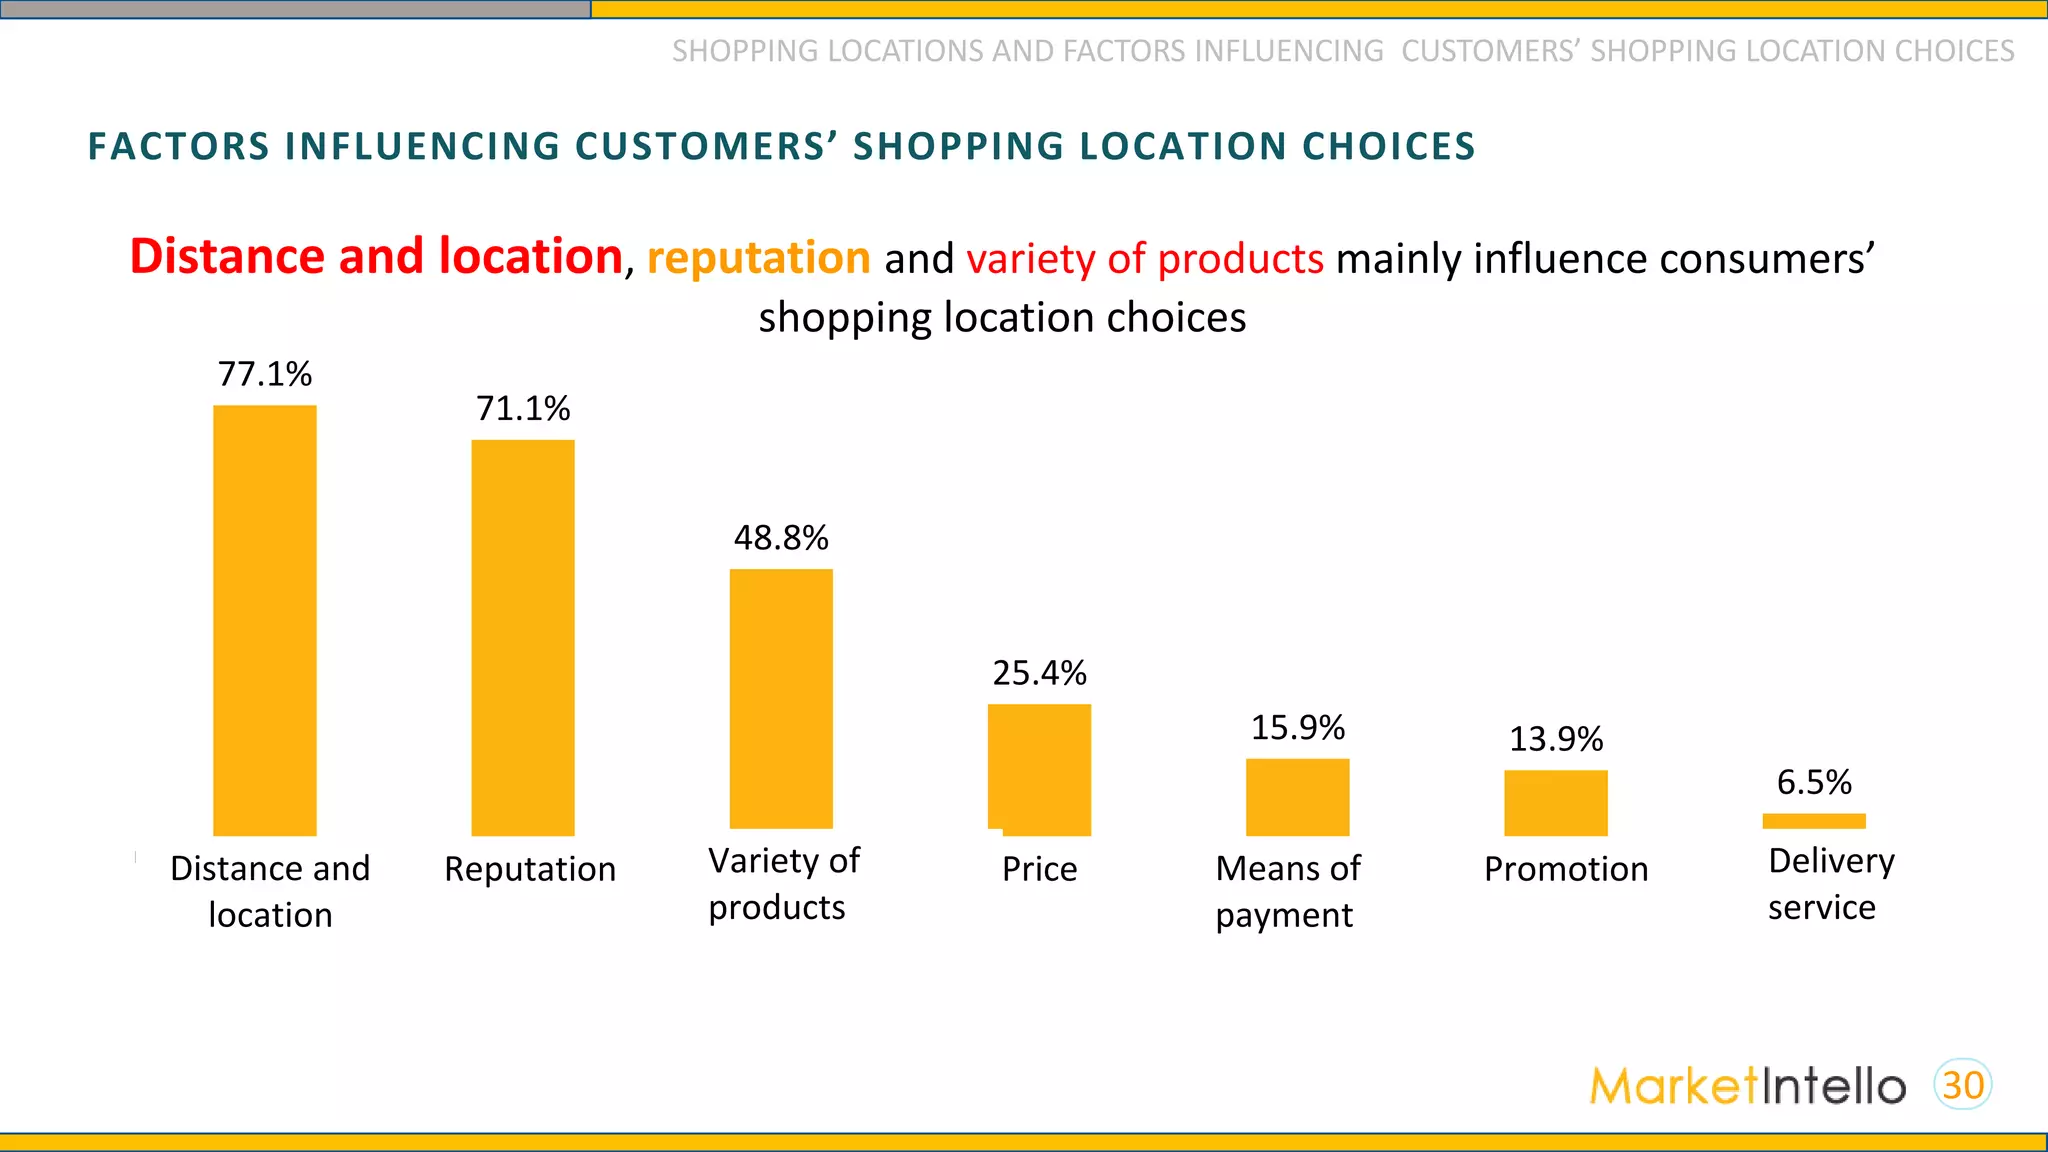
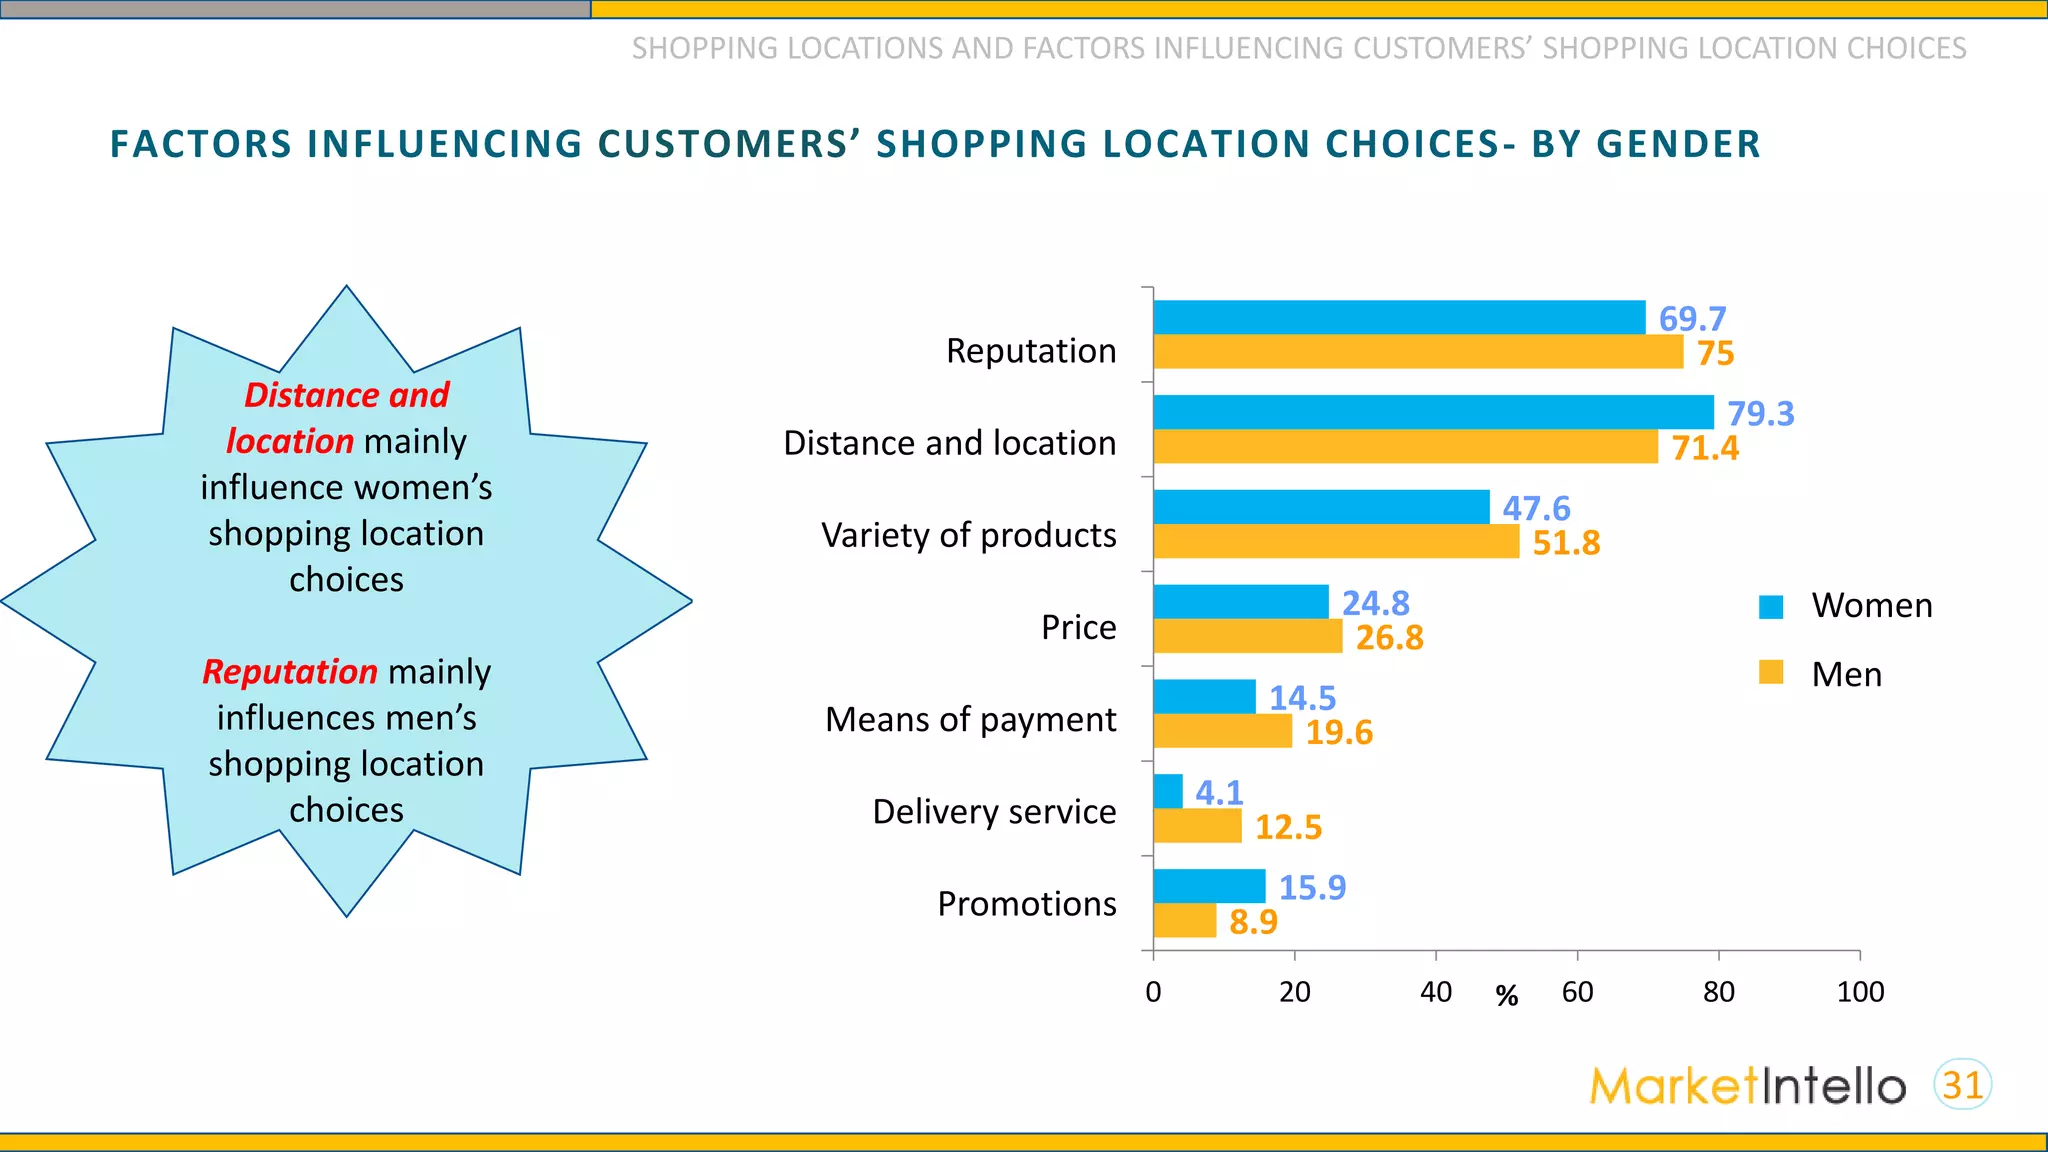
Distance and location, reputation and the variety of products mainly
influence consumers’ shopping location choices.
TV and word of mouth are the most popular channels to access product
information
[6] Characteristics of the household members consuming soft drinks the
most
Men consume soft drinks more often than Women do, 60.5%
Respondents under 30 years old consume soft drinks the most, 70%
EXECUTIVE SUMMARY](https://image.slidesharecdn.com/enreport-softdrinks-170309094558/75/Vietnam-s-soft-drink-consumer-behavior-5-2048.jpg)


The document provides an overview of a consumer behavior survey focused on the soft drink market, highlighting brand awareness and customer satisfaction levels. Coca-Cola leads in both brand awareness and consumer satisfaction, followed by Pepsi and popular tea brands. It also outlines factors influencing purchase decisions, purchasing habits, and channels for accessing product information.

![[Survey] Milk with sugar? - Vietnam milk drink behavior](https://cdn.slidesharecdn.com/ss_thumbnails/milkdrinkbehaviorfin0508-180508095313-thumbnail.jpg?width=640&height=640&fit=bounds)


![[Survey] Instant noodle store share in Vietnam](https://cdn.slidesharecdn.com/ss_thumbnails/instantnoodlesurveyinvietnam062417-170624134544-thumbnail.jpg?width=640&height=640&fit=bounds)


![[BLM15 - PLUG IN] RUNNERS](https://cdn.slidesharecdn.com/ss_thumbnails/blm15runnerspluginlethuynhi-150421091930-conversion-gate01-thumbnail.jpg?width=640&height=640&fit=bounds)


![[Fact sheet] Tổng quan thị trường cà phê Việt Nam](https://cdn.slidesharecdn.com/ss_thumbnails/coffeereportver6-170321070611-thumbnail.jpg?width=640&height=640&fit=bounds)


