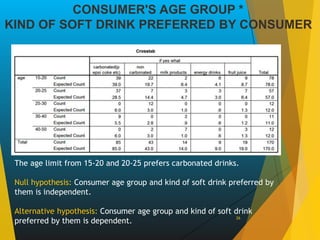
NAME : MAYUR RAWAT
ROLL.NO : 1423
INTRODUCTION
 The major constituent of our body is fluid, it is an essential
requirement that need to be fulfilled. In modern life there are
different kind of soft drinks are available in market such as
carbonated drinks, milk product, juice and fruit drinks.
 Now days these drinks have been part of the life of all of us, we all
are well aware of these words.
 Taste the thunder
 Ye Dil mange more
 Yeh hai youngisthan meri jaan
 Do the DEW
 Amul taste of India
 Today soft drink not only reduce the thirst but also has become style
and fashion. The interest of survey is to know what people like most
about soft drinks and what attracts them toward these products.
3
OBJECTIVE
1. To understand consumer perception toward
soft drinks.
2. To understand purchase behavior of
consumer.
3. To understand relationship between
demography of population and purchase
behavior.
4. To understand what people prefer most
RESEARCH QUESTIONS
1. What are the factors attracting people towards
soft drinks?
2. What are the factors influencing people’s choice?
3. What people looks for in these products?
4. What is the preference of people?
5. What are the criteria for selection?
METHODOLOGY
 Research design: Descriptive type
 Sampling design:
 Type of population: Infinite
 Sampling unit: Geographical sample unit
 Parameter of Interest: Most popular soft drinks
among people. Criteria of selection of soft
drinks by people.
 Sampling: : Convenient sampling (non
probability)
SAMPLING
 A sample size of 170 consumer was selected.
 𝑛 =
𝑧2 𝜎2
𝑒2 = 170 where, e = 0.1
 Z = 1.96 at 95% confidence level; 𝜎 = 4/6
 S.D= Range of population
6
DATA
Type: Primary
Data Collecting Instrument:
Questionnaire.
Scaling technique: Rating scale.
LIMITATION OF THE STUDY
1. Responses may vary as some of people did not
want to come with real answer.
2. Small sample size.
3. Personal bias of respondents limit the scope of
study.
4. Survey is conducted only in particular area
hence results may not be generalized.
DATA
ANALYSIS
10
FREQUENCY TABLE
 Gender of consumer
Frequency Percent Valid Percent
Cumulative
Percent
Valid Male 112 65.9 65.9 65.9
Female 58 34.1 34.1 100.0
Total 170 100.0 100.0
Gender of consumer
34.1%
65.9%
female
male
Inference:- The study was
performed on 170 people
which were randomly
selected in that major
portion is covered by the
male that is 65.9% and
female with 34.1%.
FREQUENCY TABLE
 Consumer’s occupation
Frequency Percent Valid Percent
Cumulative
Percent
Valid Professional 23 13.5 13.5 13.5
Businessman 22 12.9 12.9 26.5
service 23 13.5 13.5 40.0
student 90 52.9 52.9 92.9
other 12 7.1 7.1 100.0
Total 170 100.0 100.0
Consumer's occupation
7.1%
52.9% 13.5%
12.9%
13.5%
other
student service
bussinessman
professional
Inference: - Out of 170
people surveyed the major
portion is covered by the
student 52.9% and followed
by professional and service
person with 13.5% and
businessman with 12.9% and
other was found to be 7.1%
FREQUENCY TABLE
 Consumer’s age group
Frequency Percent Valid Percent Cumulative Percent
Valid 15-20 78 45.9 45.9 45.9
20-25 57 33.5 33.5 79.4
25-30 12 7.1 7.1 86.5
30-40 11 6.5 6.5 92.9
40-50 12 7.1 7.1 100.0
Total 170 100.0 100.0
Consumer's age group
7.1%
6.5%
7.1%
33.5%
45.9%
40-50
30-40
25-30
20-25
15-20
Inference: - The 170
people surveyed and
there age was found to
be 15-20 years with
45.9%,20-25 years with
33.5%, 25-30 years and
40-50 years with 7.1%
and 30-40 years with
6.5%.
KIND OF SOFT DRINK PREFERRED BY
CONSUMER
Frequency Percent Valid Percent Cumulative Percent
Valid carbonated(pepsi coke
etc)
85 50.0 50.0 50.0
non carbonated 43 25.3 25.3 75.3
milk products 14 8.2 8.2 83.5
energy drinks 9 5.3 5.3 88.8
fruit juice 19 11.2 11.2 100.0
Total 170 100.0 100.0
Kind of soft drink preferred by consumer
11.2%
5.3%
8.2%
25.3%
50.0%
fruit juice
energy drinks
milk products
non carbonated
carbonated(pepsi cok
Inference: - Out of 170
people the kind of soft
drink preferred by the
people are carbonated
(50%), non-carbonated
(25.3%), fruit juice (11.2%),
milk products (8.2%)and
energy drinks (5.3%).
WHY PEOPLE PREFER SOFT DRINK
Frequency Percent Valid Percent
Cumulative
Percent
Valid Thirst 90 52.9 52.9 52.9
Energy 11 6.5 6.5 59.4
Style 34 20.0 20.0 79.4
passion 23 13.5 13.5 92.9
Other 12 7.1 7.1 100.0
Total 170 100.0 100.0
Why people prefer soft drink
7.1%
13.5%
20.0%
6.5%
52.9%
other
passion
style
energy
thirst
Inference: - 52.9%
people purchase soft
drink because they are
thirsty, 20.0% purchase
for style, 13.5%
purchase for passion,
6.5% purchase for
energy and 7.1%
purchase for other
purpose.
CONSUMER’S BUYING REASON
Frequency Percent Valid Percent
Cumulative
Percent
Valid brand name 79 46.5 46.5 46.5
taste and flavour 46 27.1 27.1 73.5
easy availability 23 13.5 13.5 87.1
price 11 6.5 6.5 93.5
brand ambassador 11 6.5 6.5 100.0
Total 170 100.0 100.0
Consumer's buying reason
6.5%
6.5%
13.5%
27.1%
46.5%
brand ambassador
price
easy availability
taste and flavour
brand name
Inference: - Consumer’s
buying reason for soft
drink, major people i.e.
46.5% on brand name,
27.1% on taste and
flavor, 13.5% for easy
availability, 6.5% on
price, 6.5% on brand
ambassador.
PACKAGE PREFERRED BY CONSUMER
Frequency Percent Valid Percent
Cumulative
Percent
Valid plastic bottle 44 25.9 25.9 25.9
glass bottle 35 20.6 20.6 46.5
metal cane 69 40.6 40.6 87.1
tetra pack 22 12.9 12.9 100.0
Total 170 100.0 100.0
Package preferred by consumer
12.9%
40.6%
20.6%
25.9%
tetra pack
metal cane
glass bottle
plastic bottle
Inference: - The most
convenient package
preferred by consumer
is metal cane
(40.6%),and followed
by glass bottle (20.6%),
plastic bottle (25.9%),
and tetra pack (12.9%).
REASON TO ATTRACT TOWARDS
ADVERTISEMENT
Frequency Percent Valid Percent Cumulative Percent
Valid creativity slogan 20 11.8 11.8 11.8
brand ambassador 100 58.8 58.8 70.6
idea of advertising the
message
34 20.0 20.0 90.6
frequency of add 2 1.2 1.2 91.8
logical reasoning 14 8.2 8.2 100.0
Total 170 100.0 100.0
Reason to attract towards advertisement
8.2%
1.2%
20.0%
58.8%
11.8%
logical reasoning
frequency of add
idea of advertising
brand ambassador
creativity slogan
Inference: Reason to
attract consumer towards
advertisement is as brand
ambassador 58.8%,idea of
advertising 20%,creativity
11.8%,logical reasoning
8.2% and frequency of add
1.2%.
TIME OF CONSUMPTION
Frequency Percent Valid Percent
Cumulative
Percent
Valid morning 15 8.8 8.8 8.8
afternoon 45 26.5 26.5 35.3
evening 20 11.8 11.8 47.1
night 14 8.2 8.2 55.3
no specific time 76 44.7 44.7 100.0
Total 170 100.0 100.0
Time of consumption
44.7%
8.2%
11.8%
26.5%
8.8%
no specific time
night
evening
afternoon
morning
Inference: - The view of
consumer on the
consumption of the soft
drink on the basis of
time is as follow , No
specific time 44.7%,
evening 11.8%, afternoon
26.5%, morning 8.8%,
night 8.2%.
GENDER OF CONSUMER'S* KIND OF SOFT
DRINK PREFERRED BY CONSUMER
20
if yes what
Total
carbonated(p
epsi coke
etc)
non
carbonated
milk
products
energy
drinks
fruit
juice
Gender Male Count 70 7 14 6 15 112
Expected
Count
56.0 28.3 9.2 5.9 12.5 112.0
female Count 15 36 0 3 4 58
Expected
Count
29.0 14.7 4.8 3.1 6.5 58.0
Total Count 85 43 14 9 19 170
Expected
Count
85.0 43.0 14.0 9.0 19.0 170.0
Most of the male prefer carbonated drink while female prefer non-
carbonated drink.
Null hypothesis: Gender of consumer’s and Kind of soft drink preferred by
them are independent.
Alternative hypothesis: Gender of consumer’s and Kind of soft drink
preferred by them are dependent.
Chi-Square Tests
Value df
Asymp. Sig. (2-
sided)
Pearson Chi-Square 66.024(a) 4 .000
Likelihood Ratio 69.775 4 .000
Linear-by-Linear Association .039 1 .844
N of Valid Cases 170
a 2 cells (20.0%) have expected count less than 5. The minimum expected
count is 3.07.
Inference:- We reject the null hypothesis since
significance level is less than .05 and accept the
alternative hypothesis that gender of consumer’s and kind
of soft drink preferred by them are dependent.
gender
femalemale
Count
80
60
40
20
0
if y es what
carbonated(pepsi cok
e etc)
non carbonated
mi lk products
energy drinks
fruit juic e
Most of the male prefer carbonated drink while
female prefer non-carbonated drink.
CONSUMER'S OCCUPATION
KIND OF SOFT DRINK PREFERRED BY CONSUMER
23
Most of the consumer prefer the carbonated drink.
Null hypothesis: Consumer occupation and kind of the soft drink preferred
by them are independent.
Alternative hypothesis : Consumer occupation and kind of the soft drink
preferred by them are dependent.
Inference: We reject the null hypothesis since
significance level is less than .05 and accept the
alternative hypothesis that consumer occupation and
kind of soft drink preferred by them are dependent.
24
Most of the students prefer carbonated drink, and the
service man prefer the milk products.
25
CONSUMER'S AGE GROUP *
KIND OF SOFT DRINK PREFERRED BY CONSUMER
26
The age limit from 15-20 and 20-25 prefers carbonated drinks.
Null hypothesis: Consumer age group and kind of soft drink preferred by
them is independent.
Alternative hypothesis: Consumer age group and kind of soft drink
preferred by them is dependent.
Inference: We reject the null hypothesis since
significance level is less than .05 and accept the
alternative hypothesis that consumer age group and
kind of soft drink preferred by them are dependent.
27
The consumer with the age limit between 15-25
preferred carbonated drinks.
28
CONCLUSION
1. Youngsters prefers carbonated drinks
whereas most of older and service people
prefers juice and milk products.
2. Brand name plays major role in selection of
product followed by taste and flavor.
3. Most of the consumer were found in age
group 15-20 years with 45.9%,20-25 years
with 33.5%, 25-30 years and 40-50 years with
7.1% and 30-40 years with 6.5%.
….CONTD
4. The kind of soft drink preferred by the people are
carbonated(50%), non carbonated(25.3%), fruit juice
(11.2%), milk products (8.2%)and energy drinks
(5.3%).
5. 52.9% people purchase soft drink because they are
thirsty, 20.0% purchase for style, 13.5% purchase for
passion, 6.5% purchase for energy and 7.1%
purchase for other purpose.
6. Reason to attract consumer towards advertisement is
as brand ambassador 58.8%,idea of advertising
20%,creativity 11.8%,logical reasoning 8.2% and
….CONTD
7. The view of consumer on the consumption of the
soft drink on the basis of time is as follow , No
specific time 44.7%, evening 11.8%, afternoon
26.5%, morning 8.8%, night 8.2%.
8. I came to conclusion that visibility affect the sales
in a very special way and in term of
advertisement the brand ambassador, creativity,
idea of sending message is most attracting
feature.
9. In today’s scenario customer is the King, he has
got various choice around him, they prefer their
taste and price.
32

Mayur Rawat

  • 1.
    NAME : MAYURRAWAT ROLL.NO : 1423
  • 2.
    INTRODUCTION  The majorconstituent of our body is fluid, it is an essential requirement that need to be fulfilled. In modern life there are different kind of soft drinks are available in market such as carbonated drinks, milk product, juice and fruit drinks.  Now days these drinks have been part of the life of all of us, we all are well aware of these words.  Taste the thunder  Ye Dil mange more  Yeh hai youngisthan meri jaan  Do the DEW  Amul taste of India  Today soft drink not only reduce the thirst but also has become style and fashion. The interest of survey is to know what people like most about soft drinks and what attracts them toward these products.
  • 3.
  • 4.
    OBJECTIVE 1. To understandconsumer perception toward soft drinks. 2. To understand purchase behavior of consumer. 3. To understand relationship between demography of population and purchase behavior. 4. To understand what people prefer most
  • 5.
    RESEARCH QUESTIONS 1. Whatare the factors attracting people towards soft drinks? 2. What are the factors influencing people’s choice? 3. What people looks for in these products? 4. What is the preference of people? 5. What are the criteria for selection?
  • 6.
    METHODOLOGY  Research design:Descriptive type  Sampling design:  Type of population: Infinite  Sampling unit: Geographical sample unit  Parameter of Interest: Most popular soft drinks among people. Criteria of selection of soft drinks by people.  Sampling: : Convenient sampling (non probability)
  • 7.
    SAMPLING  A samplesize of 170 consumer was selected.  𝑛 = 𝑧2 𝜎2 𝑒2 = 170 where, e = 0.1  Z = 1.96 at 95% confidence level; 𝜎 = 4/6  S.D= Range of population 6
  • 8.
    DATA Type: Primary Data CollectingInstrument: Questionnaire. Scaling technique: Rating scale.
  • 9.
    LIMITATION OF THESTUDY 1. Responses may vary as some of people did not want to come with real answer. 2. Small sample size. 3. Personal bias of respondents limit the scope of study. 4. Survey is conducted only in particular area hence results may not be generalized.
  • 10.
  • 11.
    FREQUENCY TABLE  Genderof consumer Frequency Percent Valid Percent Cumulative Percent Valid Male 112 65.9 65.9 65.9 Female 58 34.1 34.1 100.0 Total 170 100.0 100.0 Gender of consumer 34.1% 65.9% female male Inference:- The study was performed on 170 people which were randomly selected in that major portion is covered by the male that is 65.9% and female with 34.1%.
  • 12.
    FREQUENCY TABLE  Consumer’soccupation Frequency Percent Valid Percent Cumulative Percent Valid Professional 23 13.5 13.5 13.5 Businessman 22 12.9 12.9 26.5 service 23 13.5 13.5 40.0 student 90 52.9 52.9 92.9 other 12 7.1 7.1 100.0 Total 170 100.0 100.0 Consumer's occupation 7.1% 52.9% 13.5% 12.9% 13.5% other student service bussinessman professional Inference: - Out of 170 people surveyed the major portion is covered by the student 52.9% and followed by professional and service person with 13.5% and businessman with 12.9% and other was found to be 7.1%
  • 13.
    FREQUENCY TABLE  Consumer’sage group Frequency Percent Valid Percent Cumulative Percent Valid 15-20 78 45.9 45.9 45.9 20-25 57 33.5 33.5 79.4 25-30 12 7.1 7.1 86.5 30-40 11 6.5 6.5 92.9 40-50 12 7.1 7.1 100.0 Total 170 100.0 100.0 Consumer's age group 7.1% 6.5% 7.1% 33.5% 45.9% 40-50 30-40 25-30 20-25 15-20 Inference: - The 170 people surveyed and there age was found to be 15-20 years with 45.9%,20-25 years with 33.5%, 25-30 years and 40-50 years with 7.1% and 30-40 years with 6.5%.
  • 14.
    KIND OF SOFTDRINK PREFERRED BY CONSUMER Frequency Percent Valid Percent Cumulative Percent Valid carbonated(pepsi coke etc) 85 50.0 50.0 50.0 non carbonated 43 25.3 25.3 75.3 milk products 14 8.2 8.2 83.5 energy drinks 9 5.3 5.3 88.8 fruit juice 19 11.2 11.2 100.0 Total 170 100.0 100.0 Kind of soft drink preferred by consumer 11.2% 5.3% 8.2% 25.3% 50.0% fruit juice energy drinks milk products non carbonated carbonated(pepsi cok Inference: - Out of 170 people the kind of soft drink preferred by the people are carbonated (50%), non-carbonated (25.3%), fruit juice (11.2%), milk products (8.2%)and energy drinks (5.3%).
  • 15.
    WHY PEOPLE PREFERSOFT DRINK Frequency Percent Valid Percent Cumulative Percent Valid Thirst 90 52.9 52.9 52.9 Energy 11 6.5 6.5 59.4 Style 34 20.0 20.0 79.4 passion 23 13.5 13.5 92.9 Other 12 7.1 7.1 100.0 Total 170 100.0 100.0 Why people prefer soft drink 7.1% 13.5% 20.0% 6.5% 52.9% other passion style energy thirst Inference: - 52.9% people purchase soft drink because they are thirsty, 20.0% purchase for style, 13.5% purchase for passion, 6.5% purchase for energy and 7.1% purchase for other purpose.
  • 16.
    CONSUMER’S BUYING REASON FrequencyPercent Valid Percent Cumulative Percent Valid brand name 79 46.5 46.5 46.5 taste and flavour 46 27.1 27.1 73.5 easy availability 23 13.5 13.5 87.1 price 11 6.5 6.5 93.5 brand ambassador 11 6.5 6.5 100.0 Total 170 100.0 100.0 Consumer's buying reason 6.5% 6.5% 13.5% 27.1% 46.5% brand ambassador price easy availability taste and flavour brand name Inference: - Consumer’s buying reason for soft drink, major people i.e. 46.5% on brand name, 27.1% on taste and flavor, 13.5% for easy availability, 6.5% on price, 6.5% on brand ambassador.
  • 17.
    PACKAGE PREFERRED BYCONSUMER Frequency Percent Valid Percent Cumulative Percent Valid plastic bottle 44 25.9 25.9 25.9 glass bottle 35 20.6 20.6 46.5 metal cane 69 40.6 40.6 87.1 tetra pack 22 12.9 12.9 100.0 Total 170 100.0 100.0 Package preferred by consumer 12.9% 40.6% 20.6% 25.9% tetra pack metal cane glass bottle plastic bottle Inference: - The most convenient package preferred by consumer is metal cane (40.6%),and followed by glass bottle (20.6%), plastic bottle (25.9%), and tetra pack (12.9%).
  • 18.
    REASON TO ATTRACTTOWARDS ADVERTISEMENT Frequency Percent Valid Percent Cumulative Percent Valid creativity slogan 20 11.8 11.8 11.8 brand ambassador 100 58.8 58.8 70.6 idea of advertising the message 34 20.0 20.0 90.6 frequency of add 2 1.2 1.2 91.8 logical reasoning 14 8.2 8.2 100.0 Total 170 100.0 100.0 Reason to attract towards advertisement 8.2% 1.2% 20.0% 58.8% 11.8% logical reasoning frequency of add idea of advertising brand ambassador creativity slogan Inference: Reason to attract consumer towards advertisement is as brand ambassador 58.8%,idea of advertising 20%,creativity 11.8%,logical reasoning 8.2% and frequency of add 1.2%.
  • 19.
    TIME OF CONSUMPTION FrequencyPercent Valid Percent Cumulative Percent Valid morning 15 8.8 8.8 8.8 afternoon 45 26.5 26.5 35.3 evening 20 11.8 11.8 47.1 night 14 8.2 8.2 55.3 no specific time 76 44.7 44.7 100.0 Total 170 100.0 100.0 Time of consumption 44.7% 8.2% 11.8% 26.5% 8.8% no specific time night evening afternoon morning Inference: - The view of consumer on the consumption of the soft drink on the basis of time is as follow , No specific time 44.7%, evening 11.8%, afternoon 26.5%, morning 8.8%, night 8.2%.
  • 20.
    GENDER OF CONSUMER'S*KIND OF SOFT DRINK PREFERRED BY CONSUMER 20 if yes what Total carbonated(p epsi coke etc) non carbonated milk products energy drinks fruit juice Gender Male Count 70 7 14 6 15 112 Expected Count 56.0 28.3 9.2 5.9 12.5 112.0 female Count 15 36 0 3 4 58 Expected Count 29.0 14.7 4.8 3.1 6.5 58.0 Total Count 85 43 14 9 19 170 Expected Count 85.0 43.0 14.0 9.0 19.0 170.0 Most of the male prefer carbonated drink while female prefer non- carbonated drink. Null hypothesis: Gender of consumer’s and Kind of soft drink preferred by them are independent. Alternative hypothesis: Gender of consumer’s and Kind of soft drink preferred by them are dependent.
  • 21.
    Chi-Square Tests Value df Asymp.Sig. (2- sided) Pearson Chi-Square 66.024(a) 4 .000 Likelihood Ratio 69.775 4 .000 Linear-by-Linear Association .039 1 .844 N of Valid Cases 170 a 2 cells (20.0%) have expected count less than 5. The minimum expected count is 3.07. Inference:- We reject the null hypothesis since significance level is less than .05 and accept the alternative hypothesis that gender of consumer’s and kind of soft drink preferred by them are dependent.
  • 22.
    gender femalemale Count 80 60 40 20 0 if y eswhat carbonated(pepsi cok e etc) non carbonated mi lk products energy drinks fruit juic e Most of the male prefer carbonated drink while female prefer non-carbonated drink.
  • 23.
    CONSUMER'S OCCUPATION KIND OFSOFT DRINK PREFERRED BY CONSUMER 23 Most of the consumer prefer the carbonated drink. Null hypothesis: Consumer occupation and kind of the soft drink preferred by them are independent. Alternative hypothesis : Consumer occupation and kind of the soft drink preferred by them are dependent.
  • 24.
    Inference: We rejectthe null hypothesis since significance level is less than .05 and accept the alternative hypothesis that consumer occupation and kind of soft drink preferred by them are dependent. 24
  • 25.
    Most of thestudents prefer carbonated drink, and the service man prefer the milk products. 25
  • 26.
    CONSUMER'S AGE GROUP* KIND OF SOFT DRINK PREFERRED BY CONSUMER 26 The age limit from 15-20 and 20-25 prefers carbonated drinks. Null hypothesis: Consumer age group and kind of soft drink preferred by them is independent. Alternative hypothesis: Consumer age group and kind of soft drink preferred by them is dependent.
  • 27.
    Inference: We rejectthe null hypothesis since significance level is less than .05 and accept the alternative hypothesis that consumer age group and kind of soft drink preferred by them are dependent. 27
  • 28.
    The consumer withthe age limit between 15-25 preferred carbonated drinks. 28
  • 29.
    CONCLUSION 1. Youngsters preferscarbonated drinks whereas most of older and service people prefers juice and milk products. 2. Brand name plays major role in selection of product followed by taste and flavor. 3. Most of the consumer were found in age group 15-20 years with 45.9%,20-25 years with 33.5%, 25-30 years and 40-50 years with 7.1% and 30-40 years with 6.5%.
  • 30.
    ….CONTD 4. The kindof soft drink preferred by the people are carbonated(50%), non carbonated(25.3%), fruit juice (11.2%), milk products (8.2%)and energy drinks (5.3%). 5. 52.9% people purchase soft drink because they are thirsty, 20.0% purchase for style, 13.5% purchase for passion, 6.5% purchase for energy and 7.1% purchase for other purpose. 6. Reason to attract consumer towards advertisement is as brand ambassador 58.8%,idea of advertising 20%,creativity 11.8%,logical reasoning 8.2% and
  • 31.
    ….CONTD 7. The viewof consumer on the consumption of the soft drink on the basis of time is as follow , No specific time 44.7%, evening 11.8%, afternoon 26.5%, morning 8.8%, night 8.2%. 8. I came to conclusion that visibility affect the sales in a very special way and in term of advertisement the brand ambassador, creativity, idea of sending message is most attracting feature. 9. In today’s scenario customer is the King, he has got various choice around him, they prefer their taste and price.
  • 32.