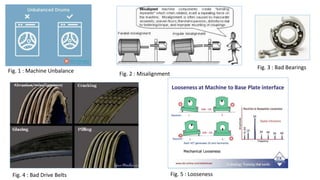
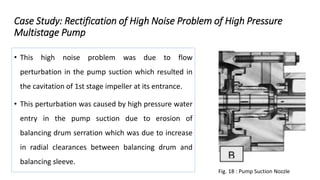
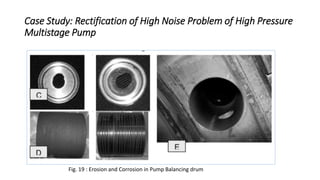
Vibration Signature Analysis and Case study
DONE BY:
GIRISH RAGHUNATHAN
M.Tech in Machine Design
Assignment
on
1
OUTLINE
• Introduction
• Necessity of Machine Fault Detection
• Vibration Signature Analysis
• Time Domain
• Frequency Domain
• Quefrency Domain
• Case Study
2
Introduction
• When a fault takes places, some of the machine parameters are subjected to
change.
• The main causes of mechanical vibration are unbalance, misalignment, looseness
and distortion, defective bearings, gearing and coupling inaccuracies, critical
speeds, various form of resonance, bad drive belts, reciprocating forces,
aerodynamic or hydrodynamic forces, oil whirl, friction whirl, rotor/stator
misalignments, bent rotor shafts, defective rotor bars, and so on.
Fig. 1 : Machine Unbalance Fig. 2 : Misalignment
Fig. 3 : Bad Bearings
Fig. 4 : Bad Drive Belts Fig. 5 : Looseness
Necessity of Machine Fault Identification
• Classification of failure causes are as follows:
Inherent weakness in material, design, and manufacturing;
Misuse or applying stress in undesired direction;
Gradual deterioration due to wear, tear, stress fatigue, corrosion,
and
• There are certain objectives of machine fault identification:
Prevention of future failure events.
Assurance of safety, reliability, and
Maintainability of machineries.
Fig. 6 : Residual Stresses
Fig. 7 : Corrosion
Vibration Signature Analysis
• Vibration signature analysis techniques for
machine fault identification based on the
principle that all the system produces vibration.
• Change in vibration spectrum of machine due to
fault.
• The vibration signals obtained from the vicinity
of a bearing assembly contain rich information
about the bearing condition.
Fig. 8 : Broken Gear Tooth
Fig. 9 : Corresponding peak in Signature
Vibration Signature Analysis
• Signatures are extensively used as a diagnostic
tool for mechanical system.
• Signal processing is undertaken on those signals
in order to enhance or extract specific features of
such vibration signatures.
• Type and range of transducers used as pickup for
capturing vibration signal.
• Noise Reduction
Fig. 10 : Vibration Pickups
Fig. 11 : DAQ System and Control
1) Time-Domain Analysis
• The time domain refers to a display or
analysis of the vibration data as a
function of time.
• Little or no data are lost prior to
inspection.
• Often too much data for easy and clear
fault diagnosis.
• A time-domain analysis focuses principally on statistical characteristics of vibration signal
such as peak level, standard deviation, skewness, kurtosis, and crest factor.
• Time-domain analysis of vibration signals can be subdivided into the following categories:
1. Time-waveform analysis,
2. Time-waveform indices,
3. Time-synchronous averaging,
4. Negative averaging,
5. Orbits,
6. Probability density moments
Fig. 12 : Vibration Signature (Time Domain)
2) Frequency Domain Analysis
• The frequency domain refers to a display
or analysis of the vibration data as a
function of frequency.
• Fast Fourier transform (FFT) algorithm.
• Repetitive nature of the vibration signal is
clearly displayed as Frequency peaks.
• Easy for early detection and diagnosis of
faults.
Fig. 13 : Time and Frequency Domain
• Significant amount of information (transients, non-repetitive signal components) may be
lost during the transformation process. Not retrievable unless a permanent record of the
raw vibration signal has been made.
• The various methods of frequency-domain vibration signature analysis are - Band pass
analysis, Shock pulse (spike energy), Enveloped spectrum, Signature spectrum, and
Cascades (waterfall plots).
Fig. 14 : Fast Fourier Transform (FFT)
3) The Quefrency Domain
• The quefrency is the abscissa for the
cepstrum which is defined as the
spectrum of the logarithm of the
power spectrum.
• It is used to highlight periodicities
that occur in the spectrum.
• Cepstrum Analysis.
Fig. 15 : Quefrency and Cepstrum
Case Study: Rectification of High Noise Problem of High Pressure
Multistage Pump
S.No Particulars Value
1 Pump Make M/s KSB
2 Type Horizontal, centrifugal modular design pump
3 Number of Stages 7
4 Motor Specs 220 HP , 1500 rpm motor, 29 A
5 Pump Speed 5130 rpm
6 Pump Rated Capacity 27 cubic meter / hour
7 Total Head Developed 450 LPM at 830 meter head
8 Noise Level near suction
nozzle
106 dB
Table 1: Pump Parameters
Case Study: Rectification of High Noise Problem of High Pressure
Multistage Pump
Following observations were noticed:
• Overall vibration of suction pipeline varied between 20 to 50 mm/sec (peak) at
different locations.
• This was higher than the 12 mm/sec acceptable limit for piping vibration as per
ASME O & M code for nuclear piping.
• The vibration amplitude corresponding to pump rpm at 87.5 Hz was very low.
Whereas vibration peaks of high amplitude found at 365.2 Hz, 1 KHz, 1.5 KHz etc.
Case Study: Rectification of High Noise Problem of High Pressure
Multistage Pump
Fig. 16 : Pump Vibration Signature
Case Study: Rectification of High Noise Problem of High Pressure
Multistage Pump
• Probable causes of high vibration were
either rubbing or amplification of
unbalance forces due to mechanical
looseness or both.
• This caused deterioration of pump and
result in increase in vibration within a
short span of time.
Fig. 17 : Pump Sectional View
Case Study: Rectification of High Noise Problem of High Pressure
Multistage Pump
• This high noise problem was due to flow
perturbation in the pump suction which resulted in
the cavitation of 1st stage impeller at its entrance.
• This perturbation was caused by high pressure water
entry in the pump suction due to erosion of
balancing drum serration which was due to increase
in radial clearances between balancing drum and
balancing sleeve.
Fig. 18 : Pump Suction Nozzle
Case Study: Rectification of High Noise Problem of High Pressure
Multistage Pump
Fig. 19 : Erosion and Corrosion in Pump Balancing drum
Conclusion
• Systematic vibration signature analysis has assisted in solving the above specific
cases of high vibration.
• So, vibration signature analysis is very important diagnostic tool for reliability
centered maintenance.
THANK YOU

Vibration signature analysis

  • 1.
    Vibration Signature Analysisand Case study DONE BY: GIRISH RAGHUNATHAN M.Tech in Machine Design Assignment on 1
  • 2.
    OUTLINE • Introduction • Necessityof Machine Fault Detection • Vibration Signature Analysis • Time Domain • Frequency Domain • Quefrency Domain • Case Study 2
  • 3.
    Introduction • When afault takes places, some of the machine parameters are subjected to change. • The main causes of mechanical vibration are unbalance, misalignment, looseness and distortion, defective bearings, gearing and coupling inaccuracies, critical speeds, various form of resonance, bad drive belts, reciprocating forces, aerodynamic or hydrodynamic forces, oil whirl, friction whirl, rotor/stator misalignments, bent rotor shafts, defective rotor bars, and so on.
  • 4.
    Fig. 1 :Machine Unbalance Fig. 2 : Misalignment Fig. 3 : Bad Bearings Fig. 4 : Bad Drive Belts Fig. 5 : Looseness
  • 5.
    Necessity of MachineFault Identification • Classification of failure causes are as follows: Inherent weakness in material, design, and manufacturing; Misuse or applying stress in undesired direction; Gradual deterioration due to wear, tear, stress fatigue, corrosion, and • There are certain objectives of machine fault identification: Prevention of future failure events. Assurance of safety, reliability, and Maintainability of machineries. Fig. 6 : Residual Stresses Fig. 7 : Corrosion
  • 6.
    Vibration Signature Analysis •Vibration signature analysis techniques for machine fault identification based on the principle that all the system produces vibration. • Change in vibration spectrum of machine due to fault. • The vibration signals obtained from the vicinity of a bearing assembly contain rich information about the bearing condition. Fig. 8 : Broken Gear Tooth Fig. 9 : Corresponding peak in Signature
  • 7.
    Vibration Signature Analysis •Signatures are extensively used as a diagnostic tool for mechanical system. • Signal processing is undertaken on those signals in order to enhance or extract specific features of such vibration signatures. • Type and range of transducers used as pickup for capturing vibration signal. • Noise Reduction Fig. 10 : Vibration Pickups Fig. 11 : DAQ System and Control
  • 8.
    1) Time-Domain Analysis •The time domain refers to a display or analysis of the vibration data as a function of time. • Little or no data are lost prior to inspection. • Often too much data for easy and clear fault diagnosis.
  • 9.
    • A time-domainanalysis focuses principally on statistical characteristics of vibration signal such as peak level, standard deviation, skewness, kurtosis, and crest factor. • Time-domain analysis of vibration signals can be subdivided into the following categories: 1. Time-waveform analysis, 2. Time-waveform indices, 3. Time-synchronous averaging, 4. Negative averaging, 5. Orbits, 6. Probability density moments Fig. 12 : Vibration Signature (Time Domain)
  • 10.
    2) Frequency DomainAnalysis • The frequency domain refers to a display or analysis of the vibration data as a function of frequency. • Fast Fourier transform (FFT) algorithm. • Repetitive nature of the vibration signal is clearly displayed as Frequency peaks. • Easy for early detection and diagnosis of faults. Fig. 13 : Time and Frequency Domain
  • 11.
    • Significant amountof information (transients, non-repetitive signal components) may be lost during the transformation process. Not retrievable unless a permanent record of the raw vibration signal has been made. • The various methods of frequency-domain vibration signature analysis are - Band pass analysis, Shock pulse (spike energy), Enveloped spectrum, Signature spectrum, and Cascades (waterfall plots).
  • 12.
    Fig. 14 :Fast Fourier Transform (FFT)
  • 13.
    3) The QuefrencyDomain • The quefrency is the abscissa for the cepstrum which is defined as the spectrum of the logarithm of the power spectrum. • It is used to highlight periodicities that occur in the spectrum. • Cepstrum Analysis. Fig. 15 : Quefrency and Cepstrum
  • 14.
    Case Study: Rectificationof High Noise Problem of High Pressure Multistage Pump S.No Particulars Value 1 Pump Make M/s KSB 2 Type Horizontal, centrifugal modular design pump 3 Number of Stages 7 4 Motor Specs 220 HP , 1500 rpm motor, 29 A 5 Pump Speed 5130 rpm 6 Pump Rated Capacity 27 cubic meter / hour 7 Total Head Developed 450 LPM at 830 meter head 8 Noise Level near suction nozzle 106 dB Table 1: Pump Parameters
  • 15.
    Case Study: Rectificationof High Noise Problem of High Pressure Multistage Pump Following observations were noticed: • Overall vibration of suction pipeline varied between 20 to 50 mm/sec (peak) at different locations. • This was higher than the 12 mm/sec acceptable limit for piping vibration as per ASME O & M code for nuclear piping. • The vibration amplitude corresponding to pump rpm at 87.5 Hz was very low. Whereas vibration peaks of high amplitude found at 365.2 Hz, 1 KHz, 1.5 KHz etc.
  • 16.
    Case Study: Rectificationof High Noise Problem of High Pressure Multistage Pump Fig. 16 : Pump Vibration Signature
  • 17.
    Case Study: Rectificationof High Noise Problem of High Pressure Multistage Pump • Probable causes of high vibration were either rubbing or amplification of unbalance forces due to mechanical looseness or both. • This caused deterioration of pump and result in increase in vibration within a short span of time. Fig. 17 : Pump Sectional View
  • 18.
    Case Study: Rectificationof High Noise Problem of High Pressure Multistage Pump • This high noise problem was due to flow perturbation in the pump suction which resulted in the cavitation of 1st stage impeller at its entrance. • This perturbation was caused by high pressure water entry in the pump suction due to erosion of balancing drum serration which was due to increase in radial clearances between balancing drum and balancing sleeve. Fig. 18 : Pump Suction Nozzle
  • 19.
    Case Study: Rectificationof High Noise Problem of High Pressure Multistage Pump Fig. 19 : Erosion and Corrosion in Pump Balancing drum
  • 20.
    Conclusion • Systematic vibrationsignature analysis has assisted in solving the above specific cases of high vibration. • So, vibration signature analysis is very important diagnostic tool for reliability centered maintenance.
  • 21.