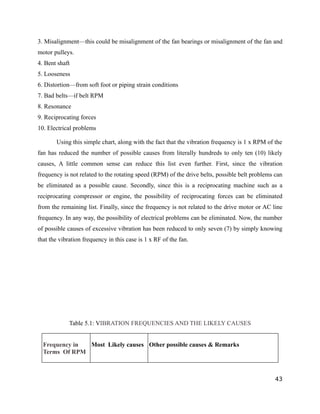
CHAPTER 5.0 
VIBRATION ANALYSIS 
5.1 INTRODUCTION 
There are literally hundreds of specific mechanical and operational problems that can result 
in excessive machinery vibration. However, since each type of problem generates vibration in a 
unique way, a thorough study of the resultant vibration characteristics can go a long way in 
reducing the number of possibilities—hopefully to a single cause. A simple, logical and 
systematic approach that has been proven successful in pinpointing the vast majority of the most 
common day-to-day machinery problems. 
5.2 DEFINE THE PROBLEM 
The following lists some of the reasons for performing a vibration analysis: 
1. Establish "baseline data" for future analysis needs. At the beginning of a predictive 
maintenance program, even machines in good operating condition should be thoroughly analyzed 
to establish their normal vibration characteristics. Later, when problems do develop, this baseline 
information can be - extremely useful in performing a follow-up analysis to show precisely the 
vibration characteristics that have changed. 
2. Identify the cause of excessive vibration. Referring to the vibration severity guidelines 
machines in service that have vibration levels in the "rough" regions or greater should be 
thoroughly. Analyzed to identify existing problems for immediate correction. Once corrections 
have been made, a follow-up analysis should be performed to insure that problems have been 
solved and the machine returned to satisfactory condition. If all significant problems have been 
solved, the follow-up analysis data will serve as the baseline data for future analysis as outlined 
in (1) above. 
3. Identify the cause of a significant vibration increase. Once a developing problem has 
been detected by routine, periodic checks, the obvious next step is to perform a detailed vibration 
analysis to identify the problem for correction. Here also, a follow-up analysis will verify that the 
problems have been corrected and provide a baseline for future comparison 
36
4. Identify the cause of frequent component failures such as bearings, couplings, seals, 
shafts, etc. 
5. Identify the cause of structural failures such as the structure or foundation, piping etc. 
6. Identify the source of a noise problem. 
5.3 DETERMINE MACHINE DETAILS 
Some of the important detailed features of the machine that need to be known for 
Accurate analyses include: 
1. The rotating speed (RPM) of each machine component: Of course, direct-coupled 
machines have only one rotating speed (RPM) that needs to be known. However, machines that 
include gear drives will have more than one.' For single gear increasers or reducers, both the 
input and output speeds are needed. For multiple gear increasers or decreases, the rotating 
speeds of the various intermediate gears must be known along with the input and output speeds. 
2. Types of bearings: Of course worn or defective sleeve or plain bearings will have different 
vibration characteristics than defective rolling-element bearings. Therefore, it is most important 
to know whether the machine has plain or rolling element bearings. If the machine has rolling-element 
bearings, it is also beneficial to know the number of rolling elements and other details of 
bearing geometry; with this information, the vibration analyst can actually calculate the 
frequencies of vibration caused by specific bearing defects such as flaws on the outer and inner 
raceways, rolling elements, etc. Details on determining specific bearing defect frequencies are 
presented in the ANALYSIS OF ROLLING ELEMENT BEARINGS section of this chapter. 
3. Number of fan blades: Knowing the machine RPM and number of blades on a fan will 
enable the analyst to easily calculate the "blade-passing" frequency. This is simply the product of 
the number of fan blades times fan RPM. This frequency of vibration is also called the 
"aerodynamic pulsation frequency. 
4. Number of impeller vanes: Similar to fans and blowers, knowing the number of vanes on a 
pump impeller allows the analyst to calculate the vane-passing frequency, also called the 
"hydraulic-pulsation" frequency. 
5. Number of gear teeth: The rotating speed and number of teeth on each gear must be known 
in order to determine the possible "gear-mesh" frequencies. 
6. Type of coupling: Gear and other lubricated types of couplings can generate some unique 
37
vibration characteristics whenever their lubrication breaks down or if lubrication is inadequate. 
7. Machine critical speeds: Some machines such as high speed, multi-stage centrifugal 
pumps, compressors and turbines are designed to operate at speeds above the natural or 
"resonant" frequency of the shaft. The resonant frequency of the shaft or rotor is called its 
"critical" speed, and operating a near this speed can result in extremely high vibration 
amplitudes. Therefore, knowing the rotor critical speed relative to machine RPM and other 
potential exciting force frequencies are very important. 
8. Background vibration sources: Many times the vibration being measured on a machine is 
actually coming from another machine in the immediate area. This is particularly true for 
machines mounted on the same foundation or that are interconnected by piping or other 
structural means. Therefore, it is important to be aware of potential "background" contributions. 
This is especially true with machine tools, due to the low levels of vibration required! If possible, 
the machine under analysis should be shut down and readings taken to directly determine the 
amount and significance of background vibration. 
5.4 VISUAL INSPECTION 
Before collecting data, the vibration analyst should first make a visual check of the 
machine to determine if there are any obvious faults or defects that could contribute to the 
machines condition. Some obvious things to look for include; 
1. Loose or missing mounting bolts 
2. Cracks in the base, foundation or structural welds 
3. Leaking seals 
4. Worn or broken parts 
5. Wear, corrosion or build-up of deposits on rotating elements such as fans. 
Slow Motion Studies 
Another test that is helpful in a visual inspection of the machine is slow motion 
observation of the various rotating elements of the machine with a high-intensity stroboscopic 
light. The strobe light must be one that has an adjustable flash rate. Simply adjust the strobe to 
flash at a rate which is slightly faster or slightly slower than the rotating speed (1 x RPM) of the 
machine. This will make the rotating components appear to rotate slowly. 
Slowing down the rotating motion of the machine makes it possible to visually detect 
38
problems that may be difficult to detect any other way. Visual run out of a shaft may pinpoint or 
verity a bent shaft condition. Eccentricity of "V" belt sheaves and pulleys can be easily detected 
in slow motion. Slow motion studies are especially useful in evaluating problems with belt 
drives. Worn grooves in pulleys or belts with variations in thickness can easily be seen by 
observing the action of the belt riding up and down in the pulley grooves. On multiple-belt 
drives, belt slippage can be determined by observing the belts in slow motion. 
5.5 PROBING STUDIES 
The tendency in vibration analysis is to concentrate on analyzing vibration data taken at 
the bearings of the machine. While this data is definitely an important part of any vibration 
analysis, in many cases the vibration that is occurring at the machine's bearings is actually the 
result of problems elsewhere in the "system. For example, in one case a vertical pump had a 
vibration of 0.7 in/sec measured at the top bearing of the pump motor. However, overall 
vibration readings taken on the pump base, foundation and piping revealed that the discharge 
piping was vibrating at a level of 3.0 in/sec or over four times higher than the pump motor itself. 
The problem turned out to be resonance of the discharge piping and not a problem with the pump 
itself. The pump and drive motor in this case were simply responding to the piping problem. 
The only way other problems in the system can be detected, such as the piping resonance 
described above, is to go looking for them. Depending on the anticipated vibration frequencies, 
select overall displacement, velocity or acceleration for measurement. Some of the areas that 
should be checked include: 
1. Suction and discharge piping on pumps: Take overall measurements in three directions. On 
long piping runs, take readings at several locations along the piping. 
2. Externally mounted components such as exciters, lube-oil pumps, surge bottles, etc. Here also, 
take overall measurements in three directions 
3. Take overall measurements on nearby machines that may contribute background vibration. If a 
nearby machine has higher vibration amplitudes than the one being analyzed, it is very likely 
some of the vibration is coming from the background source. 
4. Compare overall vibration readings across all mounting interfaces to detect obvious signs of 
looseness or weakness. 
5. In addition to taking comparative overall readings across the mounting interfaces 
39
To detect Obvious looseness problems, the vibration, amplitudes taken vertically at The 
mounting points of a machine, such as the four feet of a motor, can be compared to reveal the 
possibility distortion or "soft-foot or distortion conditions caused by uneven mounting or foot 
will usually be indicated if one or more of the feet reveals a significantly higher amplitude than 
the other feet. If this is defected, the condition should be verified and Corrected before further 
analysis is carried out. Soft-foot conditions can be checked by placing a dial indicator directly on 
the foot and carefully loosening the mounting bolt while observing the indicator reading. Any 
movement or "spring" in excess of 0.002 - 0.003 inch is generally considered excessive and 
should be corrected. 
5.6 OBTAIN HORIZONTAL, VERTICAL AND AXIAL SPECTRUMS (FFTS) AT EACH BEARING OF THE 
MACHINE TRAIN 
In many cases, the analysis steps carried out thus far may be sufficient to pinpoint the 
specific problem causing excessive vibration. If not, the next step is to obtain a complete set of 
amplitude-versus-frequency spectrums or FFTs at each bearing of the machine train. For a proper 
analysis, the machine should be operating under normal conditions of load, speed, temperature, 
etc. 
In order to insure that the analysis data taken includes all the problem-related vibration 
characteristics and, yet, is easy to evaluate and interpret, the following recommendations are 
offered; 
Interpreting the Data 
Once horizontal, vertical and axial FFTs have been obtained for each bearing of the 
machine train, the obvious next question is: "What is this data telling me?" Essentially, 
amplitude-versus-frequency spectrums or FFTs serve two very important purposes in vibration 
analysis: 
1. Identify the machine component (motor, pump, gear box, etc.) of the machine train that has 
the problem And 
2. Reduce the number of possible problems from several hundred to only a limited few. 
Identifying the Problem Component Based On Frequency 
Figure 5-1 shows a fan operating at 2200 RPM, belt driven by an 1800 RPM motor. The 
rotating speed of the belts is 500 RPM. Assume that a vibration analysis was performed on this 
40
machine and the only significant vibration detected had a frequency of 2200 CPM or 1 x RPM of 
the fan. Since the vibration frequency is exactly related to fan speed, this clearly indicates that 
the fan is the component with the problem. This simple fact eliminates the drive motor, belts and 
possible background sources as possible causes. 
Most problems generate vibration with frequencies that are exactly related to the rotating 
speed of trip in trouble. These frequencies may be exactly 1 x RPM or multiples (harmonics) of 
1 x RPM such as 2x, 3x, 4x, etc. In addition, some problem's may cause vibration frequencies 
that are exact sub harmonics of 1 x RPM such as 1/2x, l/3x or 1/4 x RPM. In any event, the FFT 
analysis data can identity the machine component with the problem based on the direct 
relationship between the measured vibration frequency and the rotating speed of the various 
machine elements. 
Identifying the Problem Component Based On Amplitude 
Identifying the fan as the source of vibration based on vibration frequency was quite easy 
in the above example because of the notable differences in the rotating speeds of the various 
machine components. The obvious question, of course is: What about direct-coupled machines 
that is operating at exactly the same speed?" In this case, the component with the problem is 
normally identified as the one with the highest amplitude. For example, consider a motor direct 
coupled to a pump. Examining the analysis data, it is noted that the highest vibration amplitude 
on the motor is 1.0 in/sec compared to 0.12 in/sec on the pump. In this case, the motor is clearly 
the problem component since its vibration amplitude is nearly 8 times higher than that measured 
on the pump. 
In general, the machine component that has the problem is usually the one with the 
highest amplitude of vibration. The forces that cause vibration tend to dissipate in strength at 
increased distances from the source. However, there are exceptions to this rule such as the 
example given earlier where a vertical pump was vibrating excessively due to a resonance 
problem with the discharge piping. In this case, the exciting force was actually generated by the 
motor/pump but was being amplified by the resonant condition of the piping. 
Another exception to this rule involves misalignment of direct coupled machines. Sir 
Isaac Newton’s third law of physics slates that "whenever one body exerts a force on another, the 
second always exerts on the first a force which is equal in magnitude but oppositely directed." In 
41
other words, "for every action, there is an equal but opposite reaction." In the case of coupling 
misalignment, the vibratory force (action) is generated at the coupling between the driver a 
driven components. As a result, the "reaction" forces on the driver and driven unit; will be 
essentially equal, resulting in reasonably comparable vibration amplitudes. The only reason one 
component may have a slightly higher or lower amplitude than the other is because of differences 
in the mass and stiffness characteristics of the two components. But, in most cases with the 
coupling misalignment, the vibration is fairly uniformly "shared" by the driver and driven units. 
Fig 5.1 Different components generate different vibration frequencies 
Reducing the List of Possible Problems Based On Frequency 
In addition to identifying the problem machine component based on frequency and/or 
amplitude characteristics, the second purpose of FFT analysis data is to limit or reduce the list of 
possible problems based on the measured vibration frequencies. 
As stated earlier, each mechanical and operational problem generates its own unique 
vibration frequency characteristics. Therefore, by knowing the vibration frequency, a list of the 
problems that cause or generate that particular frequency can be made, which greatly reduces the 
long list of possibilities. 
The chart lists the most common vibration frequencies is they relate to machine rotating 
speed (RPM), along with the common causes for each frequency. To illustrate how to use the 
chart, assume that the belt-driven fan pictured in Figure 4-1 has excessive vibration at 2200 CPM 
which is 1 x RPM of the fan. Of course, this clearly indicates that the fan is the component with 
the problem and not the drive motor or belts. In addition, since the vibration frequency is 1 x 
RPM of the fan, the possible causes listed on the chart are: 
1. Unbalance 
2. Eccentric pulley 
42
3. Misalignment—this could be misalignment of the fan bearings or misalignment of the fan and 
motor pulleys. 
4. Bent shaft 
5. Looseness 
6. Distortion—from soft foot or piping strain conditions 
7. Bad belts—if belt RPM 
8. Resonance 
9. Reciprocating forces 
10. Electrical problems 
Using this simple chart, along with the fact that the vibration frequency is 1 x RPM of the 
fan has reduced the number of possible causes from literally hundreds to only ten (10) likely 
causes, A little common sense can reduce this list even further. First, since the vibration 
frequency is not related to the rotating speed (RPM) of the drive belts, possible belt problems can 
be eliminated as a possible cause. Secondly, since this is a reciprocating machine such as a 
reciprocating compressor or engine, the possibility of reciprocating forces can be eliminated 
from the remaining list. Finally, since the frequency is not related to the drive motor or AC line 
frequency. In any way, the possibility of electrical problems can be eliminated. Now, the number 
of possible causes of excessive vibration has been reduced to only seven (7) by simply knowing 
that the vibration frequency in this case is 1 x RF of the fan. 
Table 5.1: VIBRATION FREQUENCIES AND THE LIKELY CAUSES 
Frequency in 
Terms Of RPM 
Most Likely causes Other possible causes & Remarks 
43
1x RPM Unbalance 1) Eccentric journals, gears or pulleys 
2) Misalignment or bent shaft if high axial 
vibration 
3) bad belts if RPM of belt 
4} Resonance 
5) Reciprocating forces 
6) Electrical problems 
2 x RPM Mechanical looseness 1) Misalignment if high axial vibration 
2) Reciprocating forces 
3) Resonance 
4) bad belt if 2 x RPM of belt 
3 x RPM Misalignment Usually a combination of misalignment and 
excessive axial clearance (looseness). 
Less than 
1x RPM 
Oil Whirl {Less than 
1/2 x RPM 
1) Bad drive belts 
2) Background vibration 
3) Sub-harmonic resonance 
4) "Seat" Vibration 
Synchronous 
(A.C line 
frequency) 
Electrical Problems Common electrical problems include broken rotor 
bars, eccentric rotor, and unbalanced phases in 
poly-phase systems, unequal air gap. 
2xSynch. 
Frequency 
Torque Pulses Rare as a problem unless resonance is excited 
Many Times 
RPM 
(Harmonically 
Related Freq.) 
Bad Gears 
Aerodynamic Forces 
Hydraulic forces 
Mechanical 
Looseness 
Reciprocating Forces 
Gear teeth times RPM of bad gear 
Number of fan blade times RPM 
Number of impeller vane times RPM 
May occur at 2, 3, 4 and sometimes higher 
harmonics if severe looseness 
High Frequency 
(Not Harmoni-cally 
Related) 
Bad Anti-Friction 
bearing 
1) Bearing vibration may be unsteady amplitude 
and frequency 
2) Capitation, recirculation and flow turbulence 
causes random high frequency vibration 
3)Improper lubrication of journal bearings 
4)rubbing 
Comparing Tri-Axial (Horizontal, Vertical and Axial) Data 
Not only can specific vibration problems be recognized by their specific frequency 
characteristics, but in many cases by the direction in which the vibration occurs. This is why it is 
necessary to take analysis data in the horizontal, vertical and axial directions - to further the 
44
process of elimination. 
Table 5.1 shows a typical "set" of tri-axial data taken on one bearing of a belt driven fan 
operating at 2200 RPM. Of course similar data would be taken on the, other fan bearing as well 
as the motor bearings. "Stacking" the horizontal, vertical and axial data for a particular bearing 
on the same sheet as shown, greatly simplifies the comparison. Note 
That the same full-scale amplitude range (0 to 0.3 in/sec) was used for all the data to 
further simplify the comparison. 
There are basically two comparisons that need to be made from the data in Figure 5-2. First, how 
do the horizontal and vertical readings part; and secondly, how do the radial readings (horizontal 
and vertical) compare1 to the axial readings. 
Fig 5.2: Typical tri-axial data taken on a belt-driven fan 
Comparing Horizontal and Vertical Readings 
When comparing the horizontal and vertical data, it is important to take note of how and 
where the machine is mounted and also, how the bearings are mounted to the machine. 
Basically, the vibration analyst needs to develop a "feel" for the relative stiffness between the 
horizontal and vertical directions in order to see whether the comparative horizontal and vertical 
45
readings indicate a normal or abnormal situation. Machines mounted on a solid or rigid base 
may be evaluated differently than machines mounted on elevated structures or resilient vibration 
isolators such as rubber pads or springs. 
To explain the significance of machine stiffness, assume that the fan in Figure 5-1 is 
mounted on a rigid, solid concrete base which, in turn, is mounted on a solid foundation located 
at ground level. This would be regarded as a "rigid" installation and under normal conditions the 
vertical stiffness would be greater than the horizontal stiffness. If such is the case/one would 
expect that normal problems, such as unbalance, would cause higher amplitude of vibration in 
th2 horizontal direction than the vertical direction, if a rigidly mounted machine has higher 
vibration in the vertical direction than the horizontal direction, this would generally be 
considered as 'abnormal', and may indicate a looseness or weakness condition. On the other 
hand, if this same machine was mounted on springs or rubber pads, a higher amplitude in. the 
vertical direction may not be considered unusual or an indication of structural problems. 
Another factor that needs to be considered is the "ratio" between the horizontal and vertical 
Amplitudes. As explained, it is not unusual for rigidly mounted machines to have higher 
amplitudes of vibration in the horizontal direction, compared to the vertical direction. However, 
the ratio between the horizontal and vertical amplitudes should be checked to see if it is normal 
or indicative of some unusual problem. As a normal unbalance response, it is not unusual for ma-chines 
to exhibit ratios between the horizontal and vertical amplitudes of 1:1, 2:1, 3:1 or 4:1, 
depending on the particular installation. In other words, it would not be unusual for a rigidly 
mounted fan, motor or pump to have a vibration amplitude at 1 x RPM as much as 4 times higher 
in the horizontal direction than the vertical direction due to unbalance. Ratios beyond 4:1 
somewhat unusual and typically indicate an abnormal condition such as looseness or resonance. 
Comparing Radial (Horizontal & Vertical) Data to Axial Data 
The second important comparison that needs to be made to tri-axial analysis data is how the 
radial (horizontal and vertical) readings compare to the axial readings. Relatively high 
amplitudes of axial vibration are normally the result of: 
1. Misalignment of couplings 
46
2. Misalignment of bearings 
3. Misalignment of pulleys or sheaves on belt drives 
4. Bent shafts 
5. Unbalance of "overhung" rotors such as the fan in Figure 5.1 
A general rule, any time the amplitude of axial vibration exceeds 50% of the highest radial 
(horizontal or vertical) amplitude, the possibility of a misalignment or bent shaft condition 
should be considered.) CM course, extremely high amplitudes of axial vibration may also be due 
to resonance or unbalance of an overhung rotor. Verifying the cause of a high axial vibration 
using "phase analysis" techniques will be covered in the sections to follow. 
Examining the axial vibration in the examples given in Figures, it can be seen that in neither 
instance is the amplitude of axial vibration greater than 50% of the highest radial amplitude. As a 
result, misalignment or bent shaft Conditions are not indicated examples. 
'Where Do Multiple Harmonic Vibration Frequencies Come From? 
Something that often worries or confuses the beginning vibration analyst is the appearance 
of numerous "harmonic" frequencies that sometimes appear in their FFT analysis data. A good 
example is the frequency analysis data presented in Figure -5-3. Although the predominant 
vibration is clearly 2200 CPM (1 x RPM of the fan), vibration frequencies can also be seen at 
4400 CPM (2 x RPM), 6600 CPM (3 x RPM) and 8800 CPM (4"x RPM). Although their 
amplitudes are considerably lower than that at 1 x RPM, these "harmonic" frequencies are very 
important and should not be ignored, as will be explained in the following Paragraphs. 
The presence of multiple or "harmonically" related vibration frequencies is not uncommon, 
and their presence in the FFT data can be easily explained by examining the frequency 
characteristics of various vibration waveforms. Figure 5.3 illustrates four (4) different types of 
vibration waveforms — a sinusoidal is a sine wave, a square wave, s triangular or "saw-tooth" 
wave and a spike pulse. These waveforms can be readily generated by various machinery 
problems, depending on the nature of the problem and the extent of the exciting forces. The '1 
Linda -mental" frequency of each of the waveforms in Figure 5-3 is the same; however, the 
frequencies presented in the FFTs will be considerably different. 
47
Fig 5.3: Different wave forms result in different frequency characteristics 
A sinusoidal or "sine" wave could be the result, of a simple unbalance or misalignment 
problem. If a frequency analysis (FFT) is performed on a true sinusoidal waveform, the result 
will be a single frequency of vibration with certain amplitude and NO multiple frequencies. 
By comparison, a frequency analysts (FFT) of & square waveform will not only display 
the fundamental frequency (1x), but the odd multiple or harmonic frequencies as well (i.e. 3x, 
5x, 7x, etc.). The number of odd multiple frequencies present in the FFT data will depend on 
how close the waveform is to a true square wave, the intensity or amplitude of the vibration and 
the response characteristics (peak or RMS) of the instrument as well as its dynamic range. Figure 
4-8 shows a 6000 CPM (1 00 Hz) square waveform signal obtained from an electronic signal 
generator along with the FFT frequency analysis. Note that the frequency analysis not only 
includes the fundamental frequency of 6000 CPM, but the odd multiples as well (i.e. 18,000 
CPM, 30,000 CPM, 42,000 CPM, etc.). One possible explanation (or a square wave vibration 
would be an unbalance condition combined with system looseness. If the unbalance force was 
great enough, the machine could literally be lifted off the foundation and held to the limit of 
looseness until the unbalance force has rotated to a position where the upward force is reduced, 
allowing the machine to drop. Another possibility is a mild rubbing condition that might "flatten" 
the unbalance sine wave whenever the rub occurs. 
The fundamental (1x) frequency accompanied by the odd multiple or harmonic 
48
frequencies, similar to a square wave. However, the amplitudes of the odd harmonics of a 
triangular waveform decrease more quickly at higher frequency than do those of a square 
waveform as shown in Figure 5-3. Triangular or saw tooth waveforms can also be generated by 
conditions such as looseness or excessive bearing clearance that result in "distortion" of an 
unbalance sine we Here also, the number of odd multiple frequencies that accompany the funda-mental 
frequency will depend not only on the amplitude of the fundamental frequency, but the 
dynamic range and circuit response characteristics (peak RMS) of the analysis instrument. 
Some problems such as a cracked or broken tooth on a gear, or a flaw on a bearing 
raceway or rolling element, will generate vibration in the form of impact or spike-pulses. A 
frequency analysis or FFT of a spike-pulse signal will reveal the fundamental impact frequency, 
followed by the entire multiple or harmonic frequencies (i.e. 2x, 3x, 4x, 5x, 6x, etc.) as shown in 
Figure 4-3. As before, the number of harmonic frequencies evident in the FFT will depend on 
the amplitude of the fundamental component and the dynamic range and circuit response 
characteristics (peak or RMS) of the analysis instrument. 
The presence of multiple, harmonic frequencies in an FFT are definitely important and 
should not be ignored, even though their amplitudes may be considerably less than that of the 
fundamental frequency. Their mere existence indicates that the vibration is not a true sine wave, 
and may provide clues to other significant problems such as looseness conditions, gear tooth 
problems, bearing problems, etc. In the case of the belt driven fan in Figure 5-1, the harmonic 
frequencies only appeared at the drive-end bearing (bearing C). Ultimately, the problem was 
found to be a loose pulley on the fan shaft, which was allowing the pulley to "rattle" on the shaft 
during rotation. This caused a spike-pulse distortion of the unbalance sine wave, resulting in the 
harmonic vibration frequencies. Once the set-screws were tightened securing the pulley to the 
shaft, the multiple harmonic frequencies totally disappeared, leaving only the 1 x RPM 
unbalance vibration frequency. 
Distortion of a sinusoidal vibration waveform, resulting in multiple vibration frequencies, 
may not only be the result of mechanical problems such as looseness, bearing defects, rubbing or 
gear defects as described above. (Waveform distortion can also result from the setup and 
operation of the vibration analysis equipment. For example, if a magnetic holder is being used to 
mount the vibration accelerometer to the machine, any looseness or rocking of the magnet on the 
surface of the machine can result in the appearance of multiple frequencies in the analysis data. 
49
In addition, if the amplitude of machine vibration exceeds the full-scale amplitude range selected 
on the analyzer instrument, the true vibration signal may be "chopped", resulting in multiple 
frequency components in the FFT data that do not physically exist. For example, if the actual 
level of machine vibration was 1.0 in/sec but the analyzer was set for a 0.3 in/sec full-scale 
range, the vibration signal would be chopped off, creating an approximate square waveform. The 
result, of course, would be odd multiple frequencies in the analysis data that do not actually 
exist. 
Side-Band Frequencies 
"Side-band" frequencies are an additional vibration frequency that often appears FFT data 
that can be confusing to the beginning vibration analyst. Side band vibration frequencies are the 
result of a variation in the amplitude of given vibration frequency signal as a function of time. 
This variation in amplitude with time is also called "amplitude modulation". For example, 
consider a Rolling element bearing with a significant flaw or defect on the rotating inner 
raceway.) 
Fig: 5.4 spike pulses due to flaw on the inner race of the bearing 
As the inner raceway rotates, spike pulses will be generated each time a rolling element 
impacts the flaw. However, the amplitude or intensity of the pulses generated will vary as the 
defect rotates into and out of the load zone of the bearing. This is shown in Figure. 
Impacts that occur when the defect is within the load zone will obviously be mw intense 
than those that occur out of the load zone. The result is a modulation the fundamental bearing 
defect frequency. The fundamental bearing defect frequency in this case is the frequency at 
which rolling elements impact the inner raceway flaw and is called the "ball passing frequency of 
the inner raceway" or simply BPFI. When discussing side-band frequencies, the fundamental 
bearing frequency in this case would be called the "carrier" frequency. The frequency at which 
50
the amplitude of the carrier frequency varies is called the "modulating" frequency. The 
modulating frequency in the case of a defect on the inner raceway will be 1 x RPM, since the 
defect is rotating into and out of the bearing load zone at the rotating speed of the shaft. 
5.7 DETERMINE IF THE VIBRATION IS DIRECTIONAL OR NON-DIRECTIONAL 
In addition to a comparison of tri-axial (horizontal, vertical and axial data) other analysis 
techniques such as simple probing studies has been discussed to show how the list of possible 
problems can be reduced. A vibration frequency of 1 x RPM is probably the most common 
"predominant" vibration encountered during analysis because so many different yet common 
day-to-day problems can cause it. These problems include. 
1. Unbalance 
2. Bent shafts 
3. Misalignment— of couplings, bearings and pulleys. 
4. Looseness 
5. Resonance 
6. Distortion—from soft foot or piping strain conditions 
7. Eccentricity---of pulleys and gears 
8. Reciprocating forces 
Of all the problems listed above, the only ones that generate uniform radial forces and 
resultant vibration are unbalance and bent shafts. All of the remaining problems typically 
generate forces and resultant vibration which is very highly directional in nature. Therefore, 
determining whether or not the radial vibration directional or non-directional can be an 
extremely valuable analysis tool in reducing the list of possible problems. 
To explain the difference between directional and uniform or non-directional vibration, consider 
the response of a machine to a simple unbalance problem. An unbalance condition generates a 
certain amount of radial force which is governed by the amount of unbalance weight (ounces, 
grams, etc.), the radius of the weight or its distance from the shaft centerline and the rotating 
speed (RPM) of the machine. 
In any case, an unbalance generates a fixed amount of force that is simply changing in 
direction with shaft rotation. If the stiffness of the machine was the same in the horizontal and 
51
vertical directions, the machine would literally move in a circular path, and the radial vibration 
amplitudes would be the same in all radial directions. Of course, the horizontal and vertical stiff 
nesses will probably not be exactly the same, so the radial motion will probably be somewhat 
elliptical, resulting in slightly different amplitudes measured in various radial directions. In any 
case, a simple unbalance, uncomplicated by other problems, generates a fairly uniform, non-directional 
radial vibration. In terms of radial vibration, a bent shaft reacts in much the same way 
as simple unbalance. However, remember ' from our earlier discussion that a bent shaft will also 
be characterized by relatively high axial vibration amplitudes as well. 
Compared to unbalance and bent shafts, the other listed causes of 1 X RPM Vibration 
DOES NOT generate uniform radial vibration. Instead, they create radial vibration which is very 
highly directional. For example, consider the radial vibration generated by coupling 
misalignment. When a coupling is misaligned, obviously it is misaligned in a certain direction. 
As a result, the radial forces and, hence, the radial vibration will be most pronounced in the 
direction of misalignment. 
Similar to coupling misalignment, a distortion problem from a soft foot or piping strain 
problem creates misalignment. Of the machine's bearings in a certain direction with the result 
being highly directional radial vibration. 
An eccentric pulley used in a "V" belt drive produces variations in belt tension with each 
revolution, causing a highly directional vibration measured in the direction of belt tension. An 
eccentric gear creates directional forces due to the "cam-like" action with the mating gear, 
similar to an eccentric pulley. Unbalanced reciprocating forces due to misfiring, valve leakage 
and other operational problems with engines and reciprocating compressors generate vibration in 
the direction of reciprocation which are, of course, highly directional. Structural looseness or 
weakness problems such as loose mounting bolts or deterioration in grouting, simply allow the 
machine more freedom to move in the direction of the looseness. Although some other exciting 
force must be present, such as unbalance, structural looseness usually results in highly 
directional vibration. 
Detecting Directional versus Non-Directional Vibration 
There are basically three ways to determine whether the vibration of a machine reasonably 
uniform or highly directional in nature. These include: 
52
1. A comparison or horizontal, vertical and axial FFT data 
2. Comparing the horizontal and vertical phase measurements 
3. Multiple radial amplitude measurements 
Comparing Horizontal and Vertical Phase Readings 
Figure 5-5 illustrates two types of radial vibration—uniform and highly directional. Of course, 
uniform or reasonably circular radial vibration is typically the result of a simple unbalance 
problem. Phase measurements, which were discussed, are obtained by either triggering a 
stroboscopic (strobe) light with the vibration signal or by comparing the vibration signal with a 
Fig: 5.5 Comparative horizontal and vertical phase readings are used to distinguish between 
uniform and highly directional radial vibration 
refer pulse such as that obtained with a photo-electric pickup (photocell) or laser In any case, 
phase was described as the "relative" motion of two or more parts of a machine. However, phase 
can also describe how a single element of a machine is vibrating, such as a bearing. In other 
words, comparative phase measurements taken in the horizontal and vertical directions of a 
particular bearing can reveal whether the bearing is vibrating in a highly directional or a reason 
uniform manner. 
In the case of a normal unbalance, it is the "heavy spot" of unbalance that; dually causes 
the vibration. And, since it is the vibration signal that triggers the strobe light or is compared to 
the reference pulse, it can be said that, indirectly, the heavy spot is responsible for the ultimate 
phase angle measurement. With this in mind then, it should be apparent that if the machine 
bearing is vibrating in a reasonably uniform or circular pattern, from the time that the heavy spot 
rotated to a position to cause the machine to move horizontally, the heavy spot had to rotate an 
53
additional 1 /4 revolution or 90 degrees to cause it to move vertically. Therefore, if the machine 
is, in tact, vibrating radially in a reasonably uniform or circular manner, a comparison of phase 
readings taken in the horizontal & vertical directions should show a difference of approximately 
90 degrees. 
Of course, even with simple unbalance, the stiffness in the horizontal and vertical 
directions will probably not be exactly the same and, as a result, the radial motion will probably 
not be a perfect circle. Therefore, when comparing phase readings taken in the horizontal and 
vertical directions, the phase difference may not be exactly 90 degrees. Because the radial 
motion may not be a perfect circle, a tolerance or plus or minus 30 degrees is normally allowed. 
In other words, comparative horizontal and vertical phase readings between 60 degrees and 120 
degrees indicate a fairly uniform radial vibration or one that is NOT highly directional. 
In the case of highly directional radial vibration, comparative horizontal and vertical phase 
readings will either be nearly the same (0 degrees difference) or 180 degrees out-of-phase, 
depending on which side of the machine bearing the readings are taken. Referring to Figure 4-5, 
if the vibration was occurring virtually along the straight line designated "A", the machine would 
reach its maximum motion toward the horizontal measurement location at exactly the same 
instant it reached its maximum motion toward the vertical measurement location. In this case, 
comparative horizontal and vertical phase measurements would be the same (i.e. differ by 0 
degrees). However, if the directional vibrate was occurring along the straight line designated as 
"B", then at the exact instant the machine reached its maximum motion towards the horizontal 
measurement location, it would have reached its maximum location away from the vertical 
measurement location. In this case, comparative horizontal and vertical phase readings would 
differ by 180 degrees. 
In summary, a simple comparison of horizontal and vertical phase readings can quickly 
tell whether the radial vibration is fairly uniform or highly directional. In addition, it should be 
pointed out that it does not make any difference how the machine is vibrating radially relative to 
the directions of vibration measurement. Any time the ratio between the maximum and minimum 
radial vibration amplitude exceeds much beyond 5:1, comparative horizontal and vertical phases 
readings will indicate a highly directional vibration by virtue of a 0 degree or 180 degrees phase 
comparison. 
5.8 IDENTIFYING THE MOST COMMON MACHINERY PROBLEMS 
54
5.8.1 Vibration due to Unbalance 
Unbalance of rotating machine components is, perhaps, the easiest problem lo pinpoint with 
confidence. Simple unbalance, uncomplicated by other problems, can be readily identified by the 
following characteristics: 
1. The vibration occurs at a frequency of 1 x RPM of the unbalanced component. The presence 
of multiple, harmonic frequencies (i.e. 2x, 3x, 4x, times RPM) usually indicates additional 
problems such as looseness, rubbing, etc 
2. The radial vibration is reasonably uniform and not highly directional. A comparison of 
horizontal and vertical phase readings will normally show a difference between 60 degrees and 
120 degrees. If comparative horizontal and vertical phase readings can not betaken, multiple 
radial amplitude readings should not show a discrepancy in excess of 5:1. 
3. If a specific machine component such as a motor or fan is the source of unbalance, that 
component will! Have significantly higher amplitudes of vibration at the 1 x RPM frequency. 
Unbalance of couplings will likely reveal comparable amplitudes on both the driver and driven 
machine components. 
Unbalance conditions can often be affected by other operating conditions such as load or 
temperature. For example, machines operating at elevated temperatures can physically distort or 
change shape due to thermal changes, resulting!! a change rotor balance. Large, fabricated boiler 
draft fans must often be balanced at operating temperature due to thermal distortion. They may 
run smoothly when cold but vibrate excessively when hot. 
In addition, due to minor variations in the track and pitch-angle of the fan blades. Large 
fabricated fans may show significant changes in the unbalance vibration characteristics with 
changes in flow conditions. In other words, a change in the damper setting may result in a 
significant change in the unbalance amplitude & phase characteristics. Such affects are referred 
to as "aerodynamic unbalance', and [joint out the importance of balancing a rotor under its 
normal operating conditions of temperature and flow conditions. 
5.8.2 Bent Shaft Problems 
Bent shafts are a common problem encountered on machinery, and are often the result of 
manufacturing errors or mishandling and damage during transportation or machine installation. 
55
In addition, a rotor may "bow" as the result of thermal distortion at elevated temperatures or due 
to excessive unbalance forces. 
Fig: 5.6 uneven rotor and bent shaft problems 
Regardless of the cause, bent shafts will usually generate a predominant vibration at 1 x RPM, 
very similar to simple unbalance. And, like unbalance, the radial vibration caused by a, bent shaft 
will be fairly uniform and not highly directional. However, unlike unbalance, bent shaft 
conditions will normally cause a relatively significant vibration in the axial direction as well. As 
staled earlier, any time the amplitude of vibration measured in the axial direction exceeds 1/2 
(50%) o! the highest measured radial vibration, a bent shaft is a very possible cause. 
Because bent shafts cause significant vibration in the axial direction, a bent shaft problem 
can normally be verified using a phase analysis of the axial vibration. However, there are 
actually two different types of bent shaft conditions: 
1. Rotors that have a simple "bow and: 
2. Shafts that have a bend or "kink", but only near a particular bearing. 
Each type of bend will result in significant axial vibration, but each type will cause the 
various bearings of the machine to vibrate in the axial direction in a notice-ably different manner. 
Therefore, an axial phase analysis cans not only verity a bent shaft condition, but can also help in 
identifying the nature and location of the bend as well. 
56
5.8.3 Shaft with a Kink or Bend Close To the Bearing 
The axial vibration caused by a bent shaft can actually occur in two different ways. 
Normally, if the bend is fairly close to a particular bearing, such as a "kink" in the stub shaft of a 
motor or pump caused by bumping the shaft during transportation or installation, the bearing will 
tend to vibrate axially in a "twisting", motion This twisting motion can be easily recognized by 
taking comparative axial phase measurements at multiple axial positions as shown in Figure 4.7. 
Four axial phase readings at each bearing of the machine are recommended; however, physical 
constraints may make it impossible to take all the readings desired. In any case, more than one 
axial phase reading is needed, so try to take &s many as possible. 
If the bearing is, in fact, "twisting" due to a kink in the shaft that is very close or actually 
through the bearing itself, the result will be a drastic difference in the phase readings obtained at 
the four axial positions, as shown in Figure 5-7. In Figure 5-8, it can be seen that the upper and 
lower measurement points {1 and 3) are actually 180 degrees out-of-phase, as are the 
measurement points on opposite sides of the shaft (2 and 4). This clearly indicates that the 
bearing is vibrating axially in a twisting fashion. Further verification of a bend or "kink" in the 
shaft can be carried out using a dial indicator. 
Fig 5.7: four axial phase readings at each bearing are needed to see how each bearing is vibrating 
axially 
57
Fig 5.8: These axial phase readings show a twisting axial motion. 
Bearings that are "cocked" in the machine housing may also cause significant vibration 
amplitudes in the axial direction, and may reveal the same "twisting" action as that caused by a 
kinked shaft. However, a cocked or misaligned bearing can usually be distinguished from a 
kinked shaft by comparing the amplitudes of vibration measured at the four axial positions. 
Normally, if a bearing is cocked in the housing, it will be cocked in a specific direction and show 
a significant difference in the amplitudes measured at the four axial positions. On the other hand, 
a shaft that has a simple bend or "kink" will reveal fairly uniform amplitudes in the four axial 
positions. 
5.8.4 Identifying a Simple Shaft Bow 
A shaft that has a simple bow may not cause the supporting bearings to vibrate axially in 
a "twisting" type of motion. Instead, a simple bow may cause the supporting bearings to vibrate 
axially in a "planer" fashion 
In order to identify a simple bow as the cause of high axial vibration, it will be necessary 
to compare the "relative" axial motion of the support bearings. If the shaft is simply bowed, the 
supporting bearings of the rotor will reveal a substantial "out-of-phase" condition. Although a 
pronounced bow may reveal as much as a 180 degrees difference in the axial phase of the rotor 
supporting bearings, an out-of-phase condition of only 90 degrees or more is significant enough 
to indicate a possible bow in the shaft. Run out checks with a dial indicator should be performed 
to verify the bent shaft condition—especially if the amplitudes of axial vibration far exceed 50% 
of the highest radial amplitudes. 
When comparing the axial phase readings at the supporting bearings of a rotor, it is most 
important to keep in mind the direction of the transducer. To illustrate, when taking axial phase-readings 
on the left side bearing of the rotor, the vibration transducer may have been pointing to 
the right. However, when axial phase readings were taken on the right side bearing, it may have 
been necessary to point the vibration transducer to the left. If this was the case, it will be 
necessary to correct the phase readings for one of the bearings by 180 degrees to compensate for 
the necessary 180 degree change in transducer direction. Of course, if the direction of the pickup 
axis can be kept the same at all bearing locations, then no correction factor is necessary. 
58
5.8.5 Vibration Due to Misalignment 
Surveys have shown that at the beginning stages of most predictive maintenance programs, 
misalignment of direct coupled machines is by far the most common cause of machinery 
vibration. In spite of self-aligning bearings and flexible couplings, it is difficult to align two 
shafts and their bearings so that no forces exist which will cause vibration. Although machines 
may be well aligned initially, several factors can affect alignment, including: 
Fig: 5.9 parallel misalignment and angular misalignment 
1. Operating temperature: Machines aligned when cold may "grow" out of alignment due to 
variations in thermal conditions, 
2. Settling of the base or foundation 
3. Deterioration or shrinkage of grouting 
The following are general characteristics to look for: 
1. The radial vibration caused by coupling misalignment is typically highly directional on both 
the driver and driven units. Misalignment occurs in a certain direction and, as a result, the radial 
forces are not uniformly applied in all radial directions like that from unbalance. 
2. The vibration frequencies due to misalignment are usually 1 x, 2x and 3x RPM, and may 
appear in any combination depending on the type and extent of misalignment. 
Angular misalignment normally causes vibration at 1 x RPM, whereas offset or parallel 
misalignment causes vibration predominantly at 2 x RPM. In fast, offset misalignment is 
probably the most likely cause of a predominate 2 x RPM vibration. Combinations of angular 
and offset misalignment may show combinations of 1x and 2 x RPM and in some cases even 1x, 
59
2x and 3 x RPM. 
3. Whenever misalignment is suspected, an axial phase analysis comparing the relative axial 
motion of the driver and driven units can be most helpful. As stated earlier, "for every action 
there is an equal but opposite reaction". As a. result, misalignment problems will normally 
reveal a significant phase difference  up to 180 degrees. However, phase differences as little 
as 60 degrees Tin relative axial motion is sufficient to suggest misalignment. 
5.8.6 Vibration Due To Looseness 
Excessive vibration may exist due to looseness conditions; however, looseness is not the 
actual cause of the vibration. Some other exciting force such as unbalance or misalignment must 
be present to actually cause the vibration. 
Fig: 5.10 vibrations due to looseness (excessive clearance in bearings and loose bolts) 
Looseness is simply a loss or reduction in the normal stiffness of the machine or system, 
perhaps due to loose mounting bolts, cracks in the base or foundation, deterioration in grouting, 
cracked welds, loose lags or anchors or rotors loose on the shaft. Looseness conditions simply 
allow whatever exciting forces that exist in the machine to exhibit or generate higher amplitudes 
of vibration than they would if no looseness problems existed. If the predominate exciting force 
is an unbalance at 1 x RPM, then the predominate vibration due to looseness would be 1 x RPM 
in this case. However, if the predominate exciting force is occurring at 2 x RPM due to an offset 
misalignment, then the looseness would occur at a frequency of 2 x RPM. Looseness does not 
have to occur at a frequency of 2 x RPM as many published vibration diagnostic charts would 
lead one to believe. 
Two general types of looseness are: 
1. Looseness associated with the rotating system, including rotors loose on the shaft, bearings 
loose on the shaft or in the machine housing and excessive sleeve bearing clearance. 
60
2. Looseness of the support system of a machine such as loose mounting bolls, grouting 
deterioration or cracks in the structure. 
Mechanical Looseness and "Sub harmonic" Frequencies 
On occasion, certain looseness conditions can also result in "sub harmonic" Frequencies 
of vibration (i.e. 1/2, 1/3, or 1/4 x RPM) with frequencies at 1/2 x RPM being the most common. 
For example, there have been many reported cases of excessive wear and clearance in sleeve 
bearings of large motors that have resulted in vibration frequencies of 1/2x, 1x, 1-1/2x, 2x, 2- 
1/2x, 3x, 3-1/2x and Higher orders of 1/2 x RPM. Why and how vibration frequencies at 
multiples of ' half-order (1/2 x RPM) are generated has never been fully explained. However, 
when detected, possible looseness conditions including bearing clearance Problems should be 
suspected. 
5.8.7 Vibration Due To Eccentricity 
Of course, no rotor or shaft can be made perfectly round. Some eccentricity or "out-of-roundness" 
will be present on nearly every rotating assembly. Eccentricity is a common cause of 
unbalance, and for common machines such as fans, blowers, pumps, etc., normal balancing 
procedures can be carried out to minimize the effects of eccentricity. However, in certain 
situations, eccentricity can result in "reaction" forces that can not be totally compensated by 
simply balancing the rotor. Probably the most common examples are eccentric belt pulleys and 
chain sprockets, eccentric gears and eccentric motor armatures. 
In the case of an eccentric belt pulley or chain sprocket, each revolution of the eccentric 
pulley or sprocket will cause a variation in belt or chain tension. The result will be a vibration 
frequency at 1 x RPM of the eccentric element, with a directional force on a line between the 
centers of the driver and driven pulleys or sprockets. Although this could be easily mistaken as 
an unbalance problem, a simple test for- the directionality of the radial vibration by taking 
comparative horizontal and vertical phase readings or by taking multiple radial amplitude 
readings will quickly reveal the highly directional nature of the vibration. Slow motion studies 
with a stroboscopic light or run out checks with a dial indicator will confirm the eccentricity 
problem. 
61
Fig: 5.11 Vibrations Due To Eccentricity 
Eccentric gears will cause highly directional vibration at 1 x RPM of the eccentric gear in 
a manner similar to that of eccentric belt pulleys and chain sprockets, and can be identified by 
taking comparative horizontal and vertical phase readings or by taking multiple radial amplitude 
readings as described earlier. 
5.8.8 Vibration Due To Resonance 
Resonance is a very common cause of excessive vibration on machines because 
1. Machines consist of many individual elements or components such as suction and discharge 
piping, bearing pedestals, bases, and accessory items such as exciters and lube oil pumps, etc... 
Of course, each component has its own mass and stiffness characteristics and, hence, its own 
unique natural frequency. 
2. The stiffness of each machine component is different in different directions. As a result, each 
machine component will likely have several different natural frequencies. For example, consider 
a fan bearing. Most likely, the stiffness of the bearing will be different in the horizontal, vertical 
and axial directions. As a result, the natural frequencies of this particular machine component 
will also be different in the horizontal, vertical and axial directions. 
When one considers all of the various machine components, along with the multiple 
natural frequencies possible for each component, the reason that resonance is such a common 
problem is quite understandable. All that is required is that the natural frequency of one machine 
component, in one of its directions of vibration, be the same as one exciting force frequency 
62
inherent to the machine, when this happens, resonance and high levels of vibration will result. 
Although machines that are installed and brought into service may not exhibit resonance 
problems initially, resonance may become a problem in the future if changes in machine stiffness 
occur as the result of bearing wear, grouting deterioration, loosening of mounting bolts or other 
problems. 
5.8.9 Vibration due to defective rolling element bearings 
When a rolling element bearing develops flaws on the raceways and/or rolling elements, 
there are actually a number of vibration frequency characteristics that can result depending on 
the extent of deterioration. 
5.12 vibrations due to worn rollers, worn gear teeth and worn belts 
Thus, identifying these characteristic frequencies cannot only help to verify that a bearing 
is definitely failing, but can also give some indication of the extent of deterioration. The 
following is a discussion of the four stages that a bearing will typically go through from the 
earliest stage of deterioration to that approaching catastrophic failure. Catastrophic failure id 
defined here as simply the total in ability of the bearing to perform its intended functions of 
minimizing the friction generated through rotating motion and keeping rotating and non-rotating 
parts from coming into contact with one another. In other words, failure will occur when either 
the bearing literally comes apart or seizes due to excessive heat build up. 
5.9 VIBRATION ANALYSIS 
5.9.1 Introduction 
63
Interpreting vibration characteristics carries out diagnostics studies based on vibration 
analysis. The following vibration characteristics are utilized to interpret the machinery health 
condition. 
1. Vibration displacement 
2. Vibration velocity 
3. Vibration acceleration will include the health condition. 
4. Vibration frequency will indicate the defect 
5. Vibration base will help to indicate the defective location 
5.9.2 Dominant Frequency 
It is sometimes useful to know the dominant frequency of vibration of a machine that has 
several rotating parts. Consider for example a belt driven blower. The motor and fan run at 
different speeds. The dominant frequency will reveal which part of the machine is causing the 
most vibration. The measurements taken on the motor bearings would include vibration of the 
motor plus vibrations from the fan transmitted through the drive belt and mounting structure. 
Conversely, measurement taken on the fan bearings would include vibrations of the fan plus 
vibrations transmitted from the motors as shown in the figure. In many cases the point with the 
most vibration would pin point which part has the trouble, but not always. Measurements taken 
on the fan contains vibrations of the fan plus transmitted vibrations from the motor. 
The following sequence is used to find the dominant frequency: 
1. Measure and record the displacement (D) at a given point. 
2. In same manner and at the same point, measure and record the velocity (V). 
3. The dominant frequency can be found by dividing the velocity measurement (V) by the 
displacement measurement (D) and multiplying by the constant 19100. The answer will be the 
dominant frequency of vibration in cycles per minute. 
Dominant frequency (CPM) = 
velocity (V) millimeters/second x 19100 (metric units) 
64
Displacement (D) micrometers 
For example, if the motor runs at 1750 RPM and the fan at 2600 RPM. Measurements 
taken on the motor are displacement (D) = 47 micrometers and velocity (V) = 6.5 millimeters / 
seconds. 
The dominant frequency then becomes: 
(6.5/47) XI 9, 120 =2,644 cpm 
2644 CPM is nearest the fan speed. The fan is the dominant part and is causing vibration. 
Generally the dominant frequency will be equal to the rotating speed of the part cause the 
vibration, assuming that the trouble is unbalance. In any event the dominant vibration frequency 
will normally be some multiple of RPM of the part. After determining the dominant frequency, 
the type of the trouble present may be assumed from the following table. 
65

24167132 chapter-5

  • 1.
    CHAPTER 5.0 VIBRATIONANALYSIS 5.1 INTRODUCTION There are literally hundreds of specific mechanical and operational problems that can result in excessive machinery vibration. However, since each type of problem generates vibration in a unique way, a thorough study of the resultant vibration characteristics can go a long way in reducing the number of possibilities—hopefully to a single cause. A simple, logical and systematic approach that has been proven successful in pinpointing the vast majority of the most common day-to-day machinery problems. 5.2 DEFINE THE PROBLEM The following lists some of the reasons for performing a vibration analysis: 1. Establish "baseline data" for future analysis needs. At the beginning of a predictive maintenance program, even machines in good operating condition should be thoroughly analyzed to establish their normal vibration characteristics. Later, when problems do develop, this baseline information can be - extremely useful in performing a follow-up analysis to show precisely the vibration characteristics that have changed. 2. Identify the cause of excessive vibration. Referring to the vibration severity guidelines machines in service that have vibration levels in the "rough" regions or greater should be thoroughly. Analyzed to identify existing problems for immediate correction. Once corrections have been made, a follow-up analysis should be performed to insure that problems have been solved and the machine returned to satisfactory condition. If all significant problems have been solved, the follow-up analysis data will serve as the baseline data for future analysis as outlined in (1) above. 3. Identify the cause of a significant vibration increase. Once a developing problem has been detected by routine, periodic checks, the obvious next step is to perform a detailed vibration analysis to identify the problem for correction. Here also, a follow-up analysis will verify that the problems have been corrected and provide a baseline for future comparison 36
  • 2.
    4. Identify thecause of frequent component failures such as bearings, couplings, seals, shafts, etc. 5. Identify the cause of structural failures such as the structure or foundation, piping etc. 6. Identify the source of a noise problem. 5.3 DETERMINE MACHINE DETAILS Some of the important detailed features of the machine that need to be known for Accurate analyses include: 1. The rotating speed (RPM) of each machine component: Of course, direct-coupled machines have only one rotating speed (RPM) that needs to be known. However, machines that include gear drives will have more than one.' For single gear increasers or reducers, both the input and output speeds are needed. For multiple gear increasers or decreases, the rotating speeds of the various intermediate gears must be known along with the input and output speeds. 2. Types of bearings: Of course worn or defective sleeve or plain bearings will have different vibration characteristics than defective rolling-element bearings. Therefore, it is most important to know whether the machine has plain or rolling element bearings. If the machine has rolling-element bearings, it is also beneficial to know the number of rolling elements and other details of bearing geometry; with this information, the vibration analyst can actually calculate the frequencies of vibration caused by specific bearing defects such as flaws on the outer and inner raceways, rolling elements, etc. Details on determining specific bearing defect frequencies are presented in the ANALYSIS OF ROLLING ELEMENT BEARINGS section of this chapter. 3. Number of fan blades: Knowing the machine RPM and number of blades on a fan will enable the analyst to easily calculate the "blade-passing" frequency. This is simply the product of the number of fan blades times fan RPM. This frequency of vibration is also called the "aerodynamic pulsation frequency. 4. Number of impeller vanes: Similar to fans and blowers, knowing the number of vanes on a pump impeller allows the analyst to calculate the vane-passing frequency, also called the "hydraulic-pulsation" frequency. 5. Number of gear teeth: The rotating speed and number of teeth on each gear must be known in order to determine the possible "gear-mesh" frequencies. 6. Type of coupling: Gear and other lubricated types of couplings can generate some unique 37
  • 3.
    vibration characteristics whenevertheir lubrication breaks down or if lubrication is inadequate. 7. Machine critical speeds: Some machines such as high speed, multi-stage centrifugal pumps, compressors and turbines are designed to operate at speeds above the natural or "resonant" frequency of the shaft. The resonant frequency of the shaft or rotor is called its "critical" speed, and operating a near this speed can result in extremely high vibration amplitudes. Therefore, knowing the rotor critical speed relative to machine RPM and other potential exciting force frequencies are very important. 8. Background vibration sources: Many times the vibration being measured on a machine is actually coming from another machine in the immediate area. This is particularly true for machines mounted on the same foundation or that are interconnected by piping or other structural means. Therefore, it is important to be aware of potential "background" contributions. This is especially true with machine tools, due to the low levels of vibration required! If possible, the machine under analysis should be shut down and readings taken to directly determine the amount and significance of background vibration. 5.4 VISUAL INSPECTION Before collecting data, the vibration analyst should first make a visual check of the machine to determine if there are any obvious faults or defects that could contribute to the machines condition. Some obvious things to look for include; 1. Loose or missing mounting bolts 2. Cracks in the base, foundation or structural welds 3. Leaking seals 4. Worn or broken parts 5. Wear, corrosion or build-up of deposits on rotating elements such as fans. Slow Motion Studies Another test that is helpful in a visual inspection of the machine is slow motion observation of the various rotating elements of the machine with a high-intensity stroboscopic light. The strobe light must be one that has an adjustable flash rate. Simply adjust the strobe to flash at a rate which is slightly faster or slightly slower than the rotating speed (1 x RPM) of the machine. This will make the rotating components appear to rotate slowly. Slowing down the rotating motion of the machine makes it possible to visually detect 38
  • 4.
    problems that maybe difficult to detect any other way. Visual run out of a shaft may pinpoint or verity a bent shaft condition. Eccentricity of "V" belt sheaves and pulleys can be easily detected in slow motion. Slow motion studies are especially useful in evaluating problems with belt drives. Worn grooves in pulleys or belts with variations in thickness can easily be seen by observing the action of the belt riding up and down in the pulley grooves. On multiple-belt drives, belt slippage can be determined by observing the belts in slow motion. 5.5 PROBING STUDIES The tendency in vibration analysis is to concentrate on analyzing vibration data taken at the bearings of the machine. While this data is definitely an important part of any vibration analysis, in many cases the vibration that is occurring at the machine's bearings is actually the result of problems elsewhere in the "system. For example, in one case a vertical pump had a vibration of 0.7 in/sec measured at the top bearing of the pump motor. However, overall vibration readings taken on the pump base, foundation and piping revealed that the discharge piping was vibrating at a level of 3.0 in/sec or over four times higher than the pump motor itself. The problem turned out to be resonance of the discharge piping and not a problem with the pump itself. The pump and drive motor in this case were simply responding to the piping problem. The only way other problems in the system can be detected, such as the piping resonance described above, is to go looking for them. Depending on the anticipated vibration frequencies, select overall displacement, velocity or acceleration for measurement. Some of the areas that should be checked include: 1. Suction and discharge piping on pumps: Take overall measurements in three directions. On long piping runs, take readings at several locations along the piping. 2. Externally mounted components such as exciters, lube-oil pumps, surge bottles, etc. Here also, take overall measurements in three directions 3. Take overall measurements on nearby machines that may contribute background vibration. If a nearby machine has higher vibration amplitudes than the one being analyzed, it is very likely some of the vibration is coming from the background source. 4. Compare overall vibration readings across all mounting interfaces to detect obvious signs of looseness or weakness. 5. In addition to taking comparative overall readings across the mounting interfaces 39
  • 5.
    To detect Obviouslooseness problems, the vibration, amplitudes taken vertically at The mounting points of a machine, such as the four feet of a motor, can be compared to reveal the possibility distortion or "soft-foot or distortion conditions caused by uneven mounting or foot will usually be indicated if one or more of the feet reveals a significantly higher amplitude than the other feet. If this is defected, the condition should be verified and Corrected before further analysis is carried out. Soft-foot conditions can be checked by placing a dial indicator directly on the foot and carefully loosening the mounting bolt while observing the indicator reading. Any movement or "spring" in excess of 0.002 - 0.003 inch is generally considered excessive and should be corrected. 5.6 OBTAIN HORIZONTAL, VERTICAL AND AXIAL SPECTRUMS (FFTS) AT EACH BEARING OF THE MACHINE TRAIN In many cases, the analysis steps carried out thus far may be sufficient to pinpoint the specific problem causing excessive vibration. If not, the next step is to obtain a complete set of amplitude-versus-frequency spectrums or FFTs at each bearing of the machine train. For a proper analysis, the machine should be operating under normal conditions of load, speed, temperature, etc. In order to insure that the analysis data taken includes all the problem-related vibration characteristics and, yet, is easy to evaluate and interpret, the following recommendations are offered; Interpreting the Data Once horizontal, vertical and axial FFTs have been obtained for each bearing of the machine train, the obvious next question is: "What is this data telling me?" Essentially, amplitude-versus-frequency spectrums or FFTs serve two very important purposes in vibration analysis: 1. Identify the machine component (motor, pump, gear box, etc.) of the machine train that has the problem And 2. Reduce the number of possible problems from several hundred to only a limited few. Identifying the Problem Component Based On Frequency Figure 5-1 shows a fan operating at 2200 RPM, belt driven by an 1800 RPM motor. The rotating speed of the belts is 500 RPM. Assume that a vibration analysis was performed on this 40
  • 6.
    machine and theonly significant vibration detected had a frequency of 2200 CPM or 1 x RPM of the fan. Since the vibration frequency is exactly related to fan speed, this clearly indicates that the fan is the component with the problem. This simple fact eliminates the drive motor, belts and possible background sources as possible causes. Most problems generate vibration with frequencies that are exactly related to the rotating speed of trip in trouble. These frequencies may be exactly 1 x RPM or multiples (harmonics) of 1 x RPM such as 2x, 3x, 4x, etc. In addition, some problem's may cause vibration frequencies that are exact sub harmonics of 1 x RPM such as 1/2x, l/3x or 1/4 x RPM. In any event, the FFT analysis data can identity the machine component with the problem based on the direct relationship between the measured vibration frequency and the rotating speed of the various machine elements. Identifying the Problem Component Based On Amplitude Identifying the fan as the source of vibration based on vibration frequency was quite easy in the above example because of the notable differences in the rotating speeds of the various machine components. The obvious question, of course is: What about direct-coupled machines that is operating at exactly the same speed?" In this case, the component with the problem is normally identified as the one with the highest amplitude. For example, consider a motor direct coupled to a pump. Examining the analysis data, it is noted that the highest vibration amplitude on the motor is 1.0 in/sec compared to 0.12 in/sec on the pump. In this case, the motor is clearly the problem component since its vibration amplitude is nearly 8 times higher than that measured on the pump. In general, the machine component that has the problem is usually the one with the highest amplitude of vibration. The forces that cause vibration tend to dissipate in strength at increased distances from the source. However, there are exceptions to this rule such as the example given earlier where a vertical pump was vibrating excessively due to a resonance problem with the discharge piping. In this case, the exciting force was actually generated by the motor/pump but was being amplified by the resonant condition of the piping. Another exception to this rule involves misalignment of direct coupled machines. Sir Isaac Newton’s third law of physics slates that "whenever one body exerts a force on another, the second always exerts on the first a force which is equal in magnitude but oppositely directed." In 41
  • 7.
    other words, "forevery action, there is an equal but opposite reaction." In the case of coupling misalignment, the vibratory force (action) is generated at the coupling between the driver a driven components. As a result, the "reaction" forces on the driver and driven unit; will be essentially equal, resulting in reasonably comparable vibration amplitudes. The only reason one component may have a slightly higher or lower amplitude than the other is because of differences in the mass and stiffness characteristics of the two components. But, in most cases with the coupling misalignment, the vibration is fairly uniformly "shared" by the driver and driven units. Fig 5.1 Different components generate different vibration frequencies Reducing the List of Possible Problems Based On Frequency In addition to identifying the problem machine component based on frequency and/or amplitude characteristics, the second purpose of FFT analysis data is to limit or reduce the list of possible problems based on the measured vibration frequencies. As stated earlier, each mechanical and operational problem generates its own unique vibration frequency characteristics. Therefore, by knowing the vibration frequency, a list of the problems that cause or generate that particular frequency can be made, which greatly reduces the long list of possibilities. The chart lists the most common vibration frequencies is they relate to machine rotating speed (RPM), along with the common causes for each frequency. To illustrate how to use the chart, assume that the belt-driven fan pictured in Figure 4-1 has excessive vibration at 2200 CPM which is 1 x RPM of the fan. Of course, this clearly indicates that the fan is the component with the problem and not the drive motor or belts. In addition, since the vibration frequency is 1 x RPM of the fan, the possible causes listed on the chart are: 1. Unbalance 2. Eccentric pulley 42
  • 8.
    3. Misalignment—this couldbe misalignment of the fan bearings or misalignment of the fan and motor pulleys. 4. Bent shaft 5. Looseness 6. Distortion—from soft foot or piping strain conditions 7. Bad belts—if belt RPM 8. Resonance 9. Reciprocating forces 10. Electrical problems Using this simple chart, along with the fact that the vibration frequency is 1 x RPM of the fan has reduced the number of possible causes from literally hundreds to only ten (10) likely causes, A little common sense can reduce this list even further. First, since the vibration frequency is not related to the rotating speed (RPM) of the drive belts, possible belt problems can be eliminated as a possible cause. Secondly, since this is a reciprocating machine such as a reciprocating compressor or engine, the possibility of reciprocating forces can be eliminated from the remaining list. Finally, since the frequency is not related to the drive motor or AC line frequency. In any way, the possibility of electrical problems can be eliminated. Now, the number of possible causes of excessive vibration has been reduced to only seven (7) by simply knowing that the vibration frequency in this case is 1 x RF of the fan. Table 5.1: VIBRATION FREQUENCIES AND THE LIKELY CAUSES Frequency in Terms Of RPM Most Likely causes Other possible causes & Remarks 43
  • 9.
    1x RPM Unbalance1) Eccentric journals, gears or pulleys 2) Misalignment or bent shaft if high axial vibration 3) bad belts if RPM of belt 4} Resonance 5) Reciprocating forces 6) Electrical problems 2 x RPM Mechanical looseness 1) Misalignment if high axial vibration 2) Reciprocating forces 3) Resonance 4) bad belt if 2 x RPM of belt 3 x RPM Misalignment Usually a combination of misalignment and excessive axial clearance (looseness). Less than 1x RPM Oil Whirl {Less than 1/2 x RPM 1) Bad drive belts 2) Background vibration 3) Sub-harmonic resonance 4) "Seat" Vibration Synchronous (A.C line frequency) Electrical Problems Common electrical problems include broken rotor bars, eccentric rotor, and unbalanced phases in poly-phase systems, unequal air gap. 2xSynch. Frequency Torque Pulses Rare as a problem unless resonance is excited Many Times RPM (Harmonically Related Freq.) Bad Gears Aerodynamic Forces Hydraulic forces Mechanical Looseness Reciprocating Forces Gear teeth times RPM of bad gear Number of fan blade times RPM Number of impeller vane times RPM May occur at 2, 3, 4 and sometimes higher harmonics if severe looseness High Frequency (Not Harmoni-cally Related) Bad Anti-Friction bearing 1) Bearing vibration may be unsteady amplitude and frequency 2) Capitation, recirculation and flow turbulence causes random high frequency vibration 3)Improper lubrication of journal bearings 4)rubbing Comparing Tri-Axial (Horizontal, Vertical and Axial) Data Not only can specific vibration problems be recognized by their specific frequency characteristics, but in many cases by the direction in which the vibration occurs. This is why it is necessary to take analysis data in the horizontal, vertical and axial directions - to further the 44
  • 10.
    process of elimination. Table 5.1 shows a typical "set" of tri-axial data taken on one bearing of a belt driven fan operating at 2200 RPM. Of course similar data would be taken on the, other fan bearing as well as the motor bearings. "Stacking" the horizontal, vertical and axial data for a particular bearing on the same sheet as shown, greatly simplifies the comparison. Note That the same full-scale amplitude range (0 to 0.3 in/sec) was used for all the data to further simplify the comparison. There are basically two comparisons that need to be made from the data in Figure 5-2. First, how do the horizontal and vertical readings part; and secondly, how do the radial readings (horizontal and vertical) compare1 to the axial readings. Fig 5.2: Typical tri-axial data taken on a belt-driven fan Comparing Horizontal and Vertical Readings When comparing the horizontal and vertical data, it is important to take note of how and where the machine is mounted and also, how the bearings are mounted to the machine. Basically, the vibration analyst needs to develop a "feel" for the relative stiffness between the horizontal and vertical directions in order to see whether the comparative horizontal and vertical 45
  • 11.
    readings indicate anormal or abnormal situation. Machines mounted on a solid or rigid base may be evaluated differently than machines mounted on elevated structures or resilient vibration isolators such as rubber pads or springs. To explain the significance of machine stiffness, assume that the fan in Figure 5-1 is mounted on a rigid, solid concrete base which, in turn, is mounted on a solid foundation located at ground level. This would be regarded as a "rigid" installation and under normal conditions the vertical stiffness would be greater than the horizontal stiffness. If such is the case/one would expect that normal problems, such as unbalance, would cause higher amplitude of vibration in th2 horizontal direction than the vertical direction, if a rigidly mounted machine has higher vibration in the vertical direction than the horizontal direction, this would generally be considered as 'abnormal', and may indicate a looseness or weakness condition. On the other hand, if this same machine was mounted on springs or rubber pads, a higher amplitude in. the vertical direction may not be considered unusual or an indication of structural problems. Another factor that needs to be considered is the "ratio" between the horizontal and vertical Amplitudes. As explained, it is not unusual for rigidly mounted machines to have higher amplitudes of vibration in the horizontal direction, compared to the vertical direction. However, the ratio between the horizontal and vertical amplitudes should be checked to see if it is normal or indicative of some unusual problem. As a normal unbalance response, it is not unusual for ma-chines to exhibit ratios between the horizontal and vertical amplitudes of 1:1, 2:1, 3:1 or 4:1, depending on the particular installation. In other words, it would not be unusual for a rigidly mounted fan, motor or pump to have a vibration amplitude at 1 x RPM as much as 4 times higher in the horizontal direction than the vertical direction due to unbalance. Ratios beyond 4:1 somewhat unusual and typically indicate an abnormal condition such as looseness or resonance. Comparing Radial (Horizontal & Vertical) Data to Axial Data The second important comparison that needs to be made to tri-axial analysis data is how the radial (horizontal and vertical) readings compare to the axial readings. Relatively high amplitudes of axial vibration are normally the result of: 1. Misalignment of couplings 46
  • 12.
    2. Misalignment ofbearings 3. Misalignment of pulleys or sheaves on belt drives 4. Bent shafts 5. Unbalance of "overhung" rotors such as the fan in Figure 5.1 A general rule, any time the amplitude of axial vibration exceeds 50% of the highest radial (horizontal or vertical) amplitude, the possibility of a misalignment or bent shaft condition should be considered.) CM course, extremely high amplitudes of axial vibration may also be due to resonance or unbalance of an overhung rotor. Verifying the cause of a high axial vibration using "phase analysis" techniques will be covered in the sections to follow. Examining the axial vibration in the examples given in Figures, it can be seen that in neither instance is the amplitude of axial vibration greater than 50% of the highest radial amplitude. As a result, misalignment or bent shaft Conditions are not indicated examples. 'Where Do Multiple Harmonic Vibration Frequencies Come From? Something that often worries or confuses the beginning vibration analyst is the appearance of numerous "harmonic" frequencies that sometimes appear in their FFT analysis data. A good example is the frequency analysis data presented in Figure -5-3. Although the predominant vibration is clearly 2200 CPM (1 x RPM of the fan), vibration frequencies can also be seen at 4400 CPM (2 x RPM), 6600 CPM (3 x RPM) and 8800 CPM (4"x RPM). Although their amplitudes are considerably lower than that at 1 x RPM, these "harmonic" frequencies are very important and should not be ignored, as will be explained in the following Paragraphs. The presence of multiple or "harmonically" related vibration frequencies is not uncommon, and their presence in the FFT data can be easily explained by examining the frequency characteristics of various vibration waveforms. Figure 5.3 illustrates four (4) different types of vibration waveforms — a sinusoidal is a sine wave, a square wave, s triangular or "saw-tooth" wave and a spike pulse. These waveforms can be readily generated by various machinery problems, depending on the nature of the problem and the extent of the exciting forces. The '1 Linda -mental" frequency of each of the waveforms in Figure 5-3 is the same; however, the frequencies presented in the FFTs will be considerably different. 47
  • 13.
    Fig 5.3: Differentwave forms result in different frequency characteristics A sinusoidal or "sine" wave could be the result, of a simple unbalance or misalignment problem. If a frequency analysis (FFT) is performed on a true sinusoidal waveform, the result will be a single frequency of vibration with certain amplitude and NO multiple frequencies. By comparison, a frequency analysts (FFT) of & square waveform will not only display the fundamental frequency (1x), but the odd multiple or harmonic frequencies as well (i.e. 3x, 5x, 7x, etc.). The number of odd multiple frequencies present in the FFT data will depend on how close the waveform is to a true square wave, the intensity or amplitude of the vibration and the response characteristics (peak or RMS) of the instrument as well as its dynamic range. Figure 4-8 shows a 6000 CPM (1 00 Hz) square waveform signal obtained from an electronic signal generator along with the FFT frequency analysis. Note that the frequency analysis not only includes the fundamental frequency of 6000 CPM, but the odd multiples as well (i.e. 18,000 CPM, 30,000 CPM, 42,000 CPM, etc.). One possible explanation (or a square wave vibration would be an unbalance condition combined with system looseness. If the unbalance force was great enough, the machine could literally be lifted off the foundation and held to the limit of looseness until the unbalance force has rotated to a position where the upward force is reduced, allowing the machine to drop. Another possibility is a mild rubbing condition that might "flatten" the unbalance sine wave whenever the rub occurs. The fundamental (1x) frequency accompanied by the odd multiple or harmonic 48
  • 14.
    frequencies, similar toa square wave. However, the amplitudes of the odd harmonics of a triangular waveform decrease more quickly at higher frequency than do those of a square waveform as shown in Figure 5-3. Triangular or saw tooth waveforms can also be generated by conditions such as looseness or excessive bearing clearance that result in "distortion" of an unbalance sine we Here also, the number of odd multiple frequencies that accompany the funda-mental frequency will depend not only on the amplitude of the fundamental frequency, but the dynamic range and circuit response characteristics (peak RMS) of the analysis instrument. Some problems such as a cracked or broken tooth on a gear, or a flaw on a bearing raceway or rolling element, will generate vibration in the form of impact or spike-pulses. A frequency analysis or FFT of a spike-pulse signal will reveal the fundamental impact frequency, followed by the entire multiple or harmonic frequencies (i.e. 2x, 3x, 4x, 5x, 6x, etc.) as shown in Figure 4-3. As before, the number of harmonic frequencies evident in the FFT will depend on the amplitude of the fundamental component and the dynamic range and circuit response characteristics (peak or RMS) of the analysis instrument. The presence of multiple, harmonic frequencies in an FFT are definitely important and should not be ignored, even though their amplitudes may be considerably less than that of the fundamental frequency. Their mere existence indicates that the vibration is not a true sine wave, and may provide clues to other significant problems such as looseness conditions, gear tooth problems, bearing problems, etc. In the case of the belt driven fan in Figure 5-1, the harmonic frequencies only appeared at the drive-end bearing (bearing C). Ultimately, the problem was found to be a loose pulley on the fan shaft, which was allowing the pulley to "rattle" on the shaft during rotation. This caused a spike-pulse distortion of the unbalance sine wave, resulting in the harmonic vibration frequencies. Once the set-screws were tightened securing the pulley to the shaft, the multiple harmonic frequencies totally disappeared, leaving only the 1 x RPM unbalance vibration frequency. Distortion of a sinusoidal vibration waveform, resulting in multiple vibration frequencies, may not only be the result of mechanical problems such as looseness, bearing defects, rubbing or gear defects as described above. (Waveform distortion can also result from the setup and operation of the vibration analysis equipment. For example, if a magnetic holder is being used to mount the vibration accelerometer to the machine, any looseness or rocking of the magnet on the surface of the machine can result in the appearance of multiple frequencies in the analysis data. 49
  • 15.
    In addition, ifthe amplitude of machine vibration exceeds the full-scale amplitude range selected on the analyzer instrument, the true vibration signal may be "chopped", resulting in multiple frequency components in the FFT data that do not physically exist. For example, if the actual level of machine vibration was 1.0 in/sec but the analyzer was set for a 0.3 in/sec full-scale range, the vibration signal would be chopped off, creating an approximate square waveform. The result, of course, would be odd multiple frequencies in the analysis data that do not actually exist. Side-Band Frequencies "Side-band" frequencies are an additional vibration frequency that often appears FFT data that can be confusing to the beginning vibration analyst. Side band vibration frequencies are the result of a variation in the amplitude of given vibration frequency signal as a function of time. This variation in amplitude with time is also called "amplitude modulation". For example, consider a Rolling element bearing with a significant flaw or defect on the rotating inner raceway.) Fig: 5.4 spike pulses due to flaw on the inner race of the bearing As the inner raceway rotates, spike pulses will be generated each time a rolling element impacts the flaw. However, the amplitude or intensity of the pulses generated will vary as the defect rotates into and out of the load zone of the bearing. This is shown in Figure. Impacts that occur when the defect is within the load zone will obviously be mw intense than those that occur out of the load zone. The result is a modulation the fundamental bearing defect frequency. The fundamental bearing defect frequency in this case is the frequency at which rolling elements impact the inner raceway flaw and is called the "ball passing frequency of the inner raceway" or simply BPFI. When discussing side-band frequencies, the fundamental bearing frequency in this case would be called the "carrier" frequency. The frequency at which 50
  • 16.
    the amplitude ofthe carrier frequency varies is called the "modulating" frequency. The modulating frequency in the case of a defect on the inner raceway will be 1 x RPM, since the defect is rotating into and out of the bearing load zone at the rotating speed of the shaft. 5.7 DETERMINE IF THE VIBRATION IS DIRECTIONAL OR NON-DIRECTIONAL In addition to a comparison of tri-axial (horizontal, vertical and axial data) other analysis techniques such as simple probing studies has been discussed to show how the list of possible problems can be reduced. A vibration frequency of 1 x RPM is probably the most common "predominant" vibration encountered during analysis because so many different yet common day-to-day problems can cause it. These problems include. 1. Unbalance 2. Bent shafts 3. Misalignment— of couplings, bearings and pulleys. 4. Looseness 5. Resonance 6. Distortion—from soft foot or piping strain conditions 7. Eccentricity---of pulleys and gears 8. Reciprocating forces Of all the problems listed above, the only ones that generate uniform radial forces and resultant vibration are unbalance and bent shafts. All of the remaining problems typically generate forces and resultant vibration which is very highly directional in nature. Therefore, determining whether or not the radial vibration directional or non-directional can be an extremely valuable analysis tool in reducing the list of possible problems. To explain the difference between directional and uniform or non-directional vibration, consider the response of a machine to a simple unbalance problem. An unbalance condition generates a certain amount of radial force which is governed by the amount of unbalance weight (ounces, grams, etc.), the radius of the weight or its distance from the shaft centerline and the rotating speed (RPM) of the machine. In any case, an unbalance generates a fixed amount of force that is simply changing in direction with shaft rotation. If the stiffness of the machine was the same in the horizontal and 51
  • 17.
    vertical directions, themachine would literally move in a circular path, and the radial vibration amplitudes would be the same in all radial directions. Of course, the horizontal and vertical stiff nesses will probably not be exactly the same, so the radial motion will probably be somewhat elliptical, resulting in slightly different amplitudes measured in various radial directions. In any case, a simple unbalance, uncomplicated by other problems, generates a fairly uniform, non-directional radial vibration. In terms of radial vibration, a bent shaft reacts in much the same way as simple unbalance. However, remember ' from our earlier discussion that a bent shaft will also be characterized by relatively high axial vibration amplitudes as well. Compared to unbalance and bent shafts, the other listed causes of 1 X RPM Vibration DOES NOT generate uniform radial vibration. Instead, they create radial vibration which is very highly directional. For example, consider the radial vibration generated by coupling misalignment. When a coupling is misaligned, obviously it is misaligned in a certain direction. As a result, the radial forces and, hence, the radial vibration will be most pronounced in the direction of misalignment. Similar to coupling misalignment, a distortion problem from a soft foot or piping strain problem creates misalignment. Of the machine's bearings in a certain direction with the result being highly directional radial vibration. An eccentric pulley used in a "V" belt drive produces variations in belt tension with each revolution, causing a highly directional vibration measured in the direction of belt tension. An eccentric gear creates directional forces due to the "cam-like" action with the mating gear, similar to an eccentric pulley. Unbalanced reciprocating forces due to misfiring, valve leakage and other operational problems with engines and reciprocating compressors generate vibration in the direction of reciprocation which are, of course, highly directional. Structural looseness or weakness problems such as loose mounting bolts or deterioration in grouting, simply allow the machine more freedom to move in the direction of the looseness. Although some other exciting force must be present, such as unbalance, structural looseness usually results in highly directional vibration. Detecting Directional versus Non-Directional Vibration There are basically three ways to determine whether the vibration of a machine reasonably uniform or highly directional in nature. These include: 52
  • 18.
    1. A comparisonor horizontal, vertical and axial FFT data 2. Comparing the horizontal and vertical phase measurements 3. Multiple radial amplitude measurements Comparing Horizontal and Vertical Phase Readings Figure 5-5 illustrates two types of radial vibration—uniform and highly directional. Of course, uniform or reasonably circular radial vibration is typically the result of a simple unbalance problem. Phase measurements, which were discussed, are obtained by either triggering a stroboscopic (strobe) light with the vibration signal or by comparing the vibration signal with a Fig: 5.5 Comparative horizontal and vertical phase readings are used to distinguish between uniform and highly directional radial vibration refer pulse such as that obtained with a photo-electric pickup (photocell) or laser In any case, phase was described as the "relative" motion of two or more parts of a machine. However, phase can also describe how a single element of a machine is vibrating, such as a bearing. In other words, comparative phase measurements taken in the horizontal and vertical directions of a particular bearing can reveal whether the bearing is vibrating in a highly directional or a reason uniform manner. In the case of a normal unbalance, it is the "heavy spot" of unbalance that; dually causes the vibration. And, since it is the vibration signal that triggers the strobe light or is compared to the reference pulse, it can be said that, indirectly, the heavy spot is responsible for the ultimate phase angle measurement. With this in mind then, it should be apparent that if the machine bearing is vibrating in a reasonably uniform or circular pattern, from the time that the heavy spot rotated to a position to cause the machine to move horizontally, the heavy spot had to rotate an 53
  • 19.
    additional 1 /4revolution or 90 degrees to cause it to move vertically. Therefore, if the machine is, in tact, vibrating radially in a reasonably uniform or circular manner, a comparison of phase readings taken in the horizontal & vertical directions should show a difference of approximately 90 degrees. Of course, even with simple unbalance, the stiffness in the horizontal and vertical directions will probably not be exactly the same and, as a result, the radial motion will probably not be a perfect circle. Therefore, when comparing phase readings taken in the horizontal and vertical directions, the phase difference may not be exactly 90 degrees. Because the radial motion may not be a perfect circle, a tolerance or plus or minus 30 degrees is normally allowed. In other words, comparative horizontal and vertical phase readings between 60 degrees and 120 degrees indicate a fairly uniform radial vibration or one that is NOT highly directional. In the case of highly directional radial vibration, comparative horizontal and vertical phase readings will either be nearly the same (0 degrees difference) or 180 degrees out-of-phase, depending on which side of the machine bearing the readings are taken. Referring to Figure 4-5, if the vibration was occurring virtually along the straight line designated "A", the machine would reach its maximum motion toward the horizontal measurement location at exactly the same instant it reached its maximum motion toward the vertical measurement location. In this case, comparative horizontal and vertical phase measurements would be the same (i.e. differ by 0 degrees). However, if the directional vibrate was occurring along the straight line designated as "B", then at the exact instant the machine reached its maximum motion towards the horizontal measurement location, it would have reached its maximum location away from the vertical measurement location. In this case, comparative horizontal and vertical phase readings would differ by 180 degrees. In summary, a simple comparison of horizontal and vertical phase readings can quickly tell whether the radial vibration is fairly uniform or highly directional. In addition, it should be pointed out that it does not make any difference how the machine is vibrating radially relative to the directions of vibration measurement. Any time the ratio between the maximum and minimum radial vibration amplitude exceeds much beyond 5:1, comparative horizontal and vertical phases readings will indicate a highly directional vibration by virtue of a 0 degree or 180 degrees phase comparison. 5.8 IDENTIFYING THE MOST COMMON MACHINERY PROBLEMS 54
  • 20.
    5.8.1 Vibration dueto Unbalance Unbalance of rotating machine components is, perhaps, the easiest problem lo pinpoint with confidence. Simple unbalance, uncomplicated by other problems, can be readily identified by the following characteristics: 1. The vibration occurs at a frequency of 1 x RPM of the unbalanced component. The presence of multiple, harmonic frequencies (i.e. 2x, 3x, 4x, times RPM) usually indicates additional problems such as looseness, rubbing, etc 2. The radial vibration is reasonably uniform and not highly directional. A comparison of horizontal and vertical phase readings will normally show a difference between 60 degrees and 120 degrees. If comparative horizontal and vertical phase readings can not betaken, multiple radial amplitude readings should not show a discrepancy in excess of 5:1. 3. If a specific machine component such as a motor or fan is the source of unbalance, that component will! Have significantly higher amplitudes of vibration at the 1 x RPM frequency. Unbalance of couplings will likely reveal comparable amplitudes on both the driver and driven machine components. Unbalance conditions can often be affected by other operating conditions such as load or temperature. For example, machines operating at elevated temperatures can physically distort or change shape due to thermal changes, resulting!! a change rotor balance. Large, fabricated boiler draft fans must often be balanced at operating temperature due to thermal distortion. They may run smoothly when cold but vibrate excessively when hot. In addition, due to minor variations in the track and pitch-angle of the fan blades. Large fabricated fans may show significant changes in the unbalance vibration characteristics with changes in flow conditions. In other words, a change in the damper setting may result in a significant change in the unbalance amplitude & phase characteristics. Such affects are referred to as "aerodynamic unbalance', and [joint out the importance of balancing a rotor under its normal operating conditions of temperature and flow conditions. 5.8.2 Bent Shaft Problems Bent shafts are a common problem encountered on machinery, and are often the result of manufacturing errors or mishandling and damage during transportation or machine installation. 55
  • 21.
    In addition, arotor may "bow" as the result of thermal distortion at elevated temperatures or due to excessive unbalance forces. Fig: 5.6 uneven rotor and bent shaft problems Regardless of the cause, bent shafts will usually generate a predominant vibration at 1 x RPM, very similar to simple unbalance. And, like unbalance, the radial vibration caused by a, bent shaft will be fairly uniform and not highly directional. However, unlike unbalance, bent shaft conditions will normally cause a relatively significant vibration in the axial direction as well. As staled earlier, any time the amplitude of vibration measured in the axial direction exceeds 1/2 (50%) o! the highest measured radial vibration, a bent shaft is a very possible cause. Because bent shafts cause significant vibration in the axial direction, a bent shaft problem can normally be verified using a phase analysis of the axial vibration. However, there are actually two different types of bent shaft conditions: 1. Rotors that have a simple "bow and: 2. Shafts that have a bend or "kink", but only near a particular bearing. Each type of bend will result in significant axial vibration, but each type will cause the various bearings of the machine to vibrate in the axial direction in a notice-ably different manner. Therefore, an axial phase analysis cans not only verity a bent shaft condition, but can also help in identifying the nature and location of the bend as well. 56
  • 22.
    5.8.3 Shaft witha Kink or Bend Close To the Bearing The axial vibration caused by a bent shaft can actually occur in two different ways. Normally, if the bend is fairly close to a particular bearing, such as a "kink" in the stub shaft of a motor or pump caused by bumping the shaft during transportation or installation, the bearing will tend to vibrate axially in a "twisting", motion This twisting motion can be easily recognized by taking comparative axial phase measurements at multiple axial positions as shown in Figure 4.7. Four axial phase readings at each bearing of the machine are recommended; however, physical constraints may make it impossible to take all the readings desired. In any case, more than one axial phase reading is needed, so try to take &s many as possible. If the bearing is, in fact, "twisting" due to a kink in the shaft that is very close or actually through the bearing itself, the result will be a drastic difference in the phase readings obtained at the four axial positions, as shown in Figure 5-7. In Figure 5-8, it can be seen that the upper and lower measurement points {1 and 3) are actually 180 degrees out-of-phase, as are the measurement points on opposite sides of the shaft (2 and 4). This clearly indicates that the bearing is vibrating axially in a twisting fashion. Further verification of a bend or "kink" in the shaft can be carried out using a dial indicator. Fig 5.7: four axial phase readings at each bearing are needed to see how each bearing is vibrating axially 57
  • 23.
    Fig 5.8: Theseaxial phase readings show a twisting axial motion. Bearings that are "cocked" in the machine housing may also cause significant vibration amplitudes in the axial direction, and may reveal the same "twisting" action as that caused by a kinked shaft. However, a cocked or misaligned bearing can usually be distinguished from a kinked shaft by comparing the amplitudes of vibration measured at the four axial positions. Normally, if a bearing is cocked in the housing, it will be cocked in a specific direction and show a significant difference in the amplitudes measured at the four axial positions. On the other hand, a shaft that has a simple bend or "kink" will reveal fairly uniform amplitudes in the four axial positions. 5.8.4 Identifying a Simple Shaft Bow A shaft that has a simple bow may not cause the supporting bearings to vibrate axially in a "twisting" type of motion. Instead, a simple bow may cause the supporting bearings to vibrate axially in a "planer" fashion In order to identify a simple bow as the cause of high axial vibration, it will be necessary to compare the "relative" axial motion of the support bearings. If the shaft is simply bowed, the supporting bearings of the rotor will reveal a substantial "out-of-phase" condition. Although a pronounced bow may reveal as much as a 180 degrees difference in the axial phase of the rotor supporting bearings, an out-of-phase condition of only 90 degrees or more is significant enough to indicate a possible bow in the shaft. Run out checks with a dial indicator should be performed to verify the bent shaft condition—especially if the amplitudes of axial vibration far exceed 50% of the highest radial amplitudes. When comparing the axial phase readings at the supporting bearings of a rotor, it is most important to keep in mind the direction of the transducer. To illustrate, when taking axial phase-readings on the left side bearing of the rotor, the vibration transducer may have been pointing to the right. However, when axial phase readings were taken on the right side bearing, it may have been necessary to point the vibration transducer to the left. If this was the case, it will be necessary to correct the phase readings for one of the bearings by 180 degrees to compensate for the necessary 180 degree change in transducer direction. Of course, if the direction of the pickup axis can be kept the same at all bearing locations, then no correction factor is necessary. 58
  • 24.
    5.8.5 Vibration Dueto Misalignment Surveys have shown that at the beginning stages of most predictive maintenance programs, misalignment of direct coupled machines is by far the most common cause of machinery vibration. In spite of self-aligning bearings and flexible couplings, it is difficult to align two shafts and their bearings so that no forces exist which will cause vibration. Although machines may be well aligned initially, several factors can affect alignment, including: Fig: 5.9 parallel misalignment and angular misalignment 1. Operating temperature: Machines aligned when cold may "grow" out of alignment due to variations in thermal conditions, 2. Settling of the base or foundation 3. Deterioration or shrinkage of grouting The following are general characteristics to look for: 1. The radial vibration caused by coupling misalignment is typically highly directional on both the driver and driven units. Misalignment occurs in a certain direction and, as a result, the radial forces are not uniformly applied in all radial directions like that from unbalance. 2. The vibration frequencies due to misalignment are usually 1 x, 2x and 3x RPM, and may appear in any combination depending on the type and extent of misalignment. Angular misalignment normally causes vibration at 1 x RPM, whereas offset or parallel misalignment causes vibration predominantly at 2 x RPM. In fast, offset misalignment is probably the most likely cause of a predominate 2 x RPM vibration. Combinations of angular and offset misalignment may show combinations of 1x and 2 x RPM and in some cases even 1x, 59
  • 25.
    2x and 3x RPM. 3. Whenever misalignment is suspected, an axial phase analysis comparing the relative axial motion of the driver and driven units can be most helpful. As stated earlier, "for every action there is an equal but opposite reaction". As a. result, misalignment problems will normally reveal a significant phase difference up to 180 degrees. However, phase differences as little as 60 degrees Tin relative axial motion is sufficient to suggest misalignment. 5.8.6 Vibration Due To Looseness Excessive vibration may exist due to looseness conditions; however, looseness is not the actual cause of the vibration. Some other exciting force such as unbalance or misalignment must be present to actually cause the vibration. Fig: 5.10 vibrations due to looseness (excessive clearance in bearings and loose bolts) Looseness is simply a loss or reduction in the normal stiffness of the machine or system, perhaps due to loose mounting bolts, cracks in the base or foundation, deterioration in grouting, cracked welds, loose lags or anchors or rotors loose on the shaft. Looseness conditions simply allow whatever exciting forces that exist in the machine to exhibit or generate higher amplitudes of vibration than they would if no looseness problems existed. If the predominate exciting force is an unbalance at 1 x RPM, then the predominate vibration due to looseness would be 1 x RPM in this case. However, if the predominate exciting force is occurring at 2 x RPM due to an offset misalignment, then the looseness would occur at a frequency of 2 x RPM. Looseness does not have to occur at a frequency of 2 x RPM as many published vibration diagnostic charts would lead one to believe. Two general types of looseness are: 1. Looseness associated with the rotating system, including rotors loose on the shaft, bearings loose on the shaft or in the machine housing and excessive sleeve bearing clearance. 60
  • 26.
    2. Looseness ofthe support system of a machine such as loose mounting bolls, grouting deterioration or cracks in the structure. Mechanical Looseness and "Sub harmonic" Frequencies On occasion, certain looseness conditions can also result in "sub harmonic" Frequencies of vibration (i.e. 1/2, 1/3, or 1/4 x RPM) with frequencies at 1/2 x RPM being the most common. For example, there have been many reported cases of excessive wear and clearance in sleeve bearings of large motors that have resulted in vibration frequencies of 1/2x, 1x, 1-1/2x, 2x, 2- 1/2x, 3x, 3-1/2x and Higher orders of 1/2 x RPM. Why and how vibration frequencies at multiples of ' half-order (1/2 x RPM) are generated has never been fully explained. However, when detected, possible looseness conditions including bearing clearance Problems should be suspected. 5.8.7 Vibration Due To Eccentricity Of course, no rotor or shaft can be made perfectly round. Some eccentricity or "out-of-roundness" will be present on nearly every rotating assembly. Eccentricity is a common cause of unbalance, and for common machines such as fans, blowers, pumps, etc., normal balancing procedures can be carried out to minimize the effects of eccentricity. However, in certain situations, eccentricity can result in "reaction" forces that can not be totally compensated by simply balancing the rotor. Probably the most common examples are eccentric belt pulleys and chain sprockets, eccentric gears and eccentric motor armatures. In the case of an eccentric belt pulley or chain sprocket, each revolution of the eccentric pulley or sprocket will cause a variation in belt or chain tension. The result will be a vibration frequency at 1 x RPM of the eccentric element, with a directional force on a line between the centers of the driver and driven pulleys or sprockets. Although this could be easily mistaken as an unbalance problem, a simple test for- the directionality of the radial vibration by taking comparative horizontal and vertical phase readings or by taking multiple radial amplitude readings will quickly reveal the highly directional nature of the vibration. Slow motion studies with a stroboscopic light or run out checks with a dial indicator will confirm the eccentricity problem. 61
  • 27.
    Fig: 5.11 VibrationsDue To Eccentricity Eccentric gears will cause highly directional vibration at 1 x RPM of the eccentric gear in a manner similar to that of eccentric belt pulleys and chain sprockets, and can be identified by taking comparative horizontal and vertical phase readings or by taking multiple radial amplitude readings as described earlier. 5.8.8 Vibration Due To Resonance Resonance is a very common cause of excessive vibration on machines because 1. Machines consist of many individual elements or components such as suction and discharge piping, bearing pedestals, bases, and accessory items such as exciters and lube oil pumps, etc... Of course, each component has its own mass and stiffness characteristics and, hence, its own unique natural frequency. 2. The stiffness of each machine component is different in different directions. As a result, each machine component will likely have several different natural frequencies. For example, consider a fan bearing. Most likely, the stiffness of the bearing will be different in the horizontal, vertical and axial directions. As a result, the natural frequencies of this particular machine component will also be different in the horizontal, vertical and axial directions. When one considers all of the various machine components, along with the multiple natural frequencies possible for each component, the reason that resonance is such a common problem is quite understandable. All that is required is that the natural frequency of one machine component, in one of its directions of vibration, be the same as one exciting force frequency 62
  • 28.
    inherent to themachine, when this happens, resonance and high levels of vibration will result. Although machines that are installed and brought into service may not exhibit resonance problems initially, resonance may become a problem in the future if changes in machine stiffness occur as the result of bearing wear, grouting deterioration, loosening of mounting bolts or other problems. 5.8.9 Vibration due to defective rolling element bearings When a rolling element bearing develops flaws on the raceways and/or rolling elements, there are actually a number of vibration frequency characteristics that can result depending on the extent of deterioration. 5.12 vibrations due to worn rollers, worn gear teeth and worn belts Thus, identifying these characteristic frequencies cannot only help to verify that a bearing is definitely failing, but can also give some indication of the extent of deterioration. The following is a discussion of the four stages that a bearing will typically go through from the earliest stage of deterioration to that approaching catastrophic failure. Catastrophic failure id defined here as simply the total in ability of the bearing to perform its intended functions of minimizing the friction generated through rotating motion and keeping rotating and non-rotating parts from coming into contact with one another. In other words, failure will occur when either the bearing literally comes apart or seizes due to excessive heat build up. 5.9 VIBRATION ANALYSIS 5.9.1 Introduction 63
  • 29.
    Interpreting vibration characteristicscarries out diagnostics studies based on vibration analysis. The following vibration characteristics are utilized to interpret the machinery health condition. 1. Vibration displacement 2. Vibration velocity 3. Vibration acceleration will include the health condition. 4. Vibration frequency will indicate the defect 5. Vibration base will help to indicate the defective location 5.9.2 Dominant Frequency It is sometimes useful to know the dominant frequency of vibration of a machine that has several rotating parts. Consider for example a belt driven blower. The motor and fan run at different speeds. The dominant frequency will reveal which part of the machine is causing the most vibration. The measurements taken on the motor bearings would include vibration of the motor plus vibrations from the fan transmitted through the drive belt and mounting structure. Conversely, measurement taken on the fan bearings would include vibrations of the fan plus vibrations transmitted from the motors as shown in the figure. In many cases the point with the most vibration would pin point which part has the trouble, but not always. Measurements taken on the fan contains vibrations of the fan plus transmitted vibrations from the motor. The following sequence is used to find the dominant frequency: 1. Measure and record the displacement (D) at a given point. 2. In same manner and at the same point, measure and record the velocity (V). 3. The dominant frequency can be found by dividing the velocity measurement (V) by the displacement measurement (D) and multiplying by the constant 19100. The answer will be the dominant frequency of vibration in cycles per minute. Dominant frequency (CPM) = velocity (V) millimeters/second x 19100 (metric units) 64
  • 30.
    Displacement (D) micrometers For example, if the motor runs at 1750 RPM and the fan at 2600 RPM. Measurements taken on the motor are displacement (D) = 47 micrometers and velocity (V) = 6.5 millimeters / seconds. The dominant frequency then becomes: (6.5/47) XI 9, 120 =2,644 cpm 2644 CPM is nearest the fan speed. The fan is the dominant part and is causing vibration. Generally the dominant frequency will be equal to the rotating speed of the part cause the vibration, assuming that the trouble is unbalance. In any event the dominant vibration frequency will normally be some multiple of RPM of the part. After determining the dominant frequency, the type of the trouble present may be assumed from the following table. 65