Downloaded 27 times
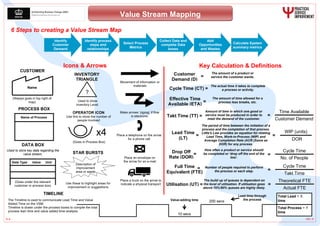
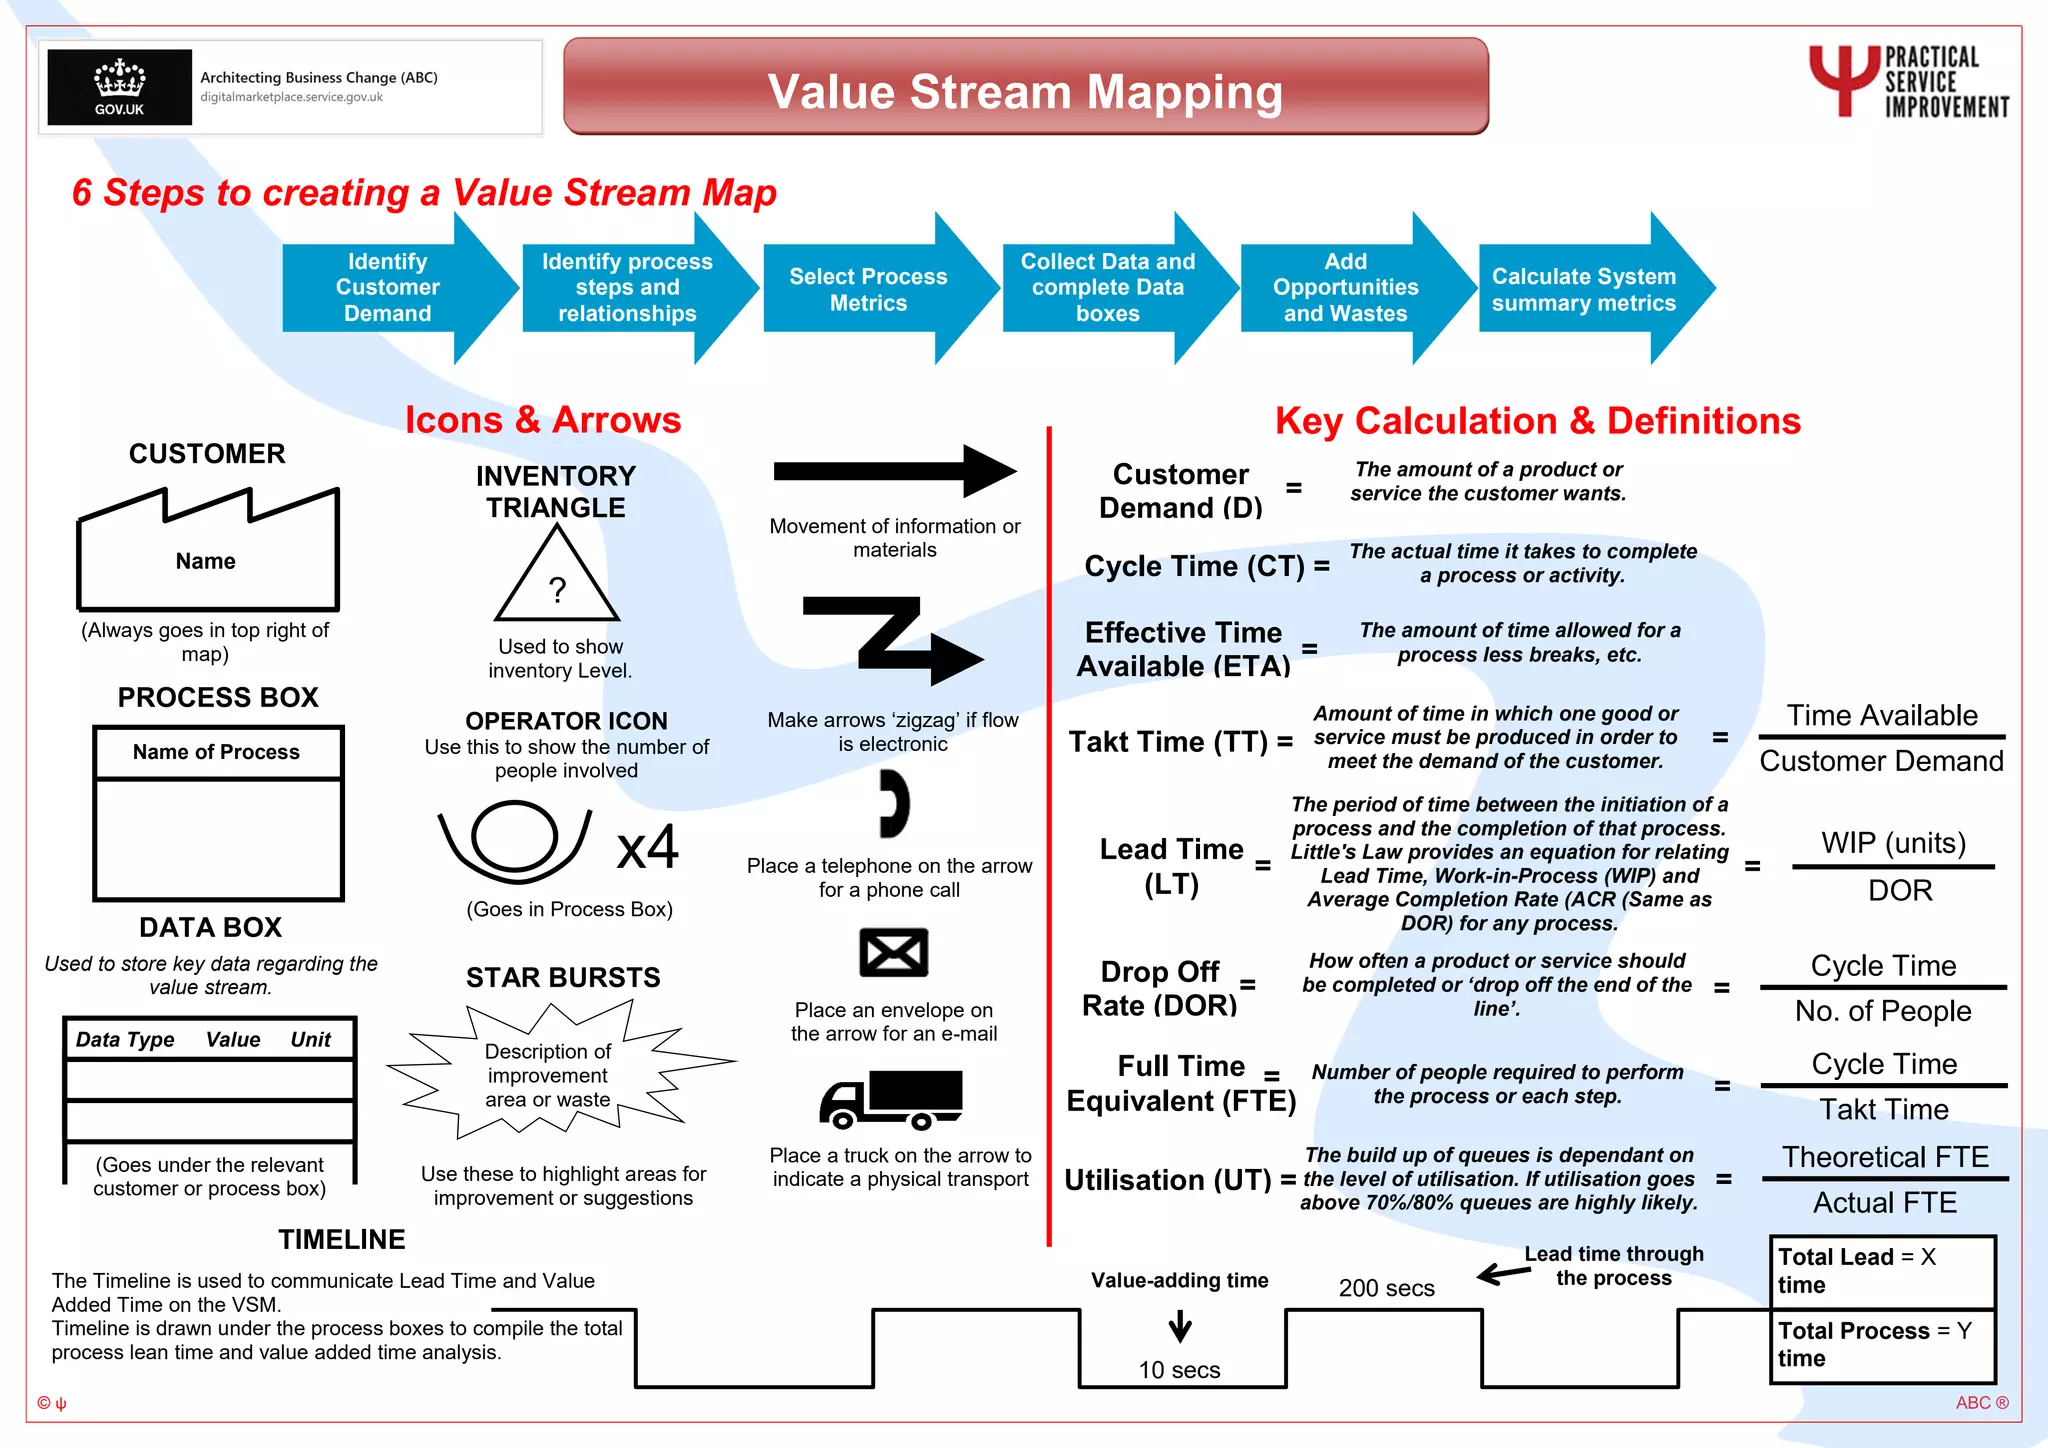

This document provides guidance on creating a value stream map, which is a tool used to analyze and improve the flow of materials and information required to produce a product or service. It includes icons to represent different types of flows, such as physical transport or electronic communication. Process boxes are used to identify each step in the value stream and can include data on topics like lead time, cycle time and inventory levels. The 6 steps to creating a value stream map are outlined, beginning with identifying process steps and relationships, then collecting data, identifying opportunities for improvement, and calculating metrics to analyze the system. Key definitions are also provided for terms like takt time, lead time, cycle time and utilization.


