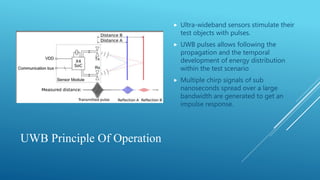
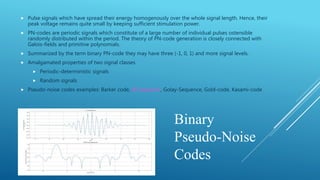
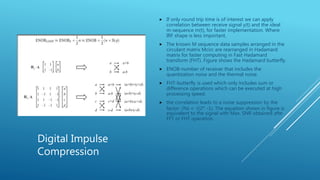
Focus on M-sequence sensor electronics
IR-UWB: Correlator
-Jayendra Mishra
UWB Principle Of Operation
 Ultra-wideband sensors stimulate their
test objects with pulses.
 UWB pulses allows following the
propagation and the temporal
development of energy distribution
within the test scenario
 Multiple chirp signals of sub
nanoseconds spread over a large
bandwidth are generated to get an
impulse response.
Measurement Complexity
 Large peak power signals represents some inconvenience of the
impulse measurement technique.
 Idea is to go away from excitations by strong single or infrequent
‘shocks’ and to pass instead to a stimulation of the DUT by many subtle
‘pinpricks’.
 Binary pseudo-noise codes represent pulse signals which are more
careful with the test objects.
Binary
Pseudo-Noise
Codes
 Pulse signals which have spread their energy homogenously over the whole signal length. Hence, their
peak voltage remains quite small by keeping sufficient stimulation power.
 PN-codes are periodic signals which constitute of a large number of individual pulses ostensible
randomly distributed within the period. The theory of PN-code generation is closely connected with
Galois-fields and primitive polynomials.
 Summarized by the term binary PN-code they may have three (-1, 0, 1) and more signal levels.
 Amalgamated properties of two signal classes
 Periodic-deterministic signals
 Random signals
 Pseudo-noise codes examples: Barker code, M-sequence, Golay-Sequence, Gold-code, Kasami-code
M-Sequence
 Maximum length binary sequence or shortly
termed M-sequence is Simple to generate
and provide best properties to measure the
Impulse response function IRF.
 For a given signal power, lowest amplitude
and shortest autocorrelation function.
 No. of flip-flops in shift register determine
the length of M-sequence
 Spares the measurement objects and the
requirements onto the receiver dynamic
are more relaxed.
M-sequence Generation
 Digital shift registers with appropriate
feedbacks.
 Shift the starting point of the M-
sequence to control the time lag of an
UWB correlator.
 In figure the register is of the 9th order.
 Fibonacci structure deals with cascaded
XOR-gates which increase the dead time
before a new change of the flip-flop
states is allowed.
Technical
Challenges
 IRF measurement not directly possible with a time extended
signal such as the M-sequence.
 The M-sequence signal has to be subjected to an impulse
compression to gain the wanted impulse response.
 The price to pay for reduced voltage in a UWB signal is the
chaotic structure of the receive signal, therefore, a correlator
is required for interpretation.
 Intermediate frequency cannot provide a low freq. as the
Nyquist bandwidth is huge for 3 GHz of bandwidth.
 To perform the correlation of a very wideband signal we
need.
 Cross-correlation to access the wanted IRF
 Digital impulse compression
 Frequency domain conversion
Impulse
Correlator
 Objective: to determine the impulse response function of a
test object.
 A correlator is used to detect the presence of signals with a
known waveform in a noisy background.
 The output is nearly zero (below set threshold) if only noise
is present.
 Impulse compression is performed by the correlator
Impulse
Correlation
 In UWB, Impulse compression using wideband correlation
 Convolving with a time inverted stimulus x(-t).
 Technical implementation Cross-correlation
 The Sliding correlator
 PN- correlation
The Sliding
Correlator
 (a.1) Two shift registers of identical behavior make a
sliding correlator. First one provides actual band
limited stimulus signal at fc, and second serves as
reference to perform correlation fs = fc-Δf.
 (a.2) Both shift registers have to run in parallel with
constant time lag during this time.
 (b.1) Integrator of the product detector is crucial for
the noise suppression and it largely determines the
overall sensitivity of the sensor device.
 (b.2) Waveform sweeping over the initial states of
each of the shift registers to get sampled version of
correlation function. Rather sliding, the correlator
jumps in steps of Δtc = 𝑓𝑐−1
.
 This gives sampled version of correlation function.
 Sampling interval equals the M-sequence chip
duration.
Block Diagram Of UWB Correlator
 Digital ultra-wideband correlation joins
sliding correlator and stroboscopic
sampling.
 Sub-sampling: data gathering is
distributed over several periods by
capturing the signal with the lower
sampling rate fs.
 Since No. of chips: Ns = N = 2 𝑛
− 1 ,n is
the order. sub sampling is simply
controlled by a binary divider.
 The placement of the anti-aliasing filter
depends on the measurement
environment.
Sub-Sampling Control By Binary Divider.
 Goal is in to organize a precise and simple sub-
sampling control.
 Interleaved sampling approach for single stage
binary divider; so, two stage divider would have
four periods of measurements.
 In figure, 3rd order M-sequence with 7 chips or
data samples.
 For every beat of the clock generator the voltage
is captured at every second beat.
 So, first the odd chip numbers are captured and
then the even ones.
Wanted results: IRF or FRF of DUT.
Data Reduction By Averaging
 the most efficient way permitting both a
high sampling rate and a continuous
processing of the incoming data stream.
 Shorter the binary divider, higher the
efficiency.
 Synchronous averaging- used before
applying other cascaded linear algorithms
for data reduction.
 the total number of data samples reduces by
the factor p, Synchronous averaging
performs noise suppression by the factor √p.
Digital Impulse
Compression
 If only round trip time is of interest we can apply
correlation between receive signal y(t) and the ideal
m-sequence m(t), for faster implementation. Where
IRF shape is less important.
 The known M sequence data samples arranged in the
circulant matrix Mcirc are rearranged in Hadamard
matrix for faster computing in Fast Hadamard
transform (FHT). Figure shows the Hadamard butterfly.
 ENOB-number of receiver that includes the
quantization noise and the thermal noise.
 FHT-butterfly is used which only includes sum or
difference operations which can be executed at high
processing speed.
 the correlation leads to a noise suppression by the
factor √Ns = √(2 𝑛
-1). The equation shown in figure is
equivalent to the signal with Max. SNR obtained afte
FFT or FHT operation.
Design Tetrahedron Of Digital Ultra-Wideband
Correlator
Binary divider length- relaxes the speed requirements onto
the receiver. Large dividing factor reduces data throughput
but also largely reduces sensitivity of receiver.
Recording time Tr- number p of averaging controls
recording time length. Target speed and acceleration, and
the rate of mechanical object oscillations are the dominant
parameters restricting the recording time in radar
measurements.
Pre-processing- An M-sequence sensor is typically
equipped with FPGA for data processing as
• Data reduction by averaging or Background removal
• Digital impulse compression or correlation
• Data conversion into frequency domain and error
correction, detection; round trip time estimation.
KNOCK YOUR SELF OUT!

UWB IRF correlator

  • 1.
    Focus on M-sequencesensor electronics IR-UWB: Correlator -Jayendra Mishra
  • 2.
    UWB Principle OfOperation  Ultra-wideband sensors stimulate their test objects with pulses.  UWB pulses allows following the propagation and the temporal development of energy distribution within the test scenario  Multiple chirp signals of sub nanoseconds spread over a large bandwidth are generated to get an impulse response.
  • 3.
    Measurement Complexity  Largepeak power signals represents some inconvenience of the impulse measurement technique.  Idea is to go away from excitations by strong single or infrequent ‘shocks’ and to pass instead to a stimulation of the DUT by many subtle ‘pinpricks’.  Binary pseudo-noise codes represent pulse signals which are more careful with the test objects.
  • 4.
    Binary Pseudo-Noise Codes  Pulse signalswhich have spread their energy homogenously over the whole signal length. Hence, their peak voltage remains quite small by keeping sufficient stimulation power.  PN-codes are periodic signals which constitute of a large number of individual pulses ostensible randomly distributed within the period. The theory of PN-code generation is closely connected with Galois-fields and primitive polynomials.  Summarized by the term binary PN-code they may have three (-1, 0, 1) and more signal levels.  Amalgamated properties of two signal classes  Periodic-deterministic signals  Random signals  Pseudo-noise codes examples: Barker code, M-sequence, Golay-Sequence, Gold-code, Kasami-code
  • 5.
    M-Sequence  Maximum lengthbinary sequence or shortly termed M-sequence is Simple to generate and provide best properties to measure the Impulse response function IRF.  For a given signal power, lowest amplitude and shortest autocorrelation function.  No. of flip-flops in shift register determine the length of M-sequence  Spares the measurement objects and the requirements onto the receiver dynamic are more relaxed.
  • 6.
    M-sequence Generation  Digitalshift registers with appropriate feedbacks.  Shift the starting point of the M- sequence to control the time lag of an UWB correlator.  In figure the register is of the 9th order.  Fibonacci structure deals with cascaded XOR-gates which increase the dead time before a new change of the flip-flop states is allowed.
  • 7.
    Technical Challenges  IRF measurementnot directly possible with a time extended signal such as the M-sequence.  The M-sequence signal has to be subjected to an impulse compression to gain the wanted impulse response.  The price to pay for reduced voltage in a UWB signal is the chaotic structure of the receive signal, therefore, a correlator is required for interpretation.  Intermediate frequency cannot provide a low freq. as the Nyquist bandwidth is huge for 3 GHz of bandwidth.  To perform the correlation of a very wideband signal we need.  Cross-correlation to access the wanted IRF  Digital impulse compression  Frequency domain conversion
  • 8.
    Impulse Correlator  Objective: todetermine the impulse response function of a test object.  A correlator is used to detect the presence of signals with a known waveform in a noisy background.  The output is nearly zero (below set threshold) if only noise is present.  Impulse compression is performed by the correlator
  • 9.
    Impulse Correlation  In UWB,Impulse compression using wideband correlation  Convolving with a time inverted stimulus x(-t).  Technical implementation Cross-correlation  The Sliding correlator  PN- correlation
  • 10.
    The Sliding Correlator  (a.1)Two shift registers of identical behavior make a sliding correlator. First one provides actual band limited stimulus signal at fc, and second serves as reference to perform correlation fs = fc-Δf.  (a.2) Both shift registers have to run in parallel with constant time lag during this time.  (b.1) Integrator of the product detector is crucial for the noise suppression and it largely determines the overall sensitivity of the sensor device.  (b.2) Waveform sweeping over the initial states of each of the shift registers to get sampled version of correlation function. Rather sliding, the correlator jumps in steps of Δtc = 𝑓𝑐−1 .  This gives sampled version of correlation function.  Sampling interval equals the M-sequence chip duration.
  • 11.
    Block Diagram OfUWB Correlator  Digital ultra-wideband correlation joins sliding correlator and stroboscopic sampling.  Sub-sampling: data gathering is distributed over several periods by capturing the signal with the lower sampling rate fs.  Since No. of chips: Ns = N = 2 𝑛 − 1 ,n is the order. sub sampling is simply controlled by a binary divider.  The placement of the anti-aliasing filter depends on the measurement environment.
  • 12.
    Sub-Sampling Control ByBinary Divider.  Goal is in to organize a precise and simple sub- sampling control.  Interleaved sampling approach for single stage binary divider; so, two stage divider would have four periods of measurements.  In figure, 3rd order M-sequence with 7 chips or data samples.  For every beat of the clock generator the voltage is captured at every second beat.  So, first the odd chip numbers are captured and then the even ones. Wanted results: IRF or FRF of DUT.
  • 13.
    Data Reduction ByAveraging  the most efficient way permitting both a high sampling rate and a continuous processing of the incoming data stream.  Shorter the binary divider, higher the efficiency.  Synchronous averaging- used before applying other cascaded linear algorithms for data reduction.  the total number of data samples reduces by the factor p, Synchronous averaging performs noise suppression by the factor √p.
  • 14.
    Digital Impulse Compression  Ifonly round trip time is of interest we can apply correlation between receive signal y(t) and the ideal m-sequence m(t), for faster implementation. Where IRF shape is less important.  The known M sequence data samples arranged in the circulant matrix Mcirc are rearranged in Hadamard matrix for faster computing in Fast Hadamard transform (FHT). Figure shows the Hadamard butterfly.  ENOB-number of receiver that includes the quantization noise and the thermal noise.  FHT-butterfly is used which only includes sum or difference operations which can be executed at high processing speed.  the correlation leads to a noise suppression by the factor √Ns = √(2 𝑛 -1). The equation shown in figure is equivalent to the signal with Max. SNR obtained afte FFT or FHT operation.
  • 15.
    Design Tetrahedron OfDigital Ultra-Wideband Correlator Binary divider length- relaxes the speed requirements onto the receiver. Large dividing factor reduces data throughput but also largely reduces sensitivity of receiver. Recording time Tr- number p of averaging controls recording time length. Target speed and acceleration, and the rate of mechanical object oscillations are the dominant parameters restricting the recording time in radar measurements. Pre-processing- An M-sequence sensor is typically equipped with FPGA for data processing as • Data reduction by averaging or Background removal • Digital impulse compression or correlation • Data conversion into frequency domain and error correction, detection; round trip time estimation.
  • 16.