Downloaded 29 times

![CREDITS
RESEARCH TEAM
Blaine Hackett
Co-Founder and President, Flat Rock Geographics
Tom Cox
Minnesota Power; formerly a UW-Madison student
Howard Veregin
Wisconsin State Cartographer
PHOTO CREDITS
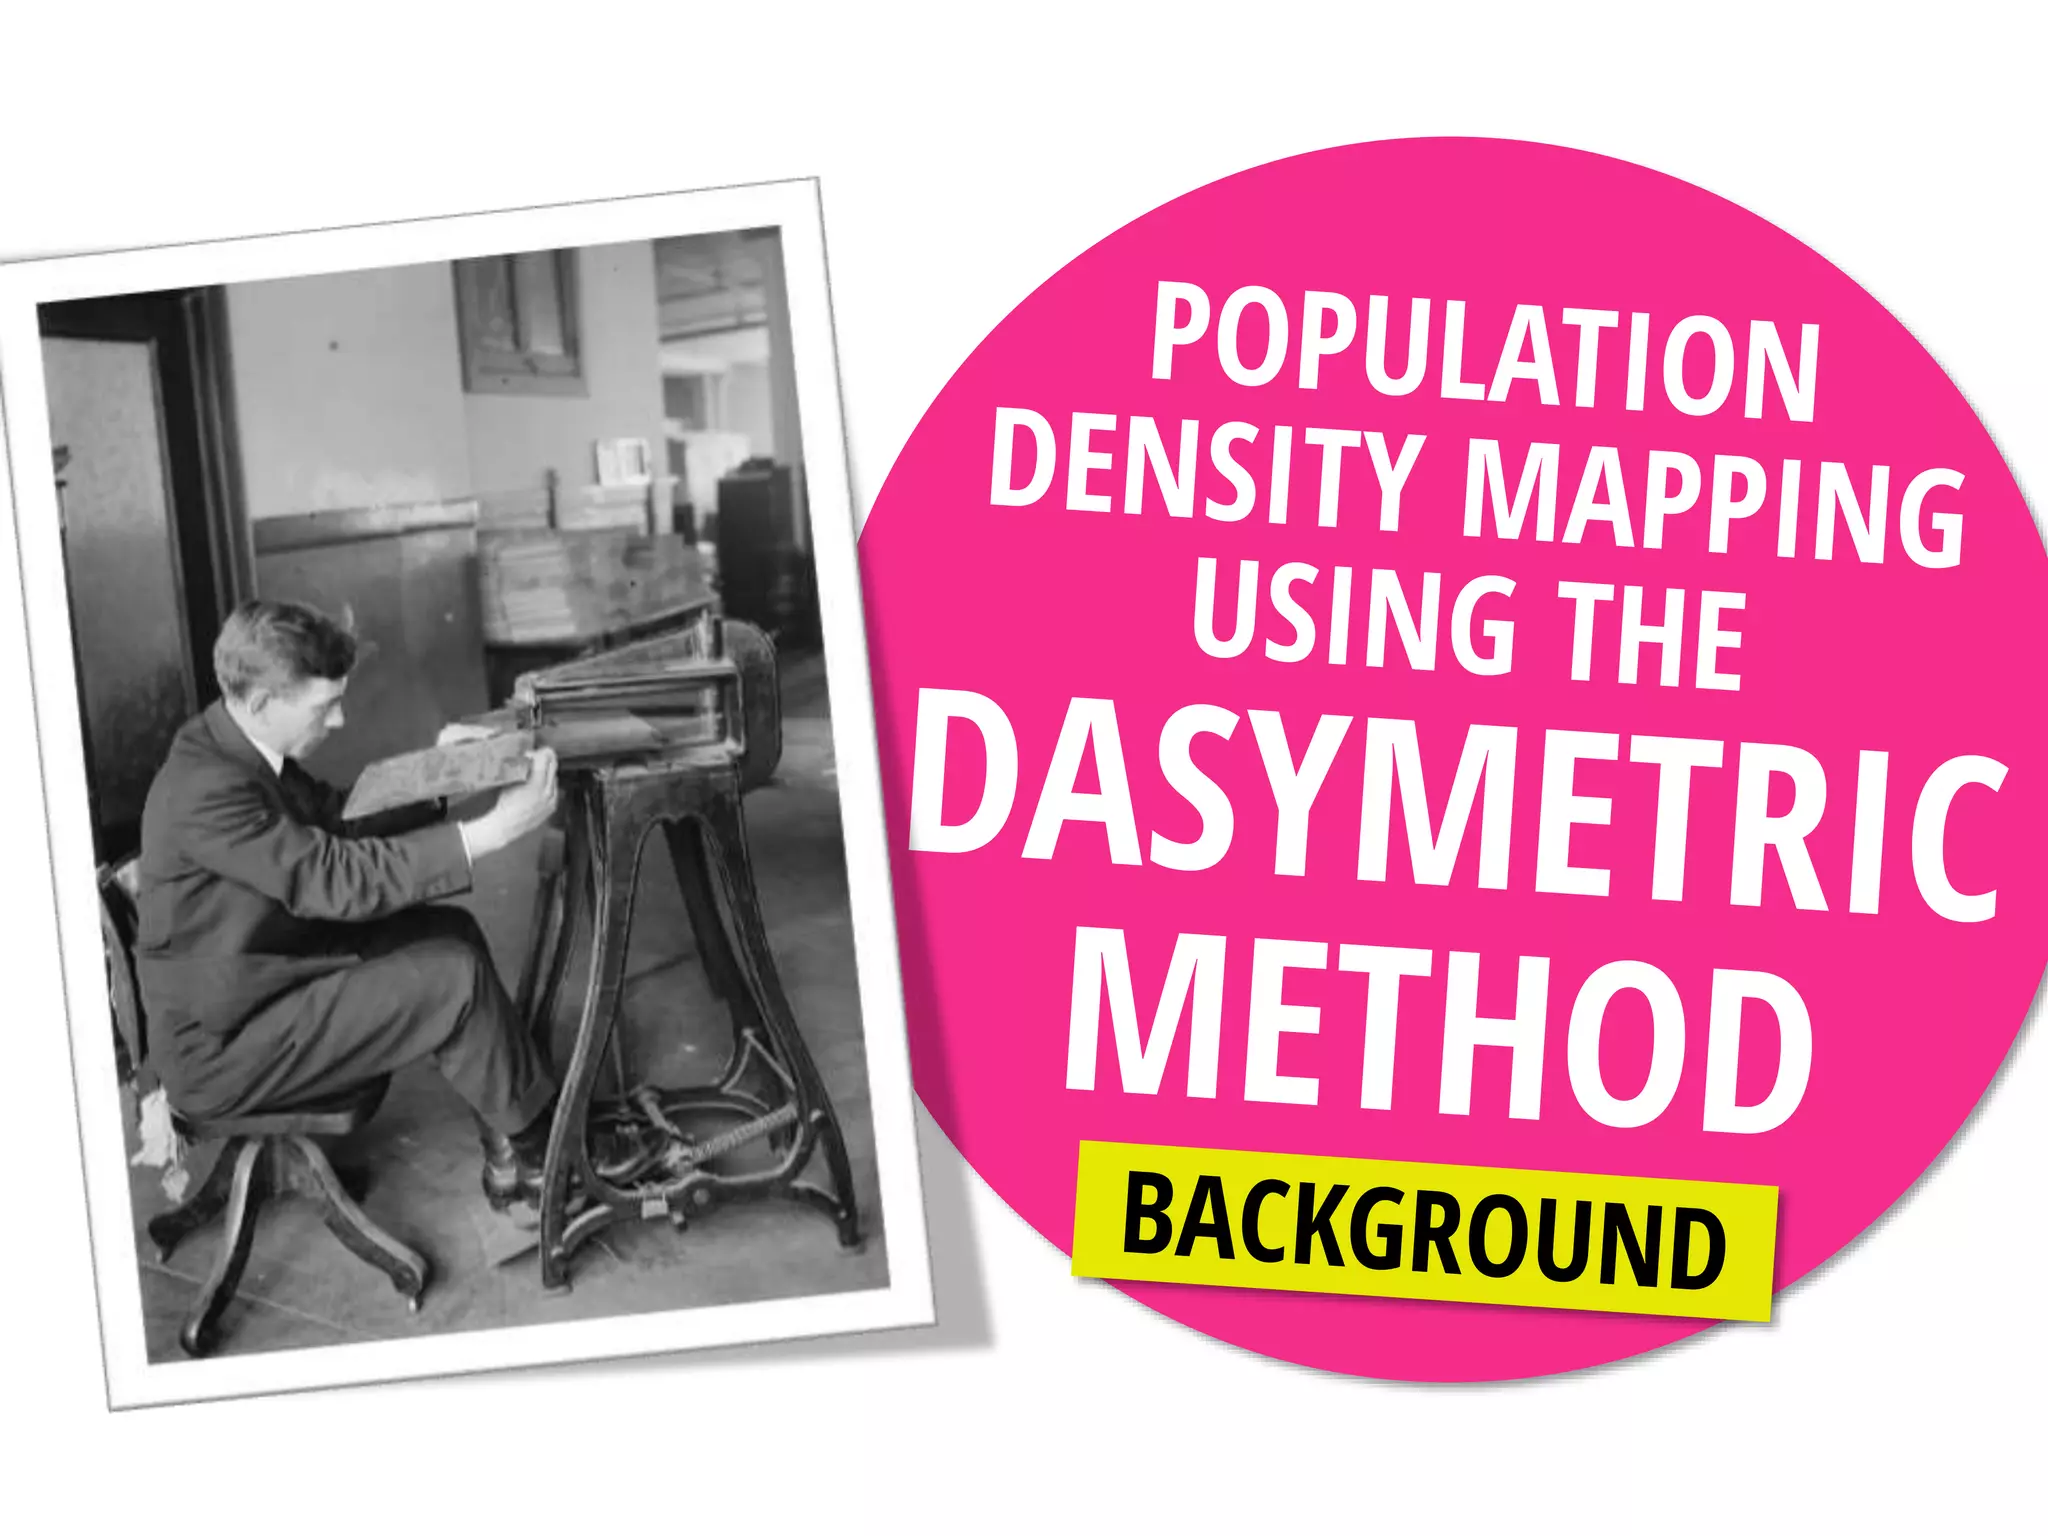
Making a map for the blind. Stefan Kühn
(http://hdl.loc.gov/loc.pnp/ggbain.19023)
[Public domain], via Wikimedia Commons.
Image of an officer and soldier making maps in France, 1917-1918.
US Army Signal Corps (US Army Center of Military History, Carlisle, PA)
[Public domain], via Wikimedia Commons
Staff Sergeant Blake Ellis, Sheel Creek, Tennessee, inking in the pencil tracings.
Culture, Hydrography, and Contours are shown. England , 01/11/1943. Department of Defense.
Department of the Army. Office of the Chief Signal Officer. (09/18/1947 - 02/28/1964) [Public
domain], via Wikimedia Commons](https://image.slidesharecdn.com/dasymetricfinal-150928133855-lva1-app6891/85/Population-Density-Mapping-using-the-Dasymetric-Method-25-320.jpg)

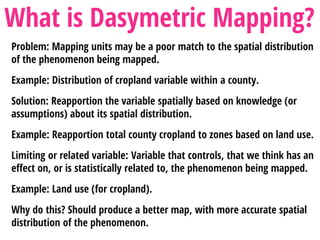
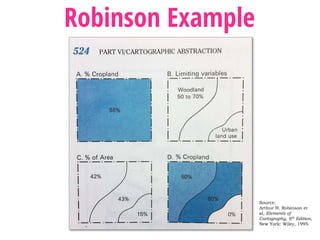
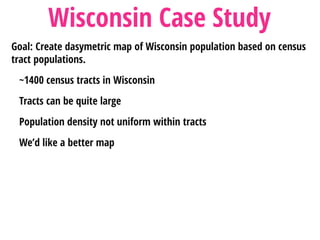
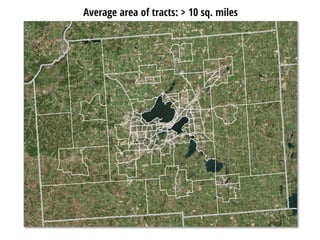
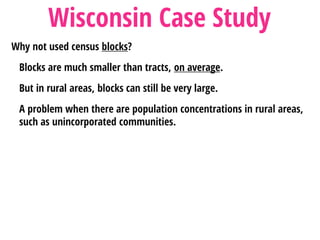
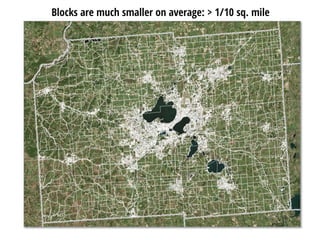
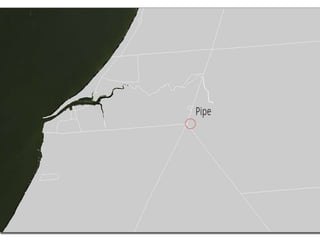
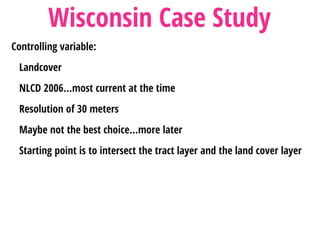
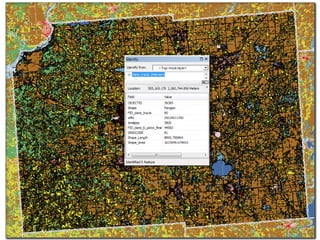
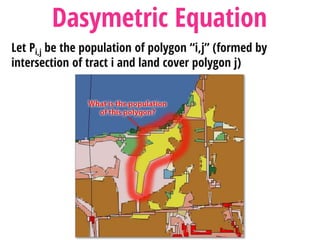
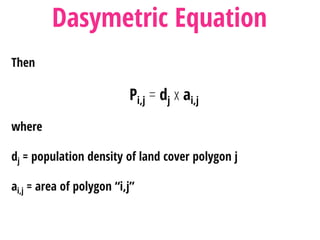
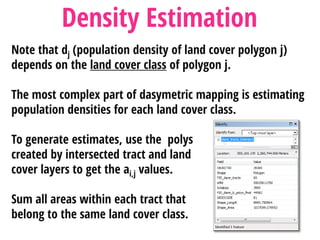
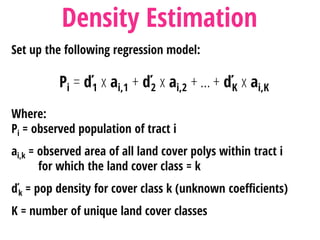
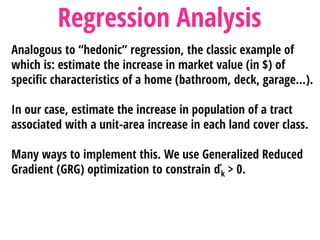
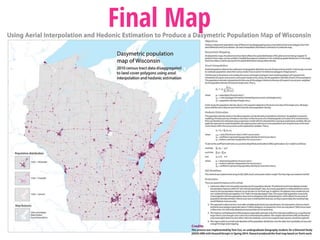
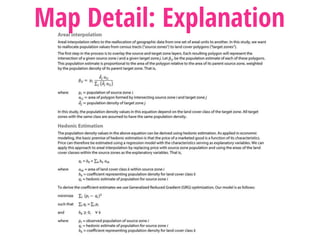
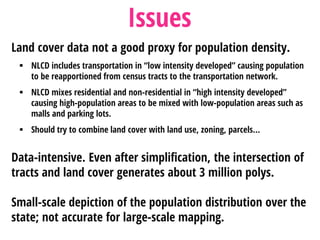
This document describes the process of dasymetric mapping to more accurately distribute population data spatially. It provides an example of mapping Wisconsin's population based on census tracts, which often do not accurately reflect population density variations within the tracts. Land cover data is used as the controlling variable to redistribute populations from census tracts to zones estimated to have different population densities based on land cover type, through a regression analysis. While an improvement over simple census tract mapping, issues include the land cover data not being a perfect proxy for population distribution.