Download to read offline


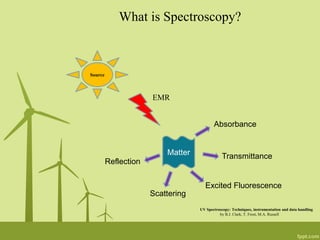
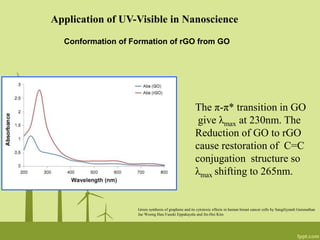
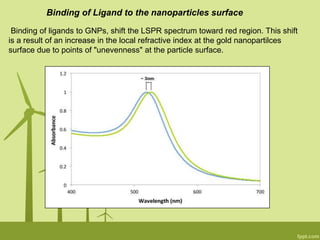
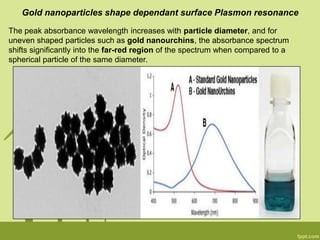
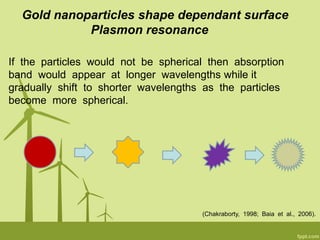
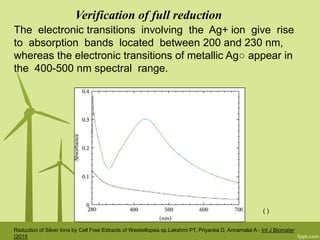

1. The presentation discusses using UV-Visible spectroscopy to analyze various nanomaterials and nanoparticles. 2. UV-Visible spectroscopy can be used to determine the formation and reduction of graphene oxide as well as monitor the formation of nanocomposites with changes in absorbance peaks. 3. The technique is also applied to study the effects of nanoparticle size, shape, aggregation state, and ligand binding on localized surface plasmon resonance peaks.