Nano scale infrared (nano-IR) spectroscopy combines atomic force microscopy (AFM) and infrared (IR) spectroscopy to analyze chemical composition and thermal properties at the nanoscale. This technique allows for high-resolution imaging and improved sample analysis compared to traditional IR methods, though it requires meticulous sample preparation. Applications include studying biological samples, drug-polymer interactions, and surface characteristics in various materials.
![INTRODUCTION
Also called as AFM-IR spectroscopy / NANO IR spectroscopy.
Combines the efficiency of AFM ( Atomic force microscopy) with the IR
spectroscopy at NANO level to characterize the samples. [1]
3](https://image.slidesharecdn.com/nanoscaleirspectroscopyafm-irspectroscopy-210818122946/85/Nanoscale-IR-spectroscopy-AFM-IR-Spectroscopy-3-320.jpg)
![HISTORY
Introduced: Dr. Alexandre Dazzi in 1990
Practically proved: Hammiche in 1999
1st experiment: Anderson in 2000 [2]
4](https://image.slidesharecdn.com/nanoscaleirspectroscopyafm-irspectroscopy-210818122946/85/Nanoscale-IR-spectroscopy-AFM-IR-Spectroscopy-4-320.jpg)
![WHY DO WE NEED NANO IR SPECTROSCOPY?
5
o AFM: To measure the topography, mechanical, thermal, electrical, mechanical
properties of the samples at nano scale.
o IR: To determine the chemical composition of the samples
o AFM-IR: To determine the chemical composition and thermal properties with
the help of AFM tip at nano scale spatial resolution. [3]](https://image.slidesharecdn.com/nanoscaleirspectroscopyafm-irspectroscopy-210818122946/85/Nanoscale-IR-spectroscopy-AFM-IR-Spectroscopy-5-320.jpg)
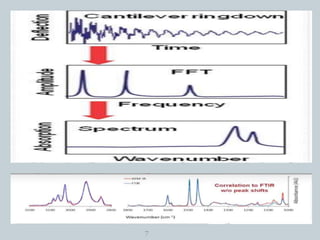
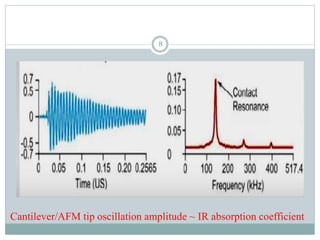
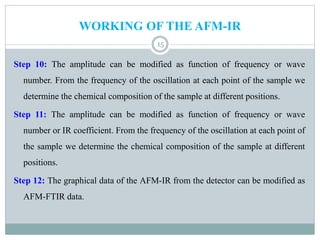
![PRINCIPLE
Cantilever/AFM tip oscillation amplitude ~ IR absorption coefficient
When IR radiation falls on the sample that heats the sample and makes the
sample to expand.
This thermal expansion is detected by the tip of the cantilever which oscillates
upon the physical changes of samples.
The oscillations are detected by the photodiode detector. [4]
6](https://image.slidesharecdn.com/nanoscaleirspectroscopyafm-irspectroscopy-210818122946/85/Nanoscale-IR-spectroscopy-AFM-IR-Spectroscopy-6-320.jpg)
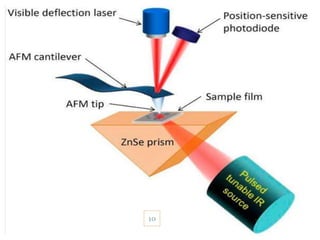
![INSTRUMENTATION
IR source
Prism
Cantilever and tip (AFM Tip)
Laser
Quadrant photo diode detector[4]
9](https://image.slidesharecdn.com/nanoscaleirspectroscopyafm-irspectroscopy-210818122946/85/Nanoscale-IR-spectroscopy-AFM-IR-Spectroscopy-9-320.jpg)
![11
AFM-IR by ANASYS 2nd generation [8]](https://image.slidesharecdn.com/nanoscaleirspectroscopyafm-irspectroscopy-210818122946/85/Nanoscale-IR-spectroscopy-AFM-IR-Spectroscopy-11-320.jpg)
![SAMPLE PREPARATION
There are two ways:
o Ultra-micro -tomy: To cut sections with thicknesses between 100 nm and
1000 nm.
o Thin films: With suitable volatile solvents. [5]
12](https://image.slidesharecdn.com/nanoscaleirspectroscopyafm-irspectroscopy-210818122946/85/Nanoscale-IR-spectroscopy-AFM-IR-Spectroscopy-12-320.jpg)
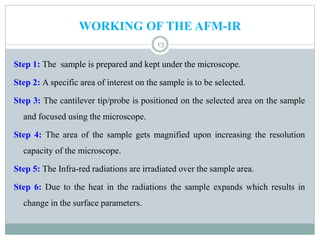
![ADVANTAGES
Sample can be analyzed at nano-level {as for IR it is restricted to micro levels}
3- D imaging of crystal samples.
Surface roughness information.
The spectral data can be correlated to FTIR and obtain nano scale FTIR
10nm resolution and monolayer sensitivity IR chemical imaging
High speed chemical imaging - 10x faster
We can also apply for biological membranes.
Diffraction limit is 100x more compared to IR
Correlates microscopy with spectroscopy. [7]
18](https://image.slidesharecdn.com/nanoscaleirspectroscopyafm-irspectroscopy-210818122946/85/Nanoscale-IR-spectroscopy-AFM-IR-Spectroscopy-18-320.jpg)
![DISADVANTAGES
19
The sample preparation is needed to be done properly without any dust or
impurities as the AFM tip is highly sensitive to rough surfaces. [7]](https://image.slidesharecdn.com/nanoscaleirspectroscopyafm-irspectroscopy-210818122946/85/Nanoscale-IR-spectroscopy-AFM-IR-Spectroscopy-19-320.jpg)
![APPLICATIONS
To study the infections of bacteriophages
To evaluate and map mineral content, crystallinity, collagen maturity and acid
phosphate content in bone.
To perform spectroscopy and chemical mapping of structural lipids in human
skin and hair.
The measurements revealed the distribution of free and ionically bound water
on the surface of samples.
Used to study the surface plasma on resonance in heavily doped indium micro
particles.
Used to study miscibility and phase separation in drug polymer blends, well as
the chemical analysis of nanocrystalline drug particles as small 90 nm across.
[6]
20](https://image.slidesharecdn.com/nanoscaleirspectroscopyafm-irspectroscopy-210818122946/85/Nanoscale-IR-spectroscopy-AFM-IR-Spectroscopy-20-320.jpg)
![IR vs AFM-IR
21
CATEGORY IR AFM-IR
Sample preparation Simple and easy Should be done carefully
Analysis Chemical composition
Both chemical composition
and surface analysis
Spectral resolution Low High (100x)
Sample concentration
Can be done from micro
level
Can be done nano level
Time bound More time Less time
3-D imaging No Yes
Data correlation No Can correlate with FTIR[5]](https://image.slidesharecdn.com/nanoscaleirspectroscopyafm-irspectroscopy-210818122946/85/Nanoscale-IR-spectroscopy-AFM-IR-Spectroscopy-21-320.jpg)
![CASE STUDY 1: STUDY OF POLYSTYRENE SPHERES
22
Polystyrene is micro-tomes to layers.
The layer is focused by radiation
There is an maximum absorption of radiation at 2025cm−1 which corresponds
to the aromatic bonds in the polystyrene. [6]](https://image.slidesharecdn.com/nanoscaleirspectroscopyafm-irspectroscopy-210818122946/85/Nanoscale-IR-spectroscopy-AFM-IR-Spectroscopy-22-320.jpg)
![ An AFM image with nano-TA data of a toner particle. The particle was
embedded in epoxy and microtome. The topography of the sample shows
variations in structure, which can then be analyzed using nano-TA. Toner
particles include a number of components (wax, resin, dye, etc.) that exhibit
different transition temperatures. [6]
23
CASE STUDY 2: NANO SCALE THERMALANALYSIS](https://image.slidesharecdn.com/nanoscaleirspectroscopyafm-irspectroscopy-210818122946/85/Nanoscale-IR-spectroscopy-AFM-IR-Spectroscopy-23-320.jpg)
![COMPANIES THAT ARE UTILISING THE INSTRUMENT
24
COMPANY /LAB PURPOSE OF UTILISATION
Knowles Lab, University Cambridge
Characterization of heterogeneous
biological protein samples.
Laboratory of the Physics of Living Matter,
Switzerland
In the area of protein misfolding and
aggregation.
Laboratory of Polymer Physics and
Chemistry, Japan
Studying polymeric materials.
Dow Chemicals Pvt Ltd, USA Chemistry in the morphology. [7]](https://image.slidesharecdn.com/nanoscaleirspectroscopyafm-irspectroscopy-210818122946/85/Nanoscale-IR-spectroscopy-AFM-IR-Spectroscopy-24-320.jpg)
![GENERATIONS OF NANO-IR [8]
25](https://image.slidesharecdn.com/nanoscaleirspectroscopyafm-irspectroscopy-210818122946/85/Nanoscale-IR-spectroscopy-AFM-IR-Spectroscopy-25-320.jpg)
![REFERENCES
27
5. Bondy AL, Kirpes RM, Merzel RL, Pratt KA, Banaszak Holl MM, Ault AP.
Analytical chemistry.4 1st ed. United states. ACS Publications. 2017; 8594-8598.
6. Dazzi A, Prater CB. AFM-IR: Technology and Applications in Nanoscale Infrared
Spectroscopy and Chemical Imaging. 4th ed. United states. ACS Publications.2017;
5146-5173.
7. Bruker Nano Surfaces [cited 28 July 2020]. Available from:
https://www.youtube.com/user/BrukerNanoSurfaces.://www.youtube.com/user/Bruk
er NanoSurfaces.
8. AFMIR Nano Spectroscopy [cited 28 July 2020]. Available from:
https://en.wikipedia.org/wiki/AFMIR #Nano Spectroscopy.](https://image.slidesharecdn.com/nanoscaleirspectroscopyafm-irspectroscopy-210818122946/85/Nanoscale-IR-spectroscopy-AFM-IR-Spectroscopy-27-320.jpg)