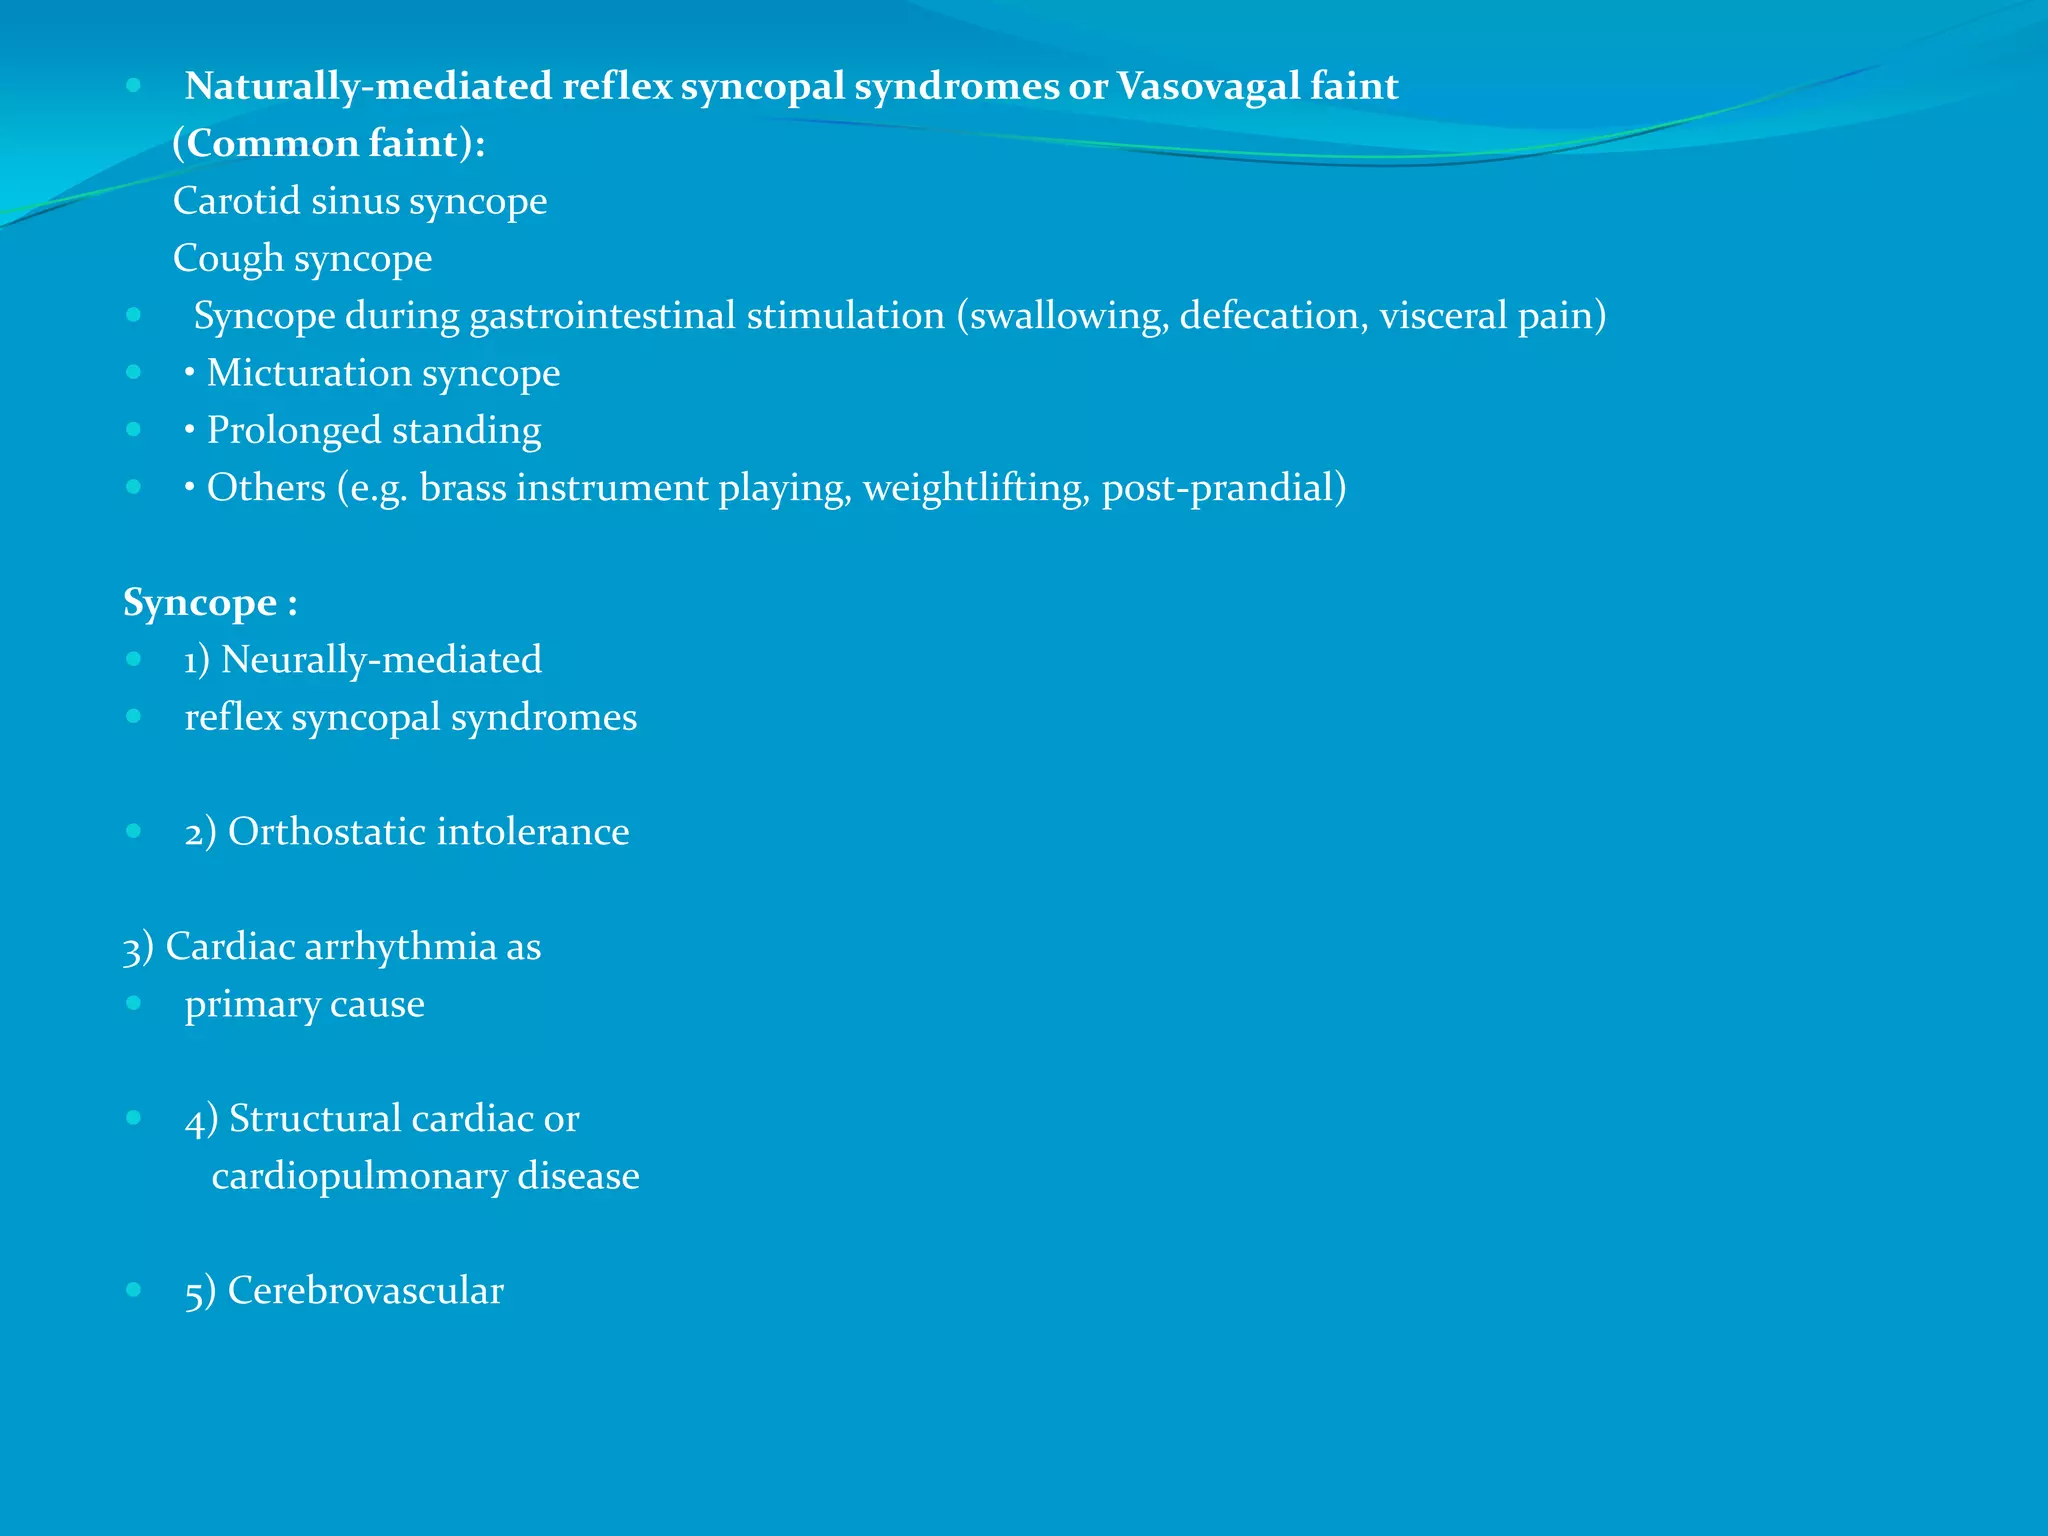
I had presented in CARE Highlights session and book is being published on this topic by LAMBERT publications, Germany
http://www.google.co.in/url?sa=t&rct=j&q=&esrc=s&frm=1&source=web&cd=1&cad=rja&ved=0CCoQFjAA&url=http%3A%2F%2Fwww.amazon.in%2FEvaluation-Unexplained-Syncope-Young-Adults%2Fdp%2F3843373175&ei=lzVtUvbtCIfSrQemkYDwCg&usg=AFQjCNEK_NmIVC5j5LcLSr2hKbYFwMmRuw&sig2=okLwwgOdFiPgw4GPk7mugQ&bvm=bv.55123115,d.bmk
Various coronary physiological measurements can be made in the cardiac catheterization laboratory using sensor-tipped guidewires; they include the measurement of poststenotic absolute coronary flow reserve, the relative coronary flow reserve, and the pressure-derived fractional flow reserve of the myocardium. Ambiguity regarding abnormal microcirculation has been reduced or eliminated with measurements of relative coronary flow reserve and fractional flow reserve. The role of microvascular flow impairment can be separately determined with coronary flow velocity reserve measurements. In addition to lesion assessment before and after intervention, emerging applications of coronary physiology include the determination of physiological responses to new pharmacological agents, such as glycoprotein IIb/IIIa blockers, in patients with acute myocardial infarction. Measurements of coronary physiology in the catheterization laboratory provide objective data that complement angiography for clinical decision-making
In cases of right atrial enlargement the duration of the P wave hardly changes, but the P-R interval increases, so that the P--R segment ratio falls below the normal range.Left atrial enlargement, on the other hand,does not affect the P-R interval, but the P wave lengthens at the expense of the P-R segment.The result is a- ratio above P-R segment the normal maximal limit of 1.6.In combined atrial enlargement, both P-R interval and P wave are prolonged. It follows that in such cases the ratio may P-R segment
be normal.
Case-1:
A 23 years old medical student presented with occasional palpitation, shortness of breath and chest discomfort. He had the following ECG.
A 53 years old gentleman presented with palpitations for last 5 hours. He is smoker, diabetic, dyslipidemic and hypertensive. He had exertional chest discomfort for last 5 years and did coronary angiogram 3 years back and CAG revealed TVD and advised for revascularization. But he refused and was irregular in medication and reluctant for life style modification. He came to emergency department with this ECG.
Introduction to Electrophysiology - Supraventricular Tachycardias (1/4 lectures)Jose Osorio
What is cardiac Electrophysiology?
This presentation will cover basics of EP. It is Part 1 of 4 lectures about EP.
Part 1 - basics of EP and Supraventricular Tachycardias (SVT)
Part 2 - Ventricular arrhythmias and Cardiac Devices
Part 3 - Afib
Part 4 - EKG
There are many interventional cardiac procedure those need a trans septal puncture of the interatrial septum. This presentation clearly elaborates everything you need to know about the TSP.
Tilt table is a padded table that can be elevated from horizontal position to vertical position. It is used in a therapeutic setting for physiological accommodation to upright position, facilitate early weight bearing, cardiovascular conditioning etc.
Presentazione dell'Ing. Agostino Cirasa al seminario: "Opendata e territorio, esperienze siciliane a confronto", tenutosi il 19/01/2014 presso l'Istituto "Testasecca" di Caltanissetta. Organizzato dall'Ordine degli Ingegneri della provincia di Caltanissetta.
Presentation on Duty based on the value arrived at on basis of Valuation under Section 4.Sec 3(2),(Sec 4A). Most relevent and easily defined presentation.
Ramayana is an ancient epic written by Valmiki. Today it have been considered as a management bible by all top B-schools across the globe. It defines the transformational leadership qualities of Lord Rama. It also give a clear indication of hidden qualities and abilities of employees which need to be ignited by leaders.
Swot analysis of automobile industry in IndiaShri Theja
SWOT is an important tool to understand the internal and external that affect on company's operations. This is a presentation on Swot analysis of automobile industry in India; that will help students of MBA, BBM and other discipline during exams and presentations.
Cost control and cost reduction are the two most viewed area in finance. Every corporate entity will have a specialized department to study on cost aspects. Apart from finance it is places a great role in micro economics.This presentation will helpful to university students in their study and enhance greater knowledge.
The autonomic nervous system (ANS) controls all body functions. Dysregulation of this system may be responsible of bradycardia. The main objective of our study is to describe the autonomic profile of patients with bradycardia and to determine, through testing cardiovascular autonomic reflexes its involvement in the pathogenesis of idiopathic symptomatic bradycardia.
To study the variations of autonomic nervous system in hypertensive patients using a set of autonomic function tests
and to correlate cardiac autonomic function with Heart rate variability in hypertensives. Background: The pathophysiological mechanism for the development of hypertension is the lack of balance between sympathetic and parasympathetic nervous system. Both Heart rate variability (HRV) and Autonomic function tests provide a tool to know the concept of autonomic modulation of heart. They also forms an index of cardiac autonomic regulation. Methods: The study included 50 hypertensive patients and 50 normotensive
subjects. All the subjects underwent for the analysis of heart rate variability in time domain (TD) and frequency domain and a set of autonomic function tests were done to assess the autonomic functions. These results were compared with age and sex matched controls (normotensives). The subjects were selected based on exclusion-inclusion criteria. Results: Results showed that S: L ratio, Valsalva ratio & Heart rate response to deep breathing test values were decreased in Hypertensives as compared to Normotensives (p<0.05).><0.05). Both the time domain and frequency domain values of HRV reduced significantly in hypertensives indicated that there is increased sympathetic activity and decreased parasympathetic activity. Conclusion: From this study, it is evident that Hypertension can alter the normal autonomic functions of the body and predisposes to autonomic neuropathy. Early and regular screening of these individuals is necessary to prevent any future complications.
Heart Rate Variability (HRV) is the measure of time difference between two successive heart beats and its
variation occurring due to internal and external stimulation causes. HRV is a non-invasive tool for indirect
investigation of both cardiac and autonomic system function in both healthy and diseased condition. It has
been speculated that HRV analysis by nonlinear method might bring potentially useful prognosis
information into light which will be helpful for assessment of cardiac condition. In this study, HRV from
two types of data sets are analyzed which are collected from different subjects in the age group of 18 to 22.
Then parameters of linear methods and three nonlinear methods, approximate entropy (ApEn), detrended
fluctuation analysis (DFA) and Poincare plot have been applied to analyze HRV among 158 subjects of
which 79 are control study and 79 are alcoholics. It has been clearly shown that the linear and nonlinear
parameters obtained from these two methods reflect the opposite heart condition of the two types of data
under study among alcoholics non-alcoholic’s by HRV measures. Poincare plot clearly distinguishes
between the alcoholics by analysing the location of points in the ellipse of the Poincare plot. In alcoholics
the points of the Poincare plot will be concentrated at the centre of the ellipse and in nonalchoholics the
points will be much concentrated along the periphery of the ellipse. The Approximate Entropy value will be
lesser than one in alcoholics and in nonalcoholics the entropy shows values greater than one. The
increased LF/HF value in alcoholics denotes the increase in sympathetic nervous system activities and
decrease of the parasympathetic activity which will be lesser in alcoholics subjects.
A STUDY ON IMPACT OF ALCOHOL AMONG YOUNG INDIAN POPULATION USING HRV ANALYSISijcseit
Heart Rate Variability (HRV) is the measure of time difference between two successive heart beats and its
variation occurring due to internal and external stimulation causes. HRV is a non-invasive tool for indirect
investigation of both cardiac and autonomic system function in both healthy and diseased condition. It has
been speculated that HRV analysis by nonlinear method might bring potentially useful prognosis
information into light which will be helpful for assessment of cardiac condition. In this study, HRV from
two types of data sets are analyzed which are collected from different subjects in the age group of 18 to 22.
Then parameters of linear methods and three nonlinear methods, approximate entropy (ApEn), detrended
fluctuation analysis (DFA) and Poincare plot have been applied to analyze HRV among 158 subjects of
which 79 are control study and 79 are alcoholics. It has been clearly shown that the linear and nonlinear
parameters obtained from these two methods reflect the opposite heart condition of the two types of data
under study among alcoholics non-alcoholic’s by HRV measures. Poincare plot clearly distinguishes
between the alcoholics by analysing the location of points in the ellipse of the Poincare plot. In alcoholics
the points of the Poincare plot will be concentrated at the centre of the ellipse and in nonalchoholics the
points will be much concentrated along the periphery of the ellipse. The Approximate Entropy value will be
lesser than one in alcoholics and in nonalcoholics the entropy shows values greater than one. The
increased LF/HF value in alcoholics denotes the increase in sympathetic nervous system activities and
decrease of the parasympathetic activity which will be lesser in alcoholics subjects.
Title: Sense of Taste
Presenter: Dr. Faiza, Assistant Professor of Physiology
Qualifications:
MBBS (Best Graduate, AIMC Lahore)
FCPS Physiology
ICMT, CHPE, DHPE (STMU)
MPH (GC University, Faisalabad)
MBA (Virtual University of Pakistan)
Learning Objectives:
Describe the structure and function of taste buds.
Describe the relationship between the taste threshold and taste index of common substances.
Explain the chemical basis and signal transduction of taste perception for each type of primary taste sensation.
Recognize different abnormalities of taste perception and their causes.
Key Topics:
Significance of Taste Sensation:
Differentiation between pleasant and harmful food
Influence on behavior
Selection of food based on metabolic needs
Receptors of Taste:
Taste buds on the tongue
Influence of sense of smell, texture of food, and pain stimulation (e.g., by pepper)
Primary and Secondary Taste Sensations:
Primary taste sensations: Sweet, Sour, Salty, Bitter, Umami
Chemical basis and signal transduction mechanisms for each taste
Taste Threshold and Index:
Taste threshold values for Sweet (sucrose), Salty (NaCl), Sour (HCl), and Bitter (Quinine)
Taste index relationship: Inversely proportional to taste threshold
Taste Blindness:
Inability to taste certain substances, particularly thiourea compounds
Example: Phenylthiocarbamide
Structure and Function of Taste Buds:
Composition: Epithelial cells, Sustentacular/Supporting cells, Taste cells, Basal cells
Features: Taste pores, Taste hairs/microvilli, and Taste nerve fibers
Location of Taste Buds:
Found in papillae of the tongue (Fungiform, Circumvallate, Foliate)
Also present on the palate, tonsillar pillars, epiglottis, and proximal esophagus
Mechanism of Taste Stimulation:
Interaction of taste substances with receptors on microvilli
Signal transduction pathways for Umami, Sweet, Bitter, Sour, and Salty tastes
Taste Sensitivity and Adaptation:
Decrease in sensitivity with age
Rapid adaptation of taste sensation
Role of Saliva in Taste:
Dissolution of tastants to reach receptors
Washing away the stimulus
Taste Preferences and Aversions:
Mechanisms behind taste preference and aversion
Influence of receptors and neural pathways
Impact of Sensory Nerve Damage:
Degeneration of taste buds if the sensory nerve fiber is cut
Abnormalities of Taste Detection:
Conditions: Ageusia, Hypogeusia, Dysgeusia (parageusia)
Causes: Nerve damage, neurological disorders, infections, poor oral hygiene, adverse drug effects, deficiencies, aging, tobacco use, altered neurotransmitter levels
Neurotransmitters and Taste Threshold:
Effects of serotonin (5-HT) and norepinephrine (NE) on taste sensitivity
Supertasters:
25% of the population with heightened sensitivity to taste, especially bitterness
Increased number of fungiform papillae
Title: Sense of Smell
Presenter: Dr. Faiza, Assistant Professor of Physiology
Qualifications:
MBBS (Best Graduate, AIMC Lahore)
FCPS Physiology
ICMT, CHPE, DHPE (STMU)
MPH (GC University, Faisalabad)
MBA (Virtual University of Pakistan)
Learning Objectives:
Describe the primary categories of smells and the concept of odor blindness.
Explain the structure and location of the olfactory membrane and mucosa, including the types and roles of cells involved in olfaction.
Describe the pathway and mechanisms of olfactory signal transmission from the olfactory receptors to the brain.
Illustrate the biochemical cascade triggered by odorant binding to olfactory receptors, including the role of G-proteins and second messengers in generating an action potential.
Identify different types of olfactory disorders such as anosmia, hyposmia, hyperosmia, and dysosmia, including their potential causes.
Key Topics:
Olfactory Genes:
3% of the human genome accounts for olfactory genes.
400 genes for odorant receptors.
Olfactory Membrane:
Located in the superior part of the nasal cavity.
Medially: Folds downward along the superior septum.
Laterally: Folds over the superior turbinate and upper surface of the middle turbinate.
Total surface area: 5-10 square centimeters.
Olfactory Mucosa:
Olfactory Cells: Bipolar nerve cells derived from the CNS (100 million), with 4-25 olfactory cilia per cell.
Sustentacular Cells: Produce mucus and maintain ionic and molecular environment.
Basal Cells: Replace worn-out olfactory cells with an average lifespan of 1-2 months.
Bowman’s Gland: Secretes mucus.
Stimulation of Olfactory Cells:
Odorant dissolves in mucus and attaches to receptors on olfactory cilia.
Involves a cascade effect through G-proteins and second messengers, leading to depolarization and action potential generation in the olfactory nerve.
Quality of a Good Odorant:
Small (3-20 Carbon atoms), volatile, water-soluble, and lipid-soluble.
Facilitated by odorant-binding proteins in mucus.
Membrane Potential and Action Potential:
Resting membrane potential: -55mV.
Action potential frequency in the olfactory nerve increases with odorant strength.
Adaptation Towards the Sense of Smell:
Rapid adaptation within the first second, with further slow adaptation.
Psychological adaptation greater than receptor adaptation, involving feedback inhibition from the central nervous system.
Primary Sensations of Smell:
Camphoraceous, Musky, Floral, Pepperminty, Ethereal, Pungent, Putrid.
Odor Detection Threshold:
Examples: Hydrogen sulfide (0.0005 ppm), Methyl-mercaptan (0.002 ppm).
Some toxic substances are odorless at lethal concentrations.
Characteristics of Smell:
Odor blindness for single substances due to lack of appropriate receptor protein.
Behavioral and emotional influences of smell.
Transmission of Olfactory Signals:
From olfactory cells to glomeruli in the olfactory bulb, involving lateral inhibition.
Primitive, less old, and new olfactory systems with different path
Ozempic: Preoperative Management of Patients on GLP-1 Receptor Agonists Saeid Safari
Preoperative Management of Patients on GLP-1 Receptor Agonists like Ozempic and Semiglutide
ASA GUIDELINE
NYSORA Guideline
2 Case Reports of Gastric Ultrasound
Explore natural remedies for syphilis treatment in Singapore. Discover alternative therapies, herbal remedies, and lifestyle changes that may complement conventional treatments. Learn about holistic approaches to managing syphilis symptoms and supporting overall health.
New Drug Discovery and Development .....NEHA GUPTA
The "New Drug Discovery and Development" process involves the identification, design, testing, and manufacturing of novel pharmaceutical compounds with the aim of introducing new and improved treatments for various medical conditions. This comprehensive endeavor encompasses various stages, including target identification, preclinical studies, clinical trials, regulatory approval, and post-market surveillance. It involves multidisciplinary collaboration among scientists, researchers, clinicians, regulatory experts, and pharmaceutical companies to bring innovative therapies to market and address unmet medical needs.
Lung Cancer: Artificial Intelligence, Synergetics, Complex System Analysis, S...Oleg Kshivets
RESULTS: Overall life span (LS) was 2252.1±1742.5 days and cumulative 5-year survival (5YS) reached 73.2%, 10 years – 64.8%, 20 years – 42.5%. 513 LCP lived more than 5 years (LS=3124.6±1525.6 days), 148 LCP – more than 10 years (LS=5054.4±1504.1 days).199 LCP died because of LC (LS=562.7±374.5 days). 5YS of LCP after bi/lobectomies was significantly superior in comparison with LCP after pneumonectomies (78.1% vs.63.7%, P=0.00001 by log-rank test). AT significantly improved 5YS (66.3% vs. 34.8%) (P=0.00000 by log-rank test) only for LCP with N1-2. Cox modeling displayed that 5YS of LCP significantly depended on: phase transition (PT) early-invasive LC in terms of synergetics, PT N0—N12, cell ratio factors (ratio between cancer cells- CC and blood cells subpopulations), G1-3, histology, glucose, AT, blood cell circuit, prothrombin index, heparin tolerance, recalcification time (P=0.000-0.038). Neural networks, genetic algorithm selection and bootstrap simulation revealed relationships between 5YS and PT early-invasive LC (rank=1), PT N0—N12 (rank=2), thrombocytes/CC (3), erythrocytes/CC (4), eosinophils/CC (5), healthy cells/CC (6), lymphocytes/CC (7), segmented neutrophils/CC (8), stick neutrophils/CC (9), monocytes/CC (10); leucocytes/CC (11). Correct prediction of 5YS was 100% by neural networks computing (area under ROC curve=1.0; error=0.0).
CONCLUSIONS: 5YS of LCP after radical procedures significantly depended on: 1) PT early-invasive cancer; 2) PT N0--N12; 3) cell ratio factors; 4) blood cell circuit; 5) biochemical factors; 6) hemostasis system; 7) AT; 8) LC characteristics; 9) LC cell dynamics; 10) surgery type: lobectomy/pneumonectomy; 11) anthropometric data. Optimal diagnosis and treatment strategies for LC are: 1) screening and early detection of LC; 2) availability of experienced thoracic surgeons because of complexity of radical procedures; 3) aggressive en block surgery and adequate lymph node dissection for completeness; 4) precise prediction; 5) adjuvant chemoimmunoradiotherapy for LCP with unfavorable prognosis.
micro teaching on communication m.sc nursing.pdfAnurag Sharma
Microteaching is a unique model of practice teaching. It is a viable instrument for the. desired change in the teaching behavior or the behavior potential which, in specified types of real. classroom situations, tends to facilitate the achievement of specified types of objectives.
- Video recording of this lecture in English language: https://youtu.be/lK81BzxMqdo
- Video recording of this lecture in Arabic language: https://youtu.be/Ve4P0COk9OI
- Link to download the book free: https://nephrotube.blogspot.com/p/nephrotube-nephrology-books.html
- Link to NephroTube website: www.NephroTube.com
- Link to NephroTube social media accounts: https://nephrotube.blogspot.com/p/join-nephrotube-on-social-media.html
2. SYNCOPE
Syncope is “characterized by sudden, brief loss of consciousness
and postural tone followed by spontaneous recovery”.
Morichetti et al, have shown that syncope is a common presenting
problem in health care settings, accounting for 3% to 5% of
emergency room visits and 1% to 3% of hospital admissions1
Despite major advances in our understanding of the mechanisms
and underlying causes of syncope, its etiology often remains a
diagnostic dilemma.
Commonly used approach though adequate in majority leads to
misdiagnosis and waste of resources
- Routinely prescribed tests are 24 Hour HOLTER, EEG, CT Scan
etc which are quite useless in majority.
3. Syncope is a sudden and brief loss of consciousness
associated with a loss of postural tone, from which
recovery is spontaneous.
Usually the loss of consciousness is for 20 -30 seconds
and the underlying mechanism is a transient global
cerebral hypoperfusion.
Syncope is a transient symptom and not a disease
4. In the present evidence based clinical practice,
experience with the technology on evaluation of
syncope is not sufficiently well developed to formulate
guidelines by the formal American College Cardiology
(ACC)/American Heart Association (AHA).
Only Expert Consensus documents are available and
these form the best attempt of the ACC to inform and
guide clinical practice in areas where rigorous evidence
is not yet available.
5. Indian Literature
Medline search has revealed only two studies on
evaluation of syncope in Indian population.
1) One study, described orthostatic tolerance of normal
Indians comparing those with abnormal
cardiovascular status4.
2) And another study described the utility of Head-uptilt-testing (HUTT) in pediatric patients suspected of
neurocardiogenic syncope5.
6. HUTT has important role in initial evaluation of those
with unexplained syncope especially when vasovagal
syncope is suspected.
It has the advantage of being a provocative test and
provides hemodynamic as well as cardiac rhythm data
during symptoms.
Besides pulse and blood pressure monitoring, heart
rate variability analysis was done during tilt table to
find early predictors of positive test.
7. To evaluate patients presenting with syncope by
history, examination and Electrocardiogram.
In patients with unexplained syncope perform tilt
table test and arrhythmia monitoring for 24 hours.
To analyze the utility value of these tests in reaching a
diagnosis in patients with unexplained syncope.
9. UNEXPLAINED SYNCOPE
In patients who present with primary complaint of
syncope, after initial clinical evaluation and baseline ECG if no diagnosis of cause of syncope is made, or no etiology
of syncope is suggested, then they are worked up for
‘unexplained syncope’.
In patients with a suggested etiology for syncope, after
specific targeted testing and no diagnosis was reached then
they were worked up as unexplained syncope2,3.
Patients clinically suspected of neurocardiogenic syncope
were classified as having unexplained syncope as there is
no diagnostic test for neurocardiogenic syncope other than
tilt table testing.
10. EXCLUSION CRITERIA
Patients with loss of consciousness greater than 5min or
required external intervention for their recovery.
Patients with orthostatic hypotension.
Patients taking medications that can lead to arrhythmias
or orthostasis.
Patients with contraindications to tilt table testing: - those
with LVOT obstruction , stenotic valvular disease and
significant stenotic cerebrovascular disease.
11. If during the initial evaluation any cause other than
vasovagal syncope was diagnosed or suggested, then they
were excluded from further study.
If targeted specific tests for suggested etiologies were
inconclusive in establishing the diagnosis of syncope then
they were also included in the study.
In them further tests were performed.
Specific clinical details sought included the presence of
prodromal symptoms, number of episodes, circumstances
surrounding each episode, any precipitating factors and
eyewitness observations of the actual episode
12. Lamper T et al have done videometric analysis of 56
syncopal episodes in patients prone to syncopal
attacks and found that the onset of syncope was rapid,
with subsequent recovery spontaneous and usually
complete.
Most of the subjects had no premonitory symptoms,
90 percent had myoclonic jerks and average syncope
duration was 12 seconds (range5-22 seconds).
Complete loss of consciousness in vasovagal syncope is
usually no longer than 20 seconds in duration.
13. Hoffnagels et al have found that if syncope duration is
longer than few minutes (>5 minutes) other causes of
loss of consciousness become important and history
plays important role in differentiating neurological
causes of loss of consciousness12
14. Likelehood Ratios
Positive likelihood ratio = Sensitivity/ (1-Specificity
Negative likelihood ratio = (1-Sensitivity) / Specificity
Positive predictive value (PPV) = (True positive) / (True +
False positives)
Likelihood ratios and positive predictive values of important
clinical correlates were calculated using UBC Bayesian
calculator.
All patients underwent a 70-degree, head-up tilt for a
maximum duration of 45 minutes
15. Patients were given a 15 minutes rest in supine position
before starting the test in order to familiarize with the
surroundings.
The patients were instructed to relax and breathe
quietly during the test.
A manually operated tilt table with a footboard was
used during the test.
16. SA-3000P is an apparatus that analyze the “Heart Rate Variability” which give
significant information on Autonomic Nervous System (ANS)’s regulating function and
balance status. The change (variation) of heart rate during short term (5 minutes) is
analyzed with the method of time domain and frequency domain to provide the degree
of balance and activity of autonomic nervous system.
17.
18.
19. HRV can be assessed in two ways, either as a Time
Domain Analysis or in the
frequency domain as a Power Spectral Density
(PSD) analysis. In either method, the
time intervals between each successive normal QRS
complex are first determined. All
abnormal beats not generated by sinus node
depolarizations are eliminated from the
HRV analysis.
20.
21. the main advantages of power spectral
density(PSD) analysis over the time domain measures
is that it supplies information on
how the power is distributed (the variance) as a
function of frequency, thereby
providing a means to quantify autonomic balance at
any given time.
22. TIME DOMAIN ANALYSIS: In the time domain analysis the coefficient of
variations of RR intervals was calculated using formula
CVRRRI = SDNN/ mean RR, where SDNN represents the standard deviation of all
NN intervals (i.e. normal-to-normal RR intervals) resulting from sinus node
depolarizations after exclusion of noise, artifacts and ectopics9.
FREQUENCY DOMAIN ANALYSIS: The RR interval series (300 seconds) was
resampled at 4 Hz after editing out noise, artifacts and ectopics and analyzed by fast
Fourier transformation. RR interval variations occurring in the frequency range 40400 mHz were chosen for analysis and a power spectrum was obtained by squaring
the magnitude of fast Fourier transform in this frequency range.
Low frequency spectral power (LF) and high frequency spectral power (HF) were
obtained by integrating the power spectrum from 40mHz –150 mHz and 150- 400
mHz respectively.
The LF/HF ratio was derived as the ratio of low frequency and high frequency
spectral powers expressed in dimensionless units.
The LF and HF spectral powers in normalized units (nu) were calculated thus: LF
nu = LF / (LF + HF) and HF nu = HF / (LF + HF) 10.
HRV data: - In order to find out the early predictors of a positive test, patients were
classified into two groups, i.e., those with a positive test (n=16) and those with
negative test (n=38). BP, HR and HRV indices at rest and during first 5 minutes of
head-up tilt in both the groups were compared.
23. i) The incidence of positive tilt table tests and positive
Holter recordings which correlated to clinical
development of syncope were tabulated .
ii) Different types of tilt table test responses (mixed,
cardioinhibitry or pure vasodepressor were studied)