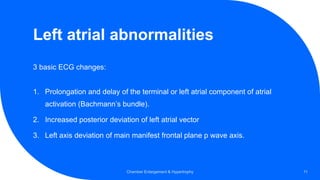
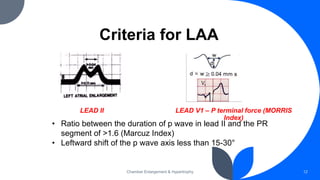
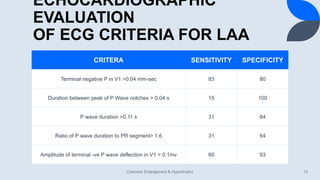
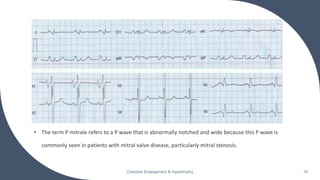
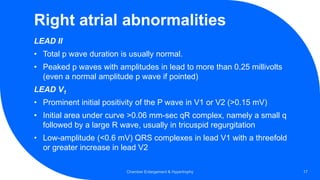
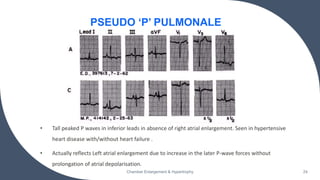
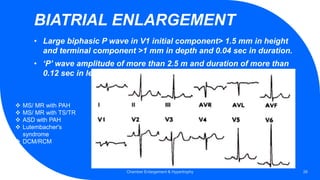
The document discusses the role of ECG in detecting cardiac chamber enlargement. Some key points:
- ECG can detect chamber enlargement through changes in waveform morphology, amplitude/voltage, axis, and duration. These changes apply to both P waves and QRS complexes.
- Common ECG criteria for left atrial enlargement include prolonged/notched P waves in lead II and terminal negative deflection in lead V1. For right atrial enlargement, criteria include tall peaked P waves in leads I, II, III and V1.
- Common ECG patterns of left ventricular hypertrophy include tall R waves in left chest leads, ST-T wave changes, and prolonged QRS duration
The document discusses electrocardiogram (ECG) patterns associated with cardiac chamber enlargement, specifically right atrial enlargement (RAE) and left atrial enlargement (LAE). RAE is suggested by a tall, peaked P wave in leads II, III, AVF and a positive P wave in V1. LAE results in prolongation of the left atrial component of the P wave, increased posterior deviation of the left atrial vector, and left axis deviation of the P wave. The diagnostic accuracy of ECG findings for chamber enlargement is limited but can provide clues when correlated with imaging studies.
Biatrial enlargement is diagnosed when criteria for both right and left atrial enlargement are present on the same ECG.
The diagnosis of biatrial enlargement requires criteria for LAE and RAE to be met in either lead II, lead V1 or a combination of leads.
Echo assessment of lv systolic function and swmaFuad Farooq
This document discusses various techniques for assessing left ventricular systolic function using echocardiography, including:
- Visual assessment of endocardial motion and wall thickening to evaluate global and regional function
- Quantitative measures like fractional shortening, ejection fraction, and volumes
- Tissue Doppler imaging of mitral annular velocities
- Tissue tracking and strain imaging to evaluate timing and extent of myocardial contraction
- Wall motion scoring to characterize regional abnormalities
Echocardiography is a key tool for diagnosing and evaluating mitral stenosis (MS). It is essential to use an integrative approach when grading MS severity by combining Doppler, 2D imaging, and measurements, rather than relying on one alone. Echocardiography plays a major role in MS by confirming diagnosis, quantifying severity, analyzing consequences, and examining valve anatomy. Mitral valve planimetry directly measures valve area and is considered the reference standard, but additional measurements like pressure gradient and half-time are also useful. Echocardiography aids clinical decision making for patients with MS.
This document outlines ECG criteria for detecting enlargement of the heart chambers, including the left ventricle, right ventricle, and atria. Several voltage-based criteria and point scoring systems are described for identifying left ventricular hypertrophy with sensitivities generally around 35-55% and specificities of 85-95%. Signs of right ventricular hypertrophy and chronic pulmonary disease on ECG are also summarized. Biventricular enlargement can be suggested based on meeting criteria for both left and right ventricular hypertrophy simultaneously. Atrial enlargement of the left or right atria is characterized by abnormalities in the P wave morphology and duration.
This document summarizes the echocardiographic assessment of mitral stenosis (MS). It describes the anatomy of the mitral valve and causes of MS. Methods for assessing MS severity include measuring the pressure gradient, mitral valve area using planimetry and pressure half-time, and pulmonary artery pressure. Suitability for percutaneous transvenous mitral commissurotomy is evaluated. Concomitant valve lesions are also identified. Stress echocardiography may be used when symptoms are equivocal. Transesophageal echocardiography is recommended in some cases.
Echocardiographic Evaluation of LV Diastolic FunctionJunhao Koh
The document discusses methods for evaluating left ventricular diastolic function using echocardiography. It describes the four phases of diastole, parameters used to assess diastolic function including mitral inflow patterns, mitral annular tissue Doppler, pulmonary vein flow, left atrial size and the Tei index. Grades of diastolic dysfunction and approaches from ASE/EAE and Mayo Clinic are summarized. Continuous wave Doppler of aortic regurgitation is also presented as a noninvasive method to evaluate left ventricular relaxation.
This document discusses strain and strain rate imaging techniques used to quantify regional myocardial function. It describes various methods to measure strain, including tissue Doppler, 2D speckle tracking, and cardiac MRI. It outlines normal values and patterns of strain in healthy individuals and how strain is altered in various cardiac diseases, such as coronary artery disease, heart failure, cardiomyopathies, and congenital heart disease. Strain imaging can identify myocardial scar, viability, dysfunction, and response to treatments.
This document discusses left ventricular hypertrophy (LVH) and right ventricular hypertrophy (RVH). It defines LVH as an increase in left ventricle mass due to increased wall thickness or cavity size. There are two types of LVH - systolic overload from conditions like hypertension which compromise the left ventricle during systole, and diastolic overload from things like valvular diseases which compromise it during diastole. The document outlines ECG criteria for diagnosing LVH including Sokolov-Lyon and Cornell voltage criteria. It also discusses RVH manifestations on ECG like right axis deviation, tall R waves in right precordial leads, and an S1S2S3 pattern.
This document discusses localization of accessory pathways using electrocardiography. It describes that accessory pathways can be located in eight anatomical positions along the tricuspid and mitral valve annuli. Several algorithms are proposed to determine the location based on delta wave polarity and amplitude in various leads. The most accurate is the Arruda approach, which uses step-wise analysis of delta wave characteristics in leads I, II, aVL, aVF and V1 to identify the specific accessory pathway location with 90% sensitivity and 99% specificity. Characteristic ECG patterns are presented that help localize right anteroseptal, right posteroseptal, left lateral and right free wall accessory pathways.
Hypertrophic cardiomyopathy (HCM) is defined by a thickened left ventricular wall without an identifiable cause. It can range from asymptomatic to causing heart failure, arrhythmias, or sudden cardiac death. Treatment depends on whether the left ventricular outflow tract (LVOT) is obstructed. For symptomatic patients with LVOT obstruction despite maximum medical therapy, septal reduction procedures like alcohol septal ablation or surgical myectomy are recommended. Alcohol septal ablation involves injecting alcohol into a septal perforator artery to ablate tissue and reduce the gradient. Surgical myectomy directly resects septal muscle. Both procedures significantly reduce gradients and improve symptoms but surgical myectomy provides better gradient and symptom reduction with a lower risk of
This document discusses the echocardiographic evaluation of cardiomyopathies. It defines cardiomyopathy and outlines the major classification systems. The main types discussed are dilated cardiomyopathy, hypertrophic cardiomyopathy, arrhythmogenic right ventricular cardiomyopathy, restrictive cardiomyopathy, and unclassified cardiomyopathy. Specific features of dilated cardiomyopathy are then reviewed in detail, including morphological features, causes, Doppler findings, and involvement of the right ventricle and left atrium. Evaluation of diastolic dysfunction and ischemic cardiomyopathy are also summarized.
Tissue Doppler Imaging (TDI) provides low velocity, high amplitude signals from the myocardium that can be used to assess systolic and diastolic function. TDI utilizes pulsed wave and color Doppler techniques to measure peak myocardial velocities. The E/E' ratio, where E is transmitral early diastolic velocity and E' is early diastolic mitral annular velocity, correlates well with left ventricular filling pressures and can help distinguish normal from elevated pressures. TDI parameters are useful for evaluating global and regional systolic function, diastolic function, ischemia, and viability as well as distinguishing between restrictive cardiomyopathy and constrictive pericarditis.
The document discusses the results of a study on the effects of a new drug on memory and cognitive function in older adults. The double-blind study involved giving either the new drug or a placebo to 100 volunteers aged 65-80 over a 6 month period. Testing showed those receiving the drug experienced statistically significant improvements in short-term memory retention and processing speed compared to the placebo group.
This document describes equipment, catheters, and basic intervals used in electrophysiology (EP) studies. It discusses radiographic tables, EP equipment like cardiac stimulators and mapping/ablation catheters. Patient preparation includes fasting, IV access, monitoring equipment. EP catheters come in different sizes and have electrodes for recording electrical activity. Basic intervals measured include P wave to atrial interval, atrial-His bundle interval, His-ventricular interval, and sinus node recovery time. Drive train stimulation with single, double, or triple extra stimuli is used. The document continues with further discussions of EP protocols, arrhythmias, ablation, and pre-excitation pathways.
Left ventricular diastolic dysfunction in echocardiographyYukta Wankhede
Left ventricular diastolic dysfunction refers to the heart's inability to properly relax and fill during diastole. It can be caused by primary myocardial diseases like cardiomyopathy, hypertension, or secondary issues like aortic stenosis. Diagnosis involves evaluating left ventricular mass, dimensions, and function using 2D echocardiography, Doppler ultrasound to assess mitral inflow and pulmonary vein patterns, and tissue Doppler imaging of mitral annular motion. Diastolic dysfunction is graded from mild to severe based on these evaluation findings.
ECHOCARDIOGRAPHIC EVALUATION OF MITRAL VALVE DISEASEPraveen Nagula
MITRAL VALVE ANATOMY , M MODE FINDINGS IN MITRAL STENOSIS,EVALUATION OF THE SEVERITY OF LESION,CALCIFIC MS,CCMA,CONGENITAL LESIONS,GUIDELINES ALL IN DETAIL....
This document provides an overview of echocardiographic assessment of mitral regurgitation. It describes the anatomy of the mitral valve including the leaflets, annulus, chordae, and papillary muscles. It discusses Carpentier's functional classification system for describing the mechanism of mitral valve dysfunction. Methods for assessing severity are covered, including color flow imaging, continuous wave Doppler, vena contracta width, proximal isovelocity surface area, and volumetric assessment. Key points are made about evaluating jet direction, duration, and velocity in context of blood pressure. The importance of assessing left ventricular and left atrial size and function is also highlighted.
The document discusses various electrocardiogram (ECG) criteria for differentiating between ventricular tachycardia (VT) and supraventricular tachycardia (SVT) with aberrancy presenting with a wide QRS complex tachycardia. It outlines criteria from Sandler and Marriott (1965), Wellens (1978), Kindwall (1988), Brugada (1991), Vereckei (2008) and Pava (2010). Key criteria that favor VT include QRS duration >140ms, extreme left axis, AV dissociation, monophasic R wave in V1, R/S ratio <1 in V6, and notching of the S wave in V1.
This document discusses ECG changes that occur due to cardiac chamber enlargement, including left atrial, right atrial, biatrial, left ventricular, right ventricular, and biventricular abnormalities. For each type of chamber enlargement, the document outlines the mechanisms, diagnostic ECG criteria, and examples of ECG patterns. Key findings include prolonged P waves and biphasic P waves in leads indicating left and right atrial enlargement, increased QRS voltages and ST-T wave changes indicating left ventricular pressure overload, and tall R waves in right-sided leads indicating right ventricular hypertrophy. The document provides a detailed reference for understanding ECG manifestations of different cardiac structural abnormalities.
This document discusses the case of a 2 year old male child presenting with recurrent lower respiratory tract infections. On examination, a systolic murmur was heard. Echocardiogram showed a patent ductus arteriosus (PDA) of size 8mm with left to right shunting. Cardiac catheterization found a Qp/Qs ratio of 1.83, confirming a left to right shunt. Post oxygen, the Qp/Qs ratio increased to 2.94, and PVR decreased, indicating reactivity. The document then discusses two other cases and provides information on indications for catheterization in PDA, angiographic views, classifications of PDA, and factors affecting shunting through a PDA
This document discusses the use of echocardiography in evaluating various types of cardiomyopathies. It provides echocardiographic features of dilated cardiomyopathy including dilated chambers, normal wall thickness, and complications like mitral regurgitation. Hypertrophic cardiomyopathy features include unexplained hypertrophy, diastolic dysfunction, and left ventricular outflow tract obstruction. Restrictive cardiomyopathies show hypertrophy, enlarged atria, restricted filling, and elevated pressures. Left ventricular non-compaction and arrhythmogenic right ventricular cardiomyopathy also have distinct echocardiographic characteristics described.
1) The document defines wide complex tachycardia as a rhythm with a QRS duration ≥120ms and heart rate >100 bpm.
2) The main causes listed are ventricular tachycardia (80% of cases) and supraventricular tachycardia with aberrancy.
3) Key features that can help differentiate the underlying rhythm include QRS duration, axis, morphology, and the presence or absence of AV dissociation on electrocardiogram.
Echo Differentiation of Restrictive Cardiomyopathy and Constrictive PericarditisJunhao Koh
1. The document compares and contrasts constrictive cardiomyopathy (CP) and restrictive cardiomyopathy (RCMP), discussing their definitions, etiologies, pathophysiology, and echocardiographic findings.
2. Key differences include CP presenting with thickened pericardium while RCMP presents with stiff myocardium. CP shows ventricular interdependence and respiratory variation on echo, while RCMP shows restrictive physiology from diastolic dysfunction.
3. Optimizing the echo exam is important for evaluating CP, including adjusting the respirometer waveform, Doppler sweep speed, and positions like upright to increase respiratory variation. Hepatic vein and SVC Doppler also help differentiate the conditions.
This document discusses techniques for localizing the site of origin of ventricular tachycardia based on electrocardiogram characteristics. It describes that right ventricular outflow tract tachycardias typically present with left bundle branch block morphology while left ventricular sites may present with either right or left bundle branch block depending on exit site. Specific leads are discussed that can provide clues about anterior vs posterior, septal vs free wall origin within the outflow tracts. Other areas like fascicles, papillary muscles and mitral/tricuspid annuli are also summarized.
The document discusses electrocardiogram (ECG) findings associated with cardiac chamber enlargement. It notes that while ECG is not very sensitive, it can provide clues about underlying heart conditions. Enlargement of cardiac chambers on ECG is seen through changes in wave morphology, amplitude, axis, and duration. Specific criteria are discussed to identify left and right atrial abnormalities as well as left and right ventricular hypertrophy on ECG. Limitations of ECG criteria in the presence of conduction abnormalities are also reviewed.
- The document describes normal ECG values and intervals. It then discusses abnormalities seen in right and left atrial and ventricular enlargement, right and left bundle branch blocks, and myocardial infarction. Specific ECG patterns are provided for each condition. For example, right atrial enlargement shows tall, narrow P waves in certain leads, while left bundle branch block results in a wide QS complex in lead V1 and tall R wave without Q wave in lead V6. The document serves as a guide for interpreting ECG findings in various cardiopulmonary conditions.
This document provides a summary of the basics of electrocardiography (ECG). It discusses the history and development of ECG technology. It describes the normal cardiac conduction system and the waves that make up a normal ECG, including the P, QRS, and T waves. It outlines the 12 standard ECG leads and how they are positioned on the body. It reviews criteria for interpreting common cardiac abnormalities based on ECG findings such as hypertrophy, infarction, and arrhythmias.
The ecg in chmaber enlargement approachDheeraj kumar
This document discusses electrocardiogram (ECG) criteria for detecting cardiac chamber enlargement. It provides details on how enlargement of the atria or ventricles can manifest on an ECG through changes in wave morphology, amplitude, axis, and duration. Specific ECG patterns are described that can provide clues about left or right atrial and ventricular abnormalities. The sensitivity and specificity of different ECG criteria are discussed. Underlying cardiac conditions that can cause chamber enlargement and affect ECG interpretation are also reviewed.
This document provides a comprehensive overview of EKG interpretation. It defines the various EKG waves, intervals, segments and complexes. It describes normal values as well as abnormalities related to conditions like myocardial infarction, hypertrophy, conduction blocks, electrolyte imbalances, hypothermia and more. Causes of variations in waves, intervals and complexes are discussed in detail. Commonly seen arrhythmias and their mechanisms are also explained.
The ECG shows a pattern of right ventricular hypertrophy with a large R wave in lead V1 and deep S wave in lead V6, suggesting enlarged right ventricle. This, along with the juvenile T wave pattern of inverted T waves in the precordial leads from birth to age 8, are consistent with the normal developmental changes described in the document as the left ventricle increases in dominance from birth through childhood. The document provides an overview of normal pediatric ECG patterns and intervals across age groups as well as common arrhythmias and abnormalities.
This document provides an overview of electrocardiography (ECG) including:
- What an ECG measures and the cardiac cycle waveform
- How ECGs can identify various cardiac conditions like arrhythmias, ischemia, and chamber abnormalities
- The basics of cardiac impulse conduction and the components of a normal ECG waveform including the P wave, QRS complex, T wave, and segments
- How to determine heart rate using the 300/1500 rule or 10 second rule
- Factors that can affect the QRS axis and how it is determined using the quadrant or equiphasic approaches
- Types of bradyarrhythmias like sinus bradycardia, junctional rhythm
This document provides a tutorial on electrocardiography (ECG). It discusses the basics of ECG including standard calibration and electrical impulse generation. It describes the anatomical locations associated with different ECG leads. Key components of the ECG like the P wave, QRS complex, ST segment, T wave, and QT interval are explained. Common ECG findings related to conditions like myocardial infarction, hypertrophy, axis deviation, and arrhythmias are presented. Calculation of heart rate and cardiac axis are demonstrated. Recommended resources for further ECG learning are provided at the end.
The 11-step method provides a systematic approach to reading EKGs:
1. Gather data such as heart rate, intervals, and axis.
2. Diagnose rhythm, conduction blocks, enlargement, and infarction by applying specific criteria.
3. Potential diagnoses are identified through disturbances of rhythm, conduction, hypertrophy, and ischemia. The relationship between P waves and QRS complexes helps determine block types.
The 11-step method provides a systematic approach to reading EKGs:
1. Gather data such as heart rate, intervals, and axis.
2. Diagnose rhythm, conduction blocks, enlargement, and infarction by applying specific criteria.
3. Potential diagnoses are identified through disturbances of rhythm, conduction, hypertrophy, and ischemia. The four questions framework is used to characterize rhythms.
This document summarizes ECG manifestations in hypertrophic cardiomyopathy (HCM). Key findings include ventricular hypertrophy affecting different regions of the heart, intraventricular conduction defects, and left and/or right atrial abnormalities. Specific ECG patterns indicate septal, left ventricular, and right ventricular hypertrophy. ECG changes in HCM commonly include left ventricular hypertrophy, left atrial abnormality, pathological Q waves, and prolonged QT interval. The ECG is useful for screening populations for HCM when echocardiography is not available.
The document discusses atrial and ventricular enlargement and how it appears on ECGs. It describes dilation and hypertrophy as two types of cardiac enlargement. It then examines right and left atrial abnormalities and how they change the P wave. Next it analyzes right and left ventricular hypertrophy, identifying criteria for each like tall R waves in certain leads. It notes causes can include things like pulmonary disease or valve problems. Examples of ECGs demonstrating various types of enlargement are presented and criteria are reviewed.
The document provides an overview of electrocardiography (ECG) basics including lead positions, ECG paper and timing, standardization, the normal ECG waves including P, PR, QRS, ST segments, T waves, and QT interval, and abnormalities. Key findings of right and left ventricular hypertrophy, atrial enlargement, bundle branch blocks, myocardial infarction, and various degrees of atrioventricular block are also summarized.
The document provides an overview of electrocardiogram (ECG) interpretation. It discusses the key steps including assessing quality, rate, rhythm, axis, P wave, PR interval, QRS duration and morphology, ST segment, T wave, QT interval, and identifying common abnormalities. Examples of important ECG patterns are also shown, such as lateral myocardial infarction, left bundle branch block, ventricular tachycardia, and Wolff-Parkinson-White syndrome. The overall document aims to develop a structured approach for interpreting ECGs in clinical practice.
1. The pediatric ECG document reviews cardiac physiology and ECG findings in children of different ages. It discusses how the size of the ventricles changes from birth through childhood and how this impacts ECG measurements.
2. Key aspects of the normal pediatric ECG are described, including typical heart rates, axis shifts, and "juvenile" T wave patterns. Common abnormalities seen in pediatric patients such as chamber enlargement, conduction abnormalities, and arrhythmias are also reviewed.
3. The document provides guidance on interpreting ECG findings and correlating them to possible diagnoses in children, taking into account how measurements may differ based on age. Examples of ECG strips are included to illustrate various normal and abnormal
This document provides a history of the electrocardiogram (EKG/ECG) and describes how it is used to evaluate cardiac electrical activity and identify various cardiac conditions. Some key points:
- The EKG was developed in the late 19th/early 20th century, with scientists like Matteucci, Marey, and Einthoven contributing to its invention and clinical use.
- An EKG records the heart's electrical activity through electrodes on the skin and can be used to detect arrhythmias, ischemia, infarction, and other conditions.
- It analyzes the P wave, QRS complex, ST segment, and T wave to evaluate conduction and identify abnormalities.
This document provides an overview of electrocardiography (ECG) basics. It defines ECG as a graphical representation of the heart's electrical activity used to assess cardiovascular diseases. It discusses the conduction system of the heart and the 12 standard chest leads used in ECG. It outlines the key steps in ECG interpretation including analyzing rate, rhythm, intervals, chambers, and waveform durations. It describes how to calculate heart rate from the ECG and defines the normal P wave, PR interval, QRS complex, ST segment, QT interval, and ECG axis.
This document provides an overview of electrocardiography (ECG/EKG) including its history, components, and how to interpret common rhythms. Some key points:
- ECG records electrical activity of the heart and was invented in the late 19th century. It helps diagnose arrhythmias, ischemia, infarction and other cardiac conditions.
- The ECG tracing has components (P wave, PR interval, QRS complex, ST segment, T wave) that reflect different stages of the cardiac cycle.
- Common arrhythmias arise from problems in the sinus node, atria, AV node or ventricles. These include sinus bradycardia, sinus tachycardia, premature
Visualized Treatment Objective was coined by Holdaway.
A VTO is a cephalometric tracing representing the changes that are expected during treatment (Proffit).
Ricketts defines VTO as a visual plan to forecast the normal growth of the patient and anticipated influences of treatment, to establish individual objectives that are to be achieved for that patient.
This document provides an overview of various methods that have been used for predicting facial growth and development in orthodontics. It discusses early concepts like Hunterian growth theory and Bjork's implant studies showing rotational growth. Methods like Moss' logarithmic spiral concept and Ricketts' arcial growth pattern are explained. Growth prediction grids like Moorrees mesh and Johnston's grid are summarized. The document also mentions Todd's equation for predicting non-linear radial growth and Holdaway's concept of a visualized treatment objective to forecast normal growth and treatment effects.
Maxillomandibular elastics (or intermaxillary elastics) are commonly used because of their simplicity; however, a lack of understanding of their force system can lead to many serious problems.
Elastics are usually classified by the direction of the force (eg, Class II or Class III elastics).
Sometimes force magnitude is considered, but point of force application is left out. Therefore, many different types of Class II elastics can be applied. There are short or long elastics.
Often too many elastics are used when a single resultant elastic at the correct location would work better. However, sometimes more than a single elastic is needed when the attachment point is not directly accessible.
All maxillomandibular elastics and their actions should be analyzed in three dimensions.
Elastics and Elastomeric are routinely used as a active component of orthodontic therapy.
Elastics have been a valuable adjunct of any orthodontic treatment for many years.
There use combined with good patient cooperation provides the clinician with the ability to correct both
Antero-posterior and vertical discrepancies. The latex elastics have become integral part of orthodontics after being first discussed by Calvin. S. case in 1893 at the Columbia dental congress but the credit goes to Henry A. Baker for the use of these elastics in clinical practice to exert a class II intermaxillary forces.
Both natural rubber and synthetic elastomers are widely used in orthodontic therapy. Naturally produced latex elastics are used in the Begg technique to provide intermaxillary traction and intramaxillary forces. Synthetic elastomeric materials in the form of chains find their greatest application with edgewise mechanics where they are used to move the teeth along the arc
Once novel, Invisalign is now a digital orthodontic appliance used to treat millions of patients. This customized appliance is created by the aid of sophisticated 3D imaging and animation tools that enable virtual simulation of tooth movements. Tooth movements resemble a filmstrip, and each frame is called a stage. Each stage corresponds to a set of clear plastic aligner trays. As the trays are worn by the patient, every tray pushes the teeth 0.25-0.33mm at a time (Tuncay 2006). Each tray or aligner is composed of clear, removable polyurethane, which provides esthetic and more comfortable appliance wear experience than the traditional fixed appliances. This unique and esthetic alternative to tooth movement continues to recruit more patients to orthodontic therapy.
The very need for orthodontic treatment by a majority of adult patients is derived with a desire for enhancement of dental alignment and facial aesthetics. Although buccal fixed metallic appliances are efficient treatment systems, the reluctance of their use is mainly due to metal look, poor aesthetics and fear of pain. Clear plastic aligners’ offer an excellent alternative to unaesthetic orthodontic treatment with labial fixed appliances
The clear aligner appliance(s) is nearly transparent, colourless and almost invisible. As these devices are removable, they allow the patient an additional option to be without braces for social and professional engagements. The oral hygiene is not a problem with this appliance and most patients adapt to it very quickly. The success of these types appliances is intimately related to the compliance in wearing the appliance for a minimum number of hours and following the required schedule of changing the aligners as per sequence assigned to the case. Patients are asked to wear the aligners for a minimum of 22 h/day. Thus, patient compliance is paramount in clear aligner therapy.
Some of the patients seeking clear aligner treatment are those who have previously received orthodontic treatment using fixed appliances and have had a relapse or are unsatisfied with treatment outcome.
After a complete orthodontic diagnosis is made, the next important step is treatment planning. The main objective of treatment planning is to design a strategy to correct the problems. Good strategy helps to design the best appliance indicated for the patient.
Treatment planning is an outline of all the measures that can best instituted for a patient so as to offer maximum long term benefits.
Patients seeks Orthodontic treatment planning for a variety of reasons, most commonly- Esthetics and Function.
There is no simple or fixed formula or a cook book recipe to treat a Orthodontic problem.
Every case is assessed, analysed and and a customised treatment plan is formulated to best suit the individual patient.
The dynamics of the growth of the craniofacial skeleton is a fascinating,complex mechanism.
An understanding of growth events is of primary importance in the practice of clinical orthodontics.
Maturational status can have considerable influence on diagnosis, treatment goals, treatment planning, and the eventual outcome orthodontic treatment.
Various methods have been implemented to measure growth which include measurement on living individual and dry skull and indirect measurement taken by means of virtual reproduction of the craniofacial skeleton.
Essentially,the various study used to assess growth try to find out answers of the following-
pattern of growth
site of growth
amount and rate of growth
direction and factors influencing growth.
Craniofacial growth is a complex and a beautiful phenomenon.
It all begins when a sperm cell fuses with an egg cell, a process called fertilization.
Human fertilization is the union of a human egg and sperm, usually occurring in the ampulla of the fallopian tube. The result of this union is the production of a ’Zygote’ cell, or fertilized egg, initiating prenatal development
Prenatal growth can be divided into 3 main stages:
Germinal stage: From ovulation to implantation(0-2 weeks).
Embryonic stage : 3rd week to 8th week.
Fetal stage: 9th week till birth.
ORTHOPEDIC APPLIANCES:
The appliance that produces skeletal changes by applying orthopaedic forces are known as “Orthopaedic appliance”.
‘Orthopaedic therapy' is aimed at the correction of skeletal imbalance with the correction of any dentoalveolar malocclusion being of less importance, in which little or no tooth movement is desired. Therefore, orthopedic forces are heavier (= 400 gm) when compared to orthodontic forces (50-100 gm).
How to Manage Your Lost Opportunities in Odoo 17 CRMCeline George
Odoo 17 CRM allows us to track why we lose sales opportunities with "Lost Reasons." This helps analyze our sales process and identify areas for improvement. Here's how to configure lost reasons in Odoo 17 CRM
Main Java[All of the Base Concepts}.docxadhitya5119
This is part 1 of my Java Learning Journey. This Contains Custom methods, classes, constructors, packages, multithreading , try- catch block, finally block and more.
A workshop hosted by the South African Journal of Science aimed at postgraduate students and early career researchers with little or no experience in writing and publishing journal articles.
How to Fix the Import Error in the Odoo 17Celine George
An import error occurs when a program fails to import a module or library, disrupting its execution. In languages like Python, this issue arises when the specified module cannot be found or accessed, hindering the program's functionality. Resolving import errors is crucial for maintaining smooth software operation and uninterrupted development processes.
বাংলাদেশের অর্থনৈতিক সমীক্ষা ২০২৪ [Bangladesh Economic Review 2024 Bangla.pdf] কম্পিউটার , ট্যাব ও স্মার্ট ফোন ভার্সন সহ সম্পূর্ণ বাংলা ই-বুক বা pdf বই " সুচিপত্র ...বুকমার্ক মেনু 🔖 ও হাইপার লিংক মেনু 📝👆 যুক্ত ..
আমাদের সবার জন্য খুব খুব গুরুত্বপূর্ণ একটি বই ..বিসিএস, ব্যাংক, ইউনিভার্সিটি ভর্তি ও যে কোন প্রতিযোগিতা মূলক পরীক্ষার জন্য এর খুব ইম্পরট্যান্ট একটি বিষয় ...তাছাড়া বাংলাদেশের সাম্প্রতিক যে কোন ডাটা বা তথ্য এই বইতে পাবেন ...
তাই একজন নাগরিক হিসাবে এই তথ্য গুলো আপনার জানা প্রয়োজন ...।
বিসিএস ও ব্যাংক এর লিখিত পরীক্ষা ...+এছাড়া মাধ্যমিক ও উচ্চমাধ্যমিকের স্টুডেন্টদের জন্য অনেক কাজে আসবে ...
Exploiting Artificial Intelligence for Empowering Researchers and Faculty, In...Dr. Vinod Kumar Kanvaria
Exploiting Artificial Intelligence for Empowering Researchers and Faculty,
International FDP on Fundamentals of Research in Social Sciences
at Integral University, Lucknow, 06.06.2024
By Dr. Vinod Kumar Kanvaria
This slide is special for master students (MIBS & MIFB) in UUM. Also useful for readers who are interested in the topic of contemporary Islamic banking.
How to Make a Field Mandatory in Odoo 17Celine George
In Odoo, making a field required can be done through both Python code and XML views. When you set the required attribute to True in Python code, it makes the field required across all views where it's used. Conversely, when you set the required attribute in XML views, it makes the field required only in the context of that particular view.
How to Add Chatter in the odoo 17 ERP ModuleCeline George
In Odoo, the chatter is like a chat tool that helps you work together on records. You can leave notes and track things, making it easier to talk with your team and partners. Inside chatter, all communication history, activity, and changes will be displayed.
2. Role of ECG
• ECG is a simple, readily available and inexpensive tool for the
detection of cardiac chamber enlargement
• Can provide useful clues or arouse suspicion of underlying cardiac
condition
• Most ECCG criteria have low sensitivity but high specificity
• Clinical correlates and prognostic significance
• Screening and population based studies
Chamber Enlargement & Hypertrophy 2
3. General Principles
• Enlargement of the cardiac Chambers may manifest on the ECG as
an alteration of
• Waveform morphology
• Amplitude / Voltage
• Axis
• Duration (widening)
• These applied to both the p waves and the QRS complex
• Atrial abnormalities may suggest corresponding ventricular
hypertrophy
Chamber Enlargement & Hypertrophy 3
4. Limitations
• Enlargement? hypertrophy? dilatation?
• Voltage criteria can carry significantly based on
• Age
• Gender
• Race
• Habitus (chest wall thickness/abnormalities )
• Pulmonary/pericardial pathology
Chamber Enlargement & Hypertrophy 4
5. Before commenting
• Assess technical quality of ECG
• Placement of the electrolytes (especially precordial)
• Voltage standardisation (1 mm=0.1 millivolt)
• SPEED of recording (can affect measurement of duration)
• Preferable to express voltage in millivolts (mV) rather than millimeter (mm)
Chamber Enlargement & Hypertrophy 5
6. Atrial abnormalities
Atrial dilatation, hypertrophic, elevated atrial pressures, impaired ventricular
distensibility, and delayed intra-atrial conduction produced similar changes
on ECG and cannot be differentiated
As such, the terms of left atrial abnormality in right atrial abnormality or
preferably to left / right atrial enlargement, the mitrale / congenitale /
pulmonale
Chamber Enlargement & Hypertrophy 6
8. Chamber Enlargement & Hypertrophy 8
P wave reflects atrial
depolarisation
Right atrial activation begins first.
Proceeds from the SAN into
(sinoatrial node) in the inferior
and the anterior direction and is
reflected by ascending limb of the
p wave in the frontal plane leads.
9. Chamber Enlargement & Hypertrophy 9
Left atrial activation begins 0.03
seconds after the right atrial
activation.
Proceeds from high in the
interatrial septum (IAS) in a left,
inferior and posterior direction.
Constitute distal half of the
descending limb of the p wave.
10. Normal ‘P’ wave
LEAD II
Duration in lead II is 0.08 - 0.1 second,
Max 0. 11 second.
Amplitude in lead: Usually 2 mm, max
2.5 mm.
Chamber Enlargement & Hypertrophy 10
LEAD V1
Usually biphasic.
Initial positive movement deflection < 1.5
mm
Terminal negative deflection not exceeding 1
mm in-depth and < 0.03 seconds in duration.
Duration of p wave in V1 is 0.05-0.08
second.
11. Left atrial abnormalities
3 basic ECG changes:
1. Prolongation and delay of the terminal or left atrial component of atrial
activation (Bachmann’s bundle).
2. Increased posterior deviation of left atrial vector
3. Left axis deviation of main manifest frontal plane p wave axis.
Chamber Enlargement & Hypertrophy 11
12. Criteria for LAA
LEAD II
Chamber Enlargement & Hypertrophy 12
LEAD V1 – P terminal force (MORRIS
Index)
• Ratio between the duration of p wave in lead II and the PR
segment of >1.6 (Marcuz Index)
• Leftward shift of the p wave axis less than 15-30°
13. ECHOCARDIOGRAPHIC
EVALUATION
OF ECG CRITERIA FOR LAA
CRITERA SENSITIVITY SPECIFICITY
Terminal negative P in V1 >0.04 mm-sec 83 80
Duration between peak of P Wave notches > 0.04 s 15 100
P wave duration >0.11 s 31 64
Ratio of P wave duration to PR segment> 1.6 31 64
Amplitude of terminal -ve P wave deflection in V1 > 0.1mv 60 93
Chamber Enlargement & Hypertrophy 13
14. CAUSES OF LA ABNORMALITY
• Valvular heart disease, mainly mitral and aortic
• Hypertensive heart disease
• Cardiomyopathy (dilated/ restrictive/hypertrophic)
• CAD
Chamber Enlargement & Hypertrophy 14
15. • The term P mitrale refers to a P wave that is abnormally notched and wide because this P wave is
commonly seen in patients with mitral valve disease, particularly mitral stenosis.
Chamber Enlargement & Hypertrophy 15
16. • The mere presence of a twin-peaked P wave is not diagnostic of LA abnormality
Chamber Enlargement & Hypertrophy 16
17. Right atrial abnormalities
LEAD II
• Total p wave duration is usually normal.
• Peaked p waves with amplitudes in lead to more than 0.25 millivolts
(even a normal amplitude p wave if pointed)
LEAD V1
• Prominent initial positivity of the P wave in V1 or V2 (>0.15 mV)
• Initial area under curve >0.06 mm-sec qR complex, namely a small q
followed by a large R wave, usually in tricuspid regurgitation
• Low-amplitude (<0.6 mV) QRS complexes in lead V1 with a threefold
or greater increase in lead V2
Chamber Enlargement & Hypertrophy 17
18. Change in ‘P’ axis
• In acquired heart disease (e.g. COPD), rightward shift of the
mean P wave axis to above +75 degrees – ‘P pulmonale’
• In congenital heart disease, the axis is normal or to left (-40
to +70 degrees) – ‘P congenitale’
Chamber Enlargement & Hypertrophy 18
19. Kaplan Criteria
• QRS axis> 90°
• P amplitude in V2> 0.15mv
• R/S> 1 in V1 in the absence of RBBB
• Combined sensitivity of 49% with specificity of 100%
Chamber Enlargement & Hypertrophy 19
20. CAUSES OF RA ABNORMALITY
• Congenital heart disease (Ebstein's anomaly, severe PS)
• Tricuspid valve disease
• Chronic cor pulmonale (COPD)
RAA is very uncommon in isolated ASD without PH.
Chamber Enlargement & Hypertrophy 20
21. • Tall, peaked ("gothic") P wave in leads IIL, IIL, and aVF ,P axis> 70 degrees
• No good overall correlation between P pulmonale and right atrial enlargement
• Severity of COPD is more related to rightward P wave axis than to P wave amplitude
Chamber Enlargement & Hypertrophy 21
22. P wave in the frontal leads is notched and the first component is increased in
amplitude and taller than the second component- reflects biatrial enlargement.
Chamber Enlargement & Hypertrophy 22
‘P’ TRICUSPIDALE
23. • Giant P waves-classically described in ebstein’s anomaly, also reported in Tricuspid atresia,
combined tricuspid and pulmonic stenosis. Best seen in leads II, III, aVF and V1
Chamber Enlargement & Hypertrophy 23
HIMALAYAN ‘P’ WAVES
24. • Tall peaked P waves in inferior leads in absence of right atrial enlargement. Seen in hypertensive
heart disease with/without heart failure .
• Actually reflects Left atrial enlargement due to increase in the later P-wave forces without
prolongation of atrial depolarisation.
Chamber Enlargement & Hypertrophy 24
PSEUDO ‘P’ PULMONALE
25. • (C) P mitrale - increase in the left atrial component in
amplitude and duration. Associated intraatrial
Conduction defect - prolongation of P wave duration
Chamber Enlargement & Hypertrophy 25
PSEUDO ‘P’ PULMONALE
• (D) Pseudo P pulmonale pattern in left atrial
enlargement. The amplitude of the left atrial
component is increased without increase in duration of
left atrial depolarization.
26. BIATRIAL ENLARGEMENT
• Large biphasic P wave in V1 initial component> 1.5 mm in height
and terminal component >1 mm in depth and 0.04 sec in duration.
• ‘P’ wave amplitude of more than 2.5 m and duration of more than
0.12 sec in lead II.
Chamber Enlargement & Hypertrophy 26
MS/ MR with PAH
MS/ MR with TS/TR
ASD with PAH
Lutembacher's
syndrome
DCM/RCM
27. Atrial Fibrillation, itself indicates possible dilatation of the
atria in most disease.
Course ‘f’ waves in lead V1 (>1 mm) were associated with
radiological and anatomical evidence of atrial enlargement.
Chamber Enlargement & Hypertrophy 27
28. Ventricular Hypertrophy
• Age: QRS voltages decline with age. The commonly used voltage criteria
apply to adults > 35 years
• Gender: women have slightly lower voltages Race: Blacks have higher
voltages, hispanics and caucasians lower compared to whites
• Body Habitus
Chamber Enlargement & Hypertrophy 28
29. Mechanisms of ECG changes
• Prolongation of action potential duration
• Increased transmural activation time
• Change in cardiac position with LV dilatation
• Brody effect
• Secondary ST-T chamges possibly due to subendocardial ischemia ( the
term 'strain' is to be avoided)
Chamber Enlargement & Hypertrophy 29
30. Chamber Enlargement & Hypertrophy 30
Ventricular Activation Time
• Indicator of transverse conduction
time across LV wall
• Prolonged in LVH (normal <4Oms
in Left leads, <20ms in right leads)
31. CLASSIFICATION OF LV
ENLARGEMENT
LV VOLUME
LV MASS
COMMENT
S
NORMAL
ABNORMA
L
NORMAL NORMAL
CONCENTRIC
LVH
Abnormal
Volume >
90ml/m2
ABNORMAL
ISOLATED LV
VOLUME
OVERLOAD
ECCENTRIC
COMMENTS
Abnormal LV mass > 131g/ m2 in males,
108 g/m2 in females.
Chamber Enlargement & Hypertrophy 31
32. • T wave inverted in left oriented leads V5, V6, I, AVL and upright in V1, V2, AVR.
• Inverted T wave - blunt apex, asymmetrical limb, the proximal limb is shallower than distal limb.
• Associated ST segment is minimally depressed with slight upward convexity
Chamber Enlargement & Hypertrophy 32
LVH WITH PRESSURE OVERLOAD
33. • Deep and narrow Q waves in left oriented leads V5, V6.
• The tall T waves in left precordial leads V5, V6 are symmetrical sharply pointed.
• ST segment in V5, V6 minimally elevated and concavity upwards.
Chamber Enlargement & Hypertrophy 33
LVH WITH DIASTOLIC OVERLOAD
34. DIASTOLIC OVERLOAD IN AR &
MR
• Diastolic overload of MR can be distinguished by ECG from AR.
• In MR, Giant LA will displace the heart forward, QRS vector is
less aligned with V1 and more aligned with V6. Hence S wave in
lead V1 will be attenuated.
• In AR, the S wave in V1 is deep.
Chamber Enlargement & Hypertrophy 34
35. Sokolow Lyon Criteria (1949)
S in V1 + R in V5/V6 > 3.5 mv
OR
R in V5 or V6 > 2.60 mv.
Chamber Enlargement & Hypertrophy 35
36. Cornell voltage criteria (1987)
R in aVL +S in V3 > 2.80 mv for Males
Chamber Enlargement & Hypertrophy 36
Cornell voltage-duration product
• QRS duration x Cornell voltage >244 mVms
• QRS duration x sum of voltages in all leads >1742 mm-
sec
• R in aVL >11 mm.
• RI+SIII > 25 mm.
• Total 12 lead voltage >175 mm
37. LVH IN THE PRESENCE OF
CONDUCTION DISORDERS:
RBBB (reduces the S wave in the precordial leads)
Chamber Enlargement & Hypertrophy 37
38. LVH IN THE PRESENCE OF
CONDUCTION DISORDERS:
LAFB (QRS vector shifts posteriorly)
Chamber Enlargement & Hypertrophy 38
39. LVH IN THE PRESENCE OF
CONDUCTION DISORDERS:
LBBB
Chamber Enlargement & Hypertrophy 39
• LVH and LBBB share a number of common features like
prolonged QRS duration and voltage.
• Criteria for LVH are most unreliable in the presence of
LBBB.
• LBBB itself is indicative of LVH in most cases.
• Klein et al, Using echocardiograms found that in the
presence of LBBB S V2 + R V6 > 45 mm.
• E/o LAE with QRS duration > 0.16.
40. Significance
Chamber Enlargement & Hypertrophy 40
• LVH on ECG correlated with increased CV mortality
• LIFE study showed improvement in survival with LVH regression
(Cornell criterion), also HOPE trial (Sokolow Lyon criteria)
• Secondary ST-T changes and associated LAE indicate worse
prognosis
• Prominent ST T changes in apical hypertrophy (Yamaguchi
syndrome)
• Cornell product is one of the best predictors of overall outcome
41. Right Ventricular Hypertrophy
• The right ventricle is considerably smaller than the left ventricle.
• For RV forces to be manifested on the ECG, they must be severe
enough to overcome the concealing effects of the larger LV forces.
• In mild RVH, the ECG may be normal or there may only be a shift of
QRS axis.
Chamber Enlargement & Hypertrophy 41
42. ECG Criteria for RVH
• The ECG is notoriously inadequate in detecting RVH
• Its sensitivity is in the range of 2%-18% but it is very
specific (90%)
• Vectorial classification of RVH (Chou and Helm, 1967)
• Type A: R in V1, S in V6 (CCW loop) - PS
• Type B: R/S>1 in Vi with R> 0.5m V (CW loop) - RHD MS
• Type C :S in V5-6. with R/S<1 in V5, CW loop - COPD
Chamber Enlargement & Hypertrophy 42
43. • Leads aVR, V1, and V2- abnormally tall R waves.
• I, aVL, V5, V6- Deep S waves leading to RS or rS complex
• Right axis deviation
Chamber Enlargement & Hypertrophy 43
RVH WITH PRESSURE OVERLOAD
44. Sokolow Lyon Criteria (1949)
• R in V1 + S in V5/V6 > 1.10 mV
• R in V1 > 0.7 mV
• S wave in V5 or V6 > 0.7 mV
• qR in V1
• R/S ratio in V1 > 1 with R >0.5 mV
• R/S ratio of < 1 in V5 or V6
Chamber Enlargement & Hypertrophy 44
46. • In lead V1 -tall monophasic R wave or a diphasic RS, Rs, or qR Compleex.
• Inversion in right precordial leads ('strain)
• S pattern in V6
• In pure valvular PS, age 2-20, height of R wave in mm multiplied by 5gives RV systolic pressure
Chamber Enlargement & Hypertrophy 46
47. • Pattern of incomplete or complete RBBB
• RVH is present if R in the precordial leads is greater than 10 mm in height in
• incomplete RBBB, and 15 mm in complete RBBB- Barker & Valencia criteria
Chamber Enlargement & Hypertrophy 47
RVH WITH RBBB
48. V1
• Normal young adult
• True posterior infarction
• Dextrocardia
• LPFB
• Displacement of the heart due to pulmonary disease
• Wolff Parkinson White pattern
• Muscular dystrophy
Chamber Enlargement & Hypertrophy 48
49. BIVENTRICULAR HYPERTROPHY
Hypertrophy of both ventricles produces complex
electrocardiographic patterns. Not the simple sum of the two
sets of abnormalities. The effects of enlargement of one
chamber may cancel the effects of enlargement of the other.
Chamber Enlargement & Hypertrophy 49
• LVH +Prominent R waves in right precordial leads.
• Voltage criteria for LVH + RAD
• LAE as sole criterion for LVH + RVH.
• ECG evidence of LVH with clockwise rotation of
heart.
• Large equiphasic QRS complex in mid precordial
leads.
50. • CHAMBER ENLARGEMENT IN
PEDIATRIC AGE GROUP
• Related to changes in LV:RV mass.
• Birth: RV is thicker than LV.
• Large increase in LV weight during
first month.
• LV:RV reaches 2:1 by 6 months of
age.
• LV:RV WEIGHT RATIO
o At birth - 0.8:1
o 1 month - 1.5:1
o 6 months - 2.0:1
o Adult - 2.5:1
Chamber Enlargement & Hypertrophy 50
51. ATRIAL ABNORMALITY
• RAA - Peaked P wave in leads II and V1
• 3 mm in infants < 6 months
• 2.5 mm in infants > 6 months.
• LAA - Prolongation of P wave duration
• 12 mths->0.10 sec.
• <12 mths ->0.08 sec.
• Terminal or deeply inverted p waves in V1 or V3R
Chamber Enlargement & Hypertrophy 51
52. RVH
R wave greater than the 98th percentile in lead V1.
S wave greater than the 98th percentile in lead I or V6.
RSR' - pattern in lead V1,
R' height > 15 mm in infants less than 1 year or
R' height > 10 mm in Children's more than 1 year.
Upright T waves in V1 (> 7 days, up to 10 years)
qR pattern in V1
Overall sensitivity 69%, specificity 82%.
Chamber Enlargement & Hypertrophy 52
53. LVH
• R-wave amplitude greater than
98th percentile in lead V5 or V6.
• R wave less than 5th Percentile
in lead V1 or V2.
• S-wave amplitude greater than
98th percentile in lead V1.
• Q wave greater than 4 mm in
lead V5 or V6 Inverted T wave in
lead V6 Chamber Enlargement & Hypertrophy 53
54. Suggested Reading
An Introduction to
Electrocardiography -Leo
Schamroth 7th ed
AHA/ ACCF/ HRS
recommendations for the
standardisation and
interpretation of the
Electrocardiogram Part V.
JACC 2009; 53: 992-1002
Marriott's Practical
Electrocardiography 11thed
Cardiology Clinics August
2006
Advanced 12-lead
Electrocardiography;
Chamber Enlargement & Hypertrophy 54