Download to read offline
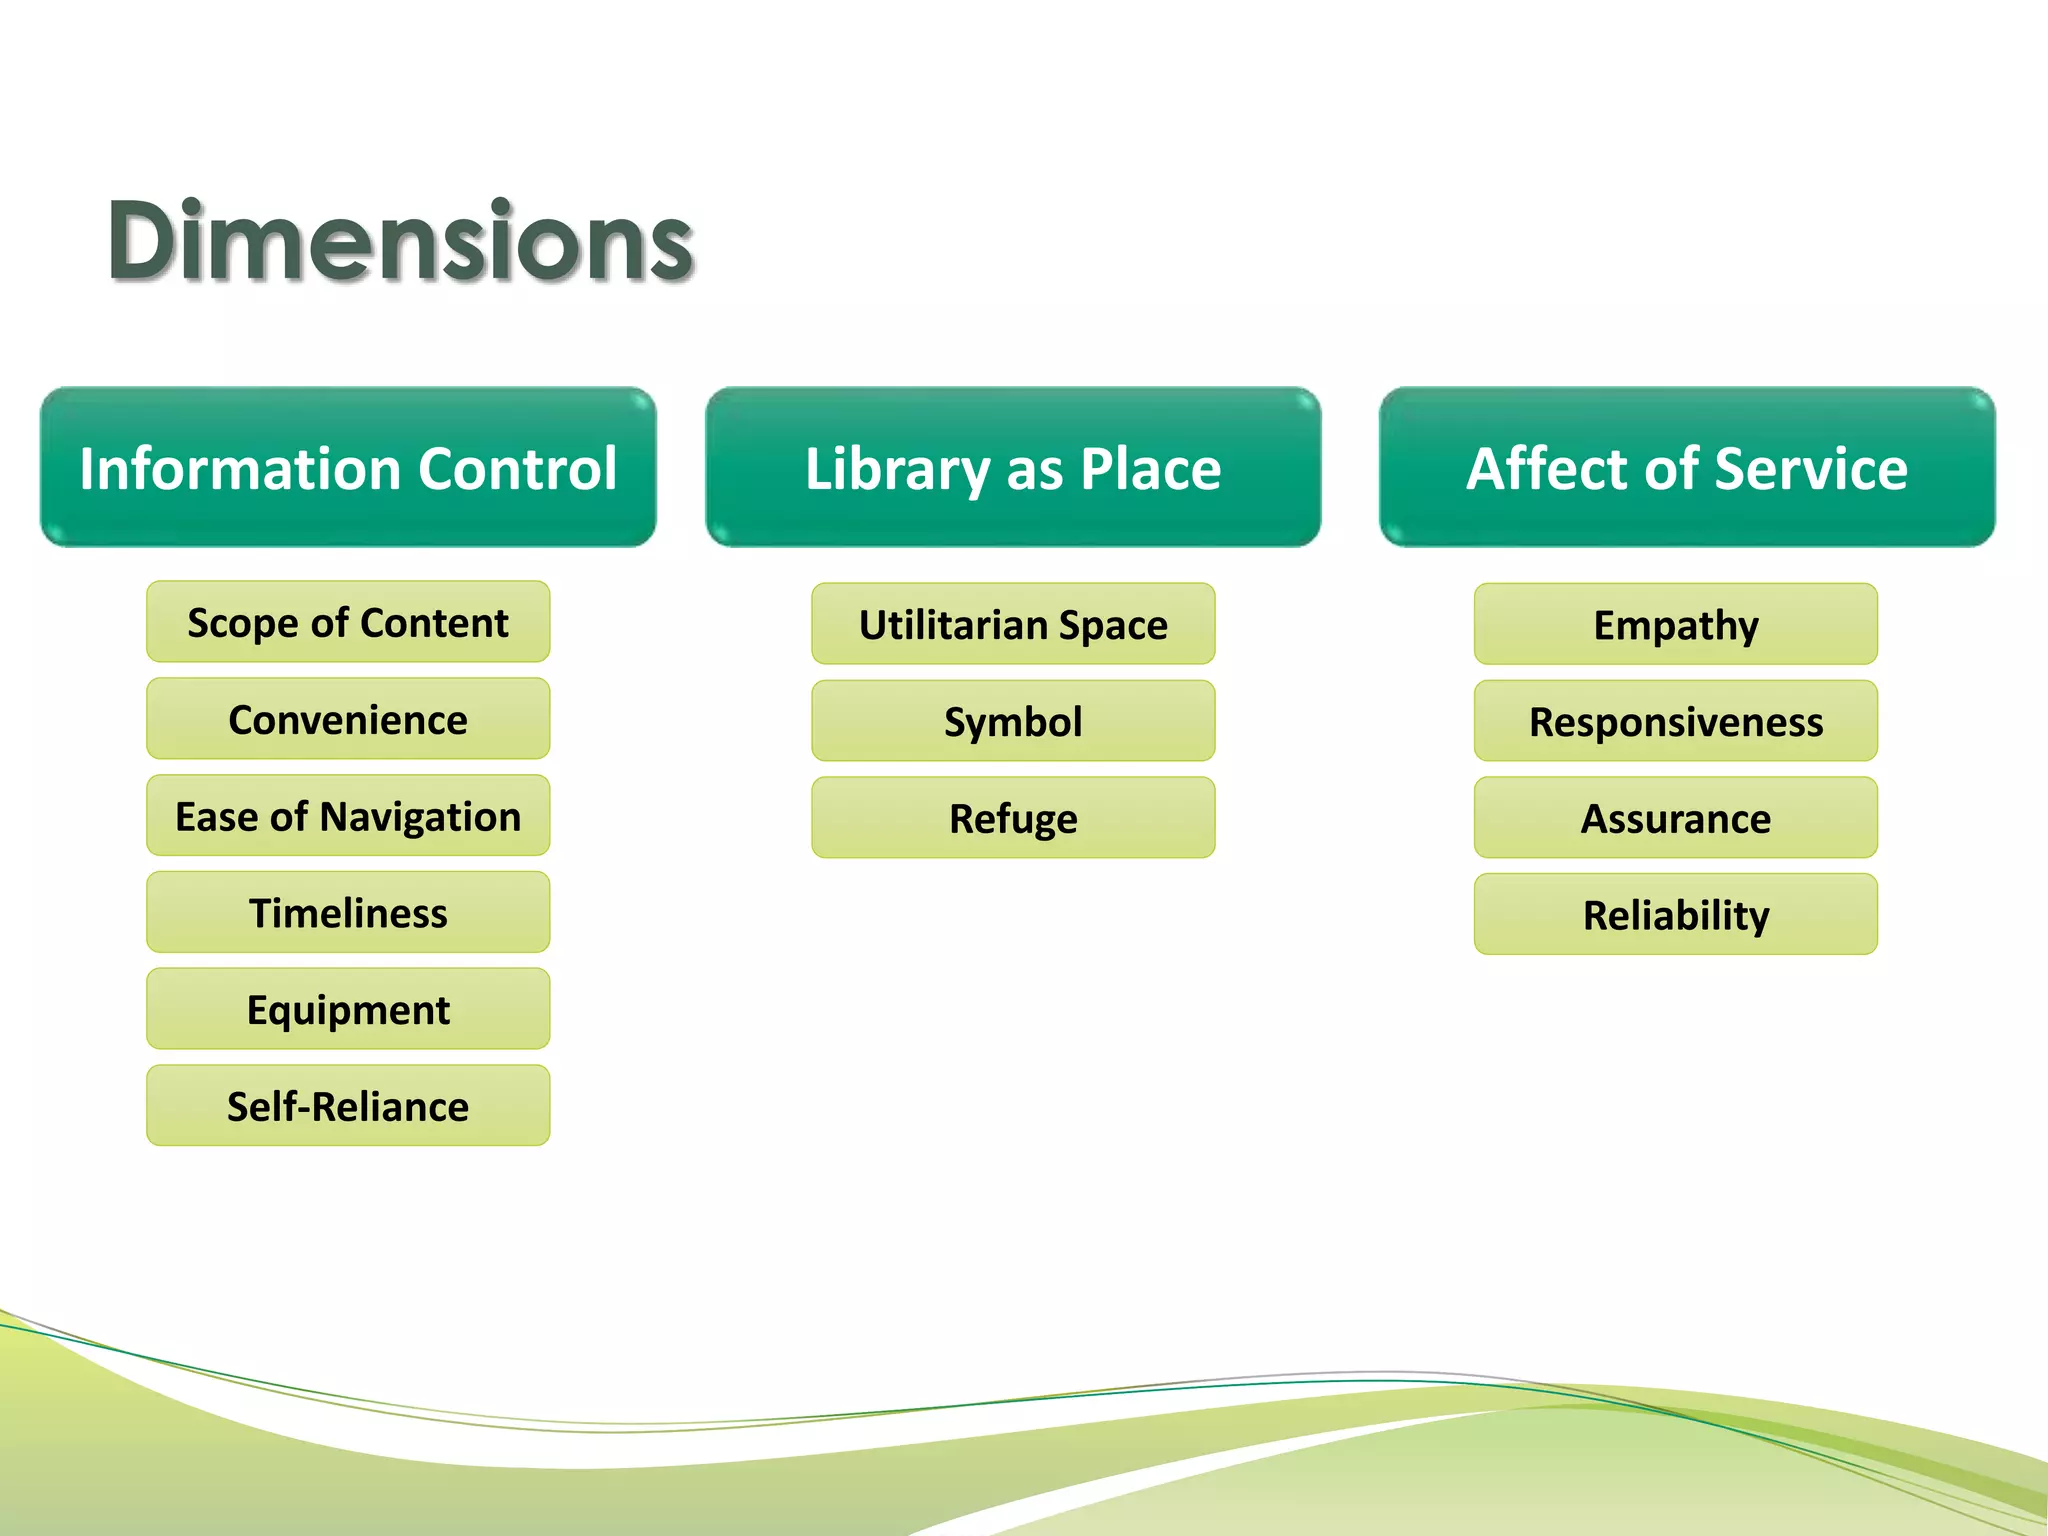
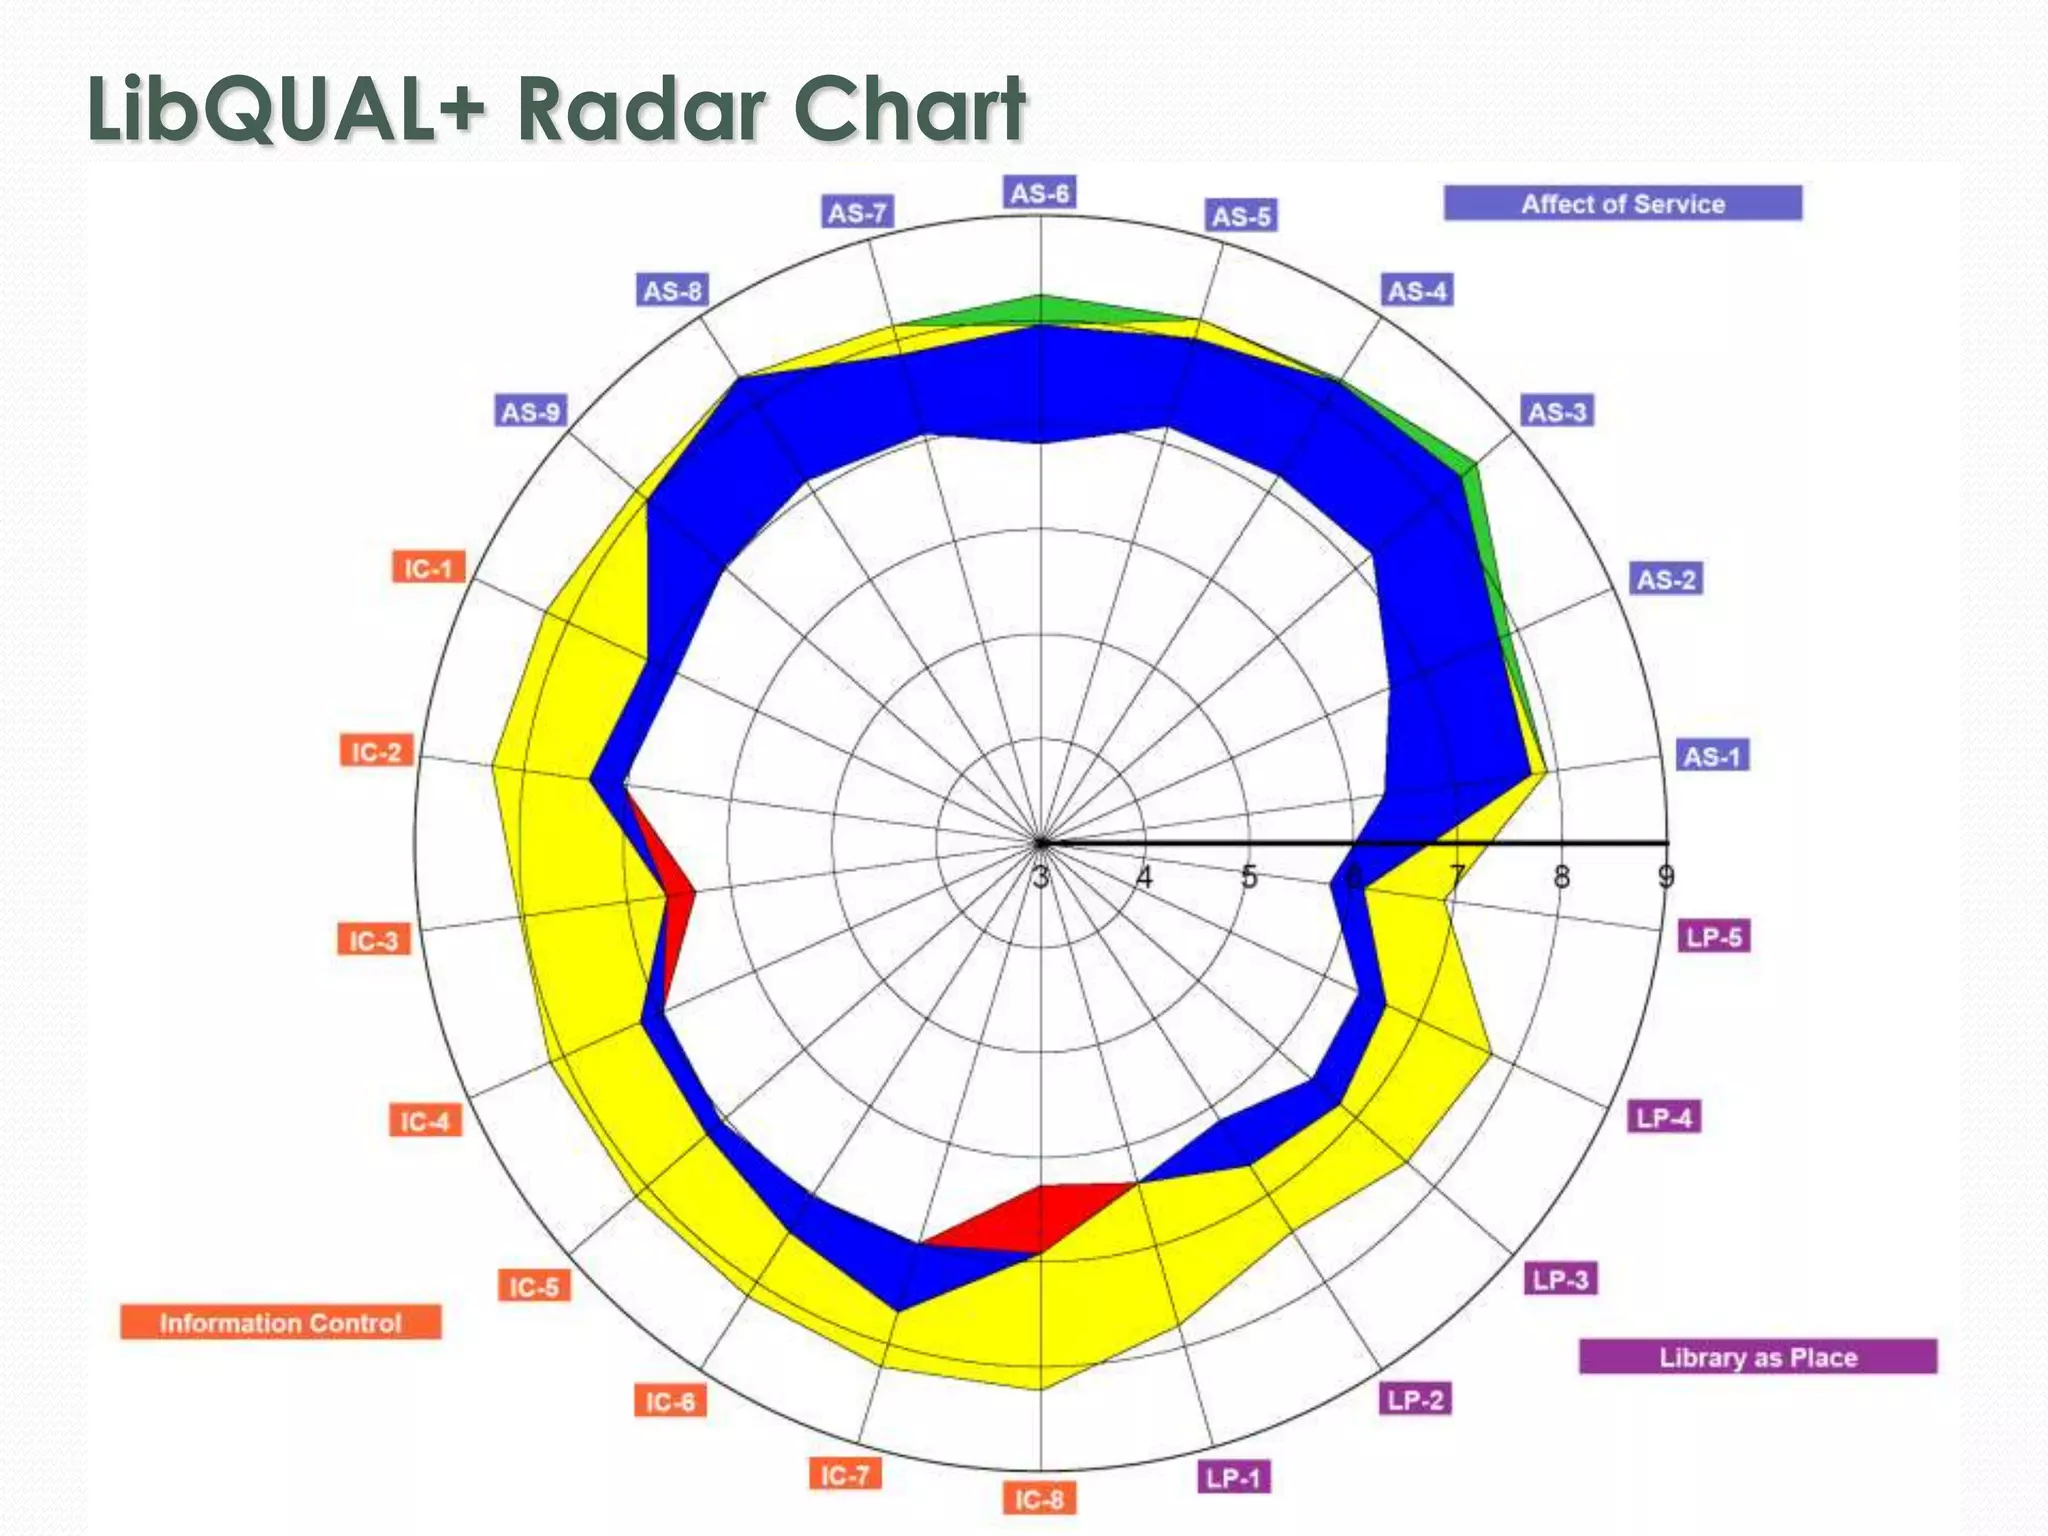
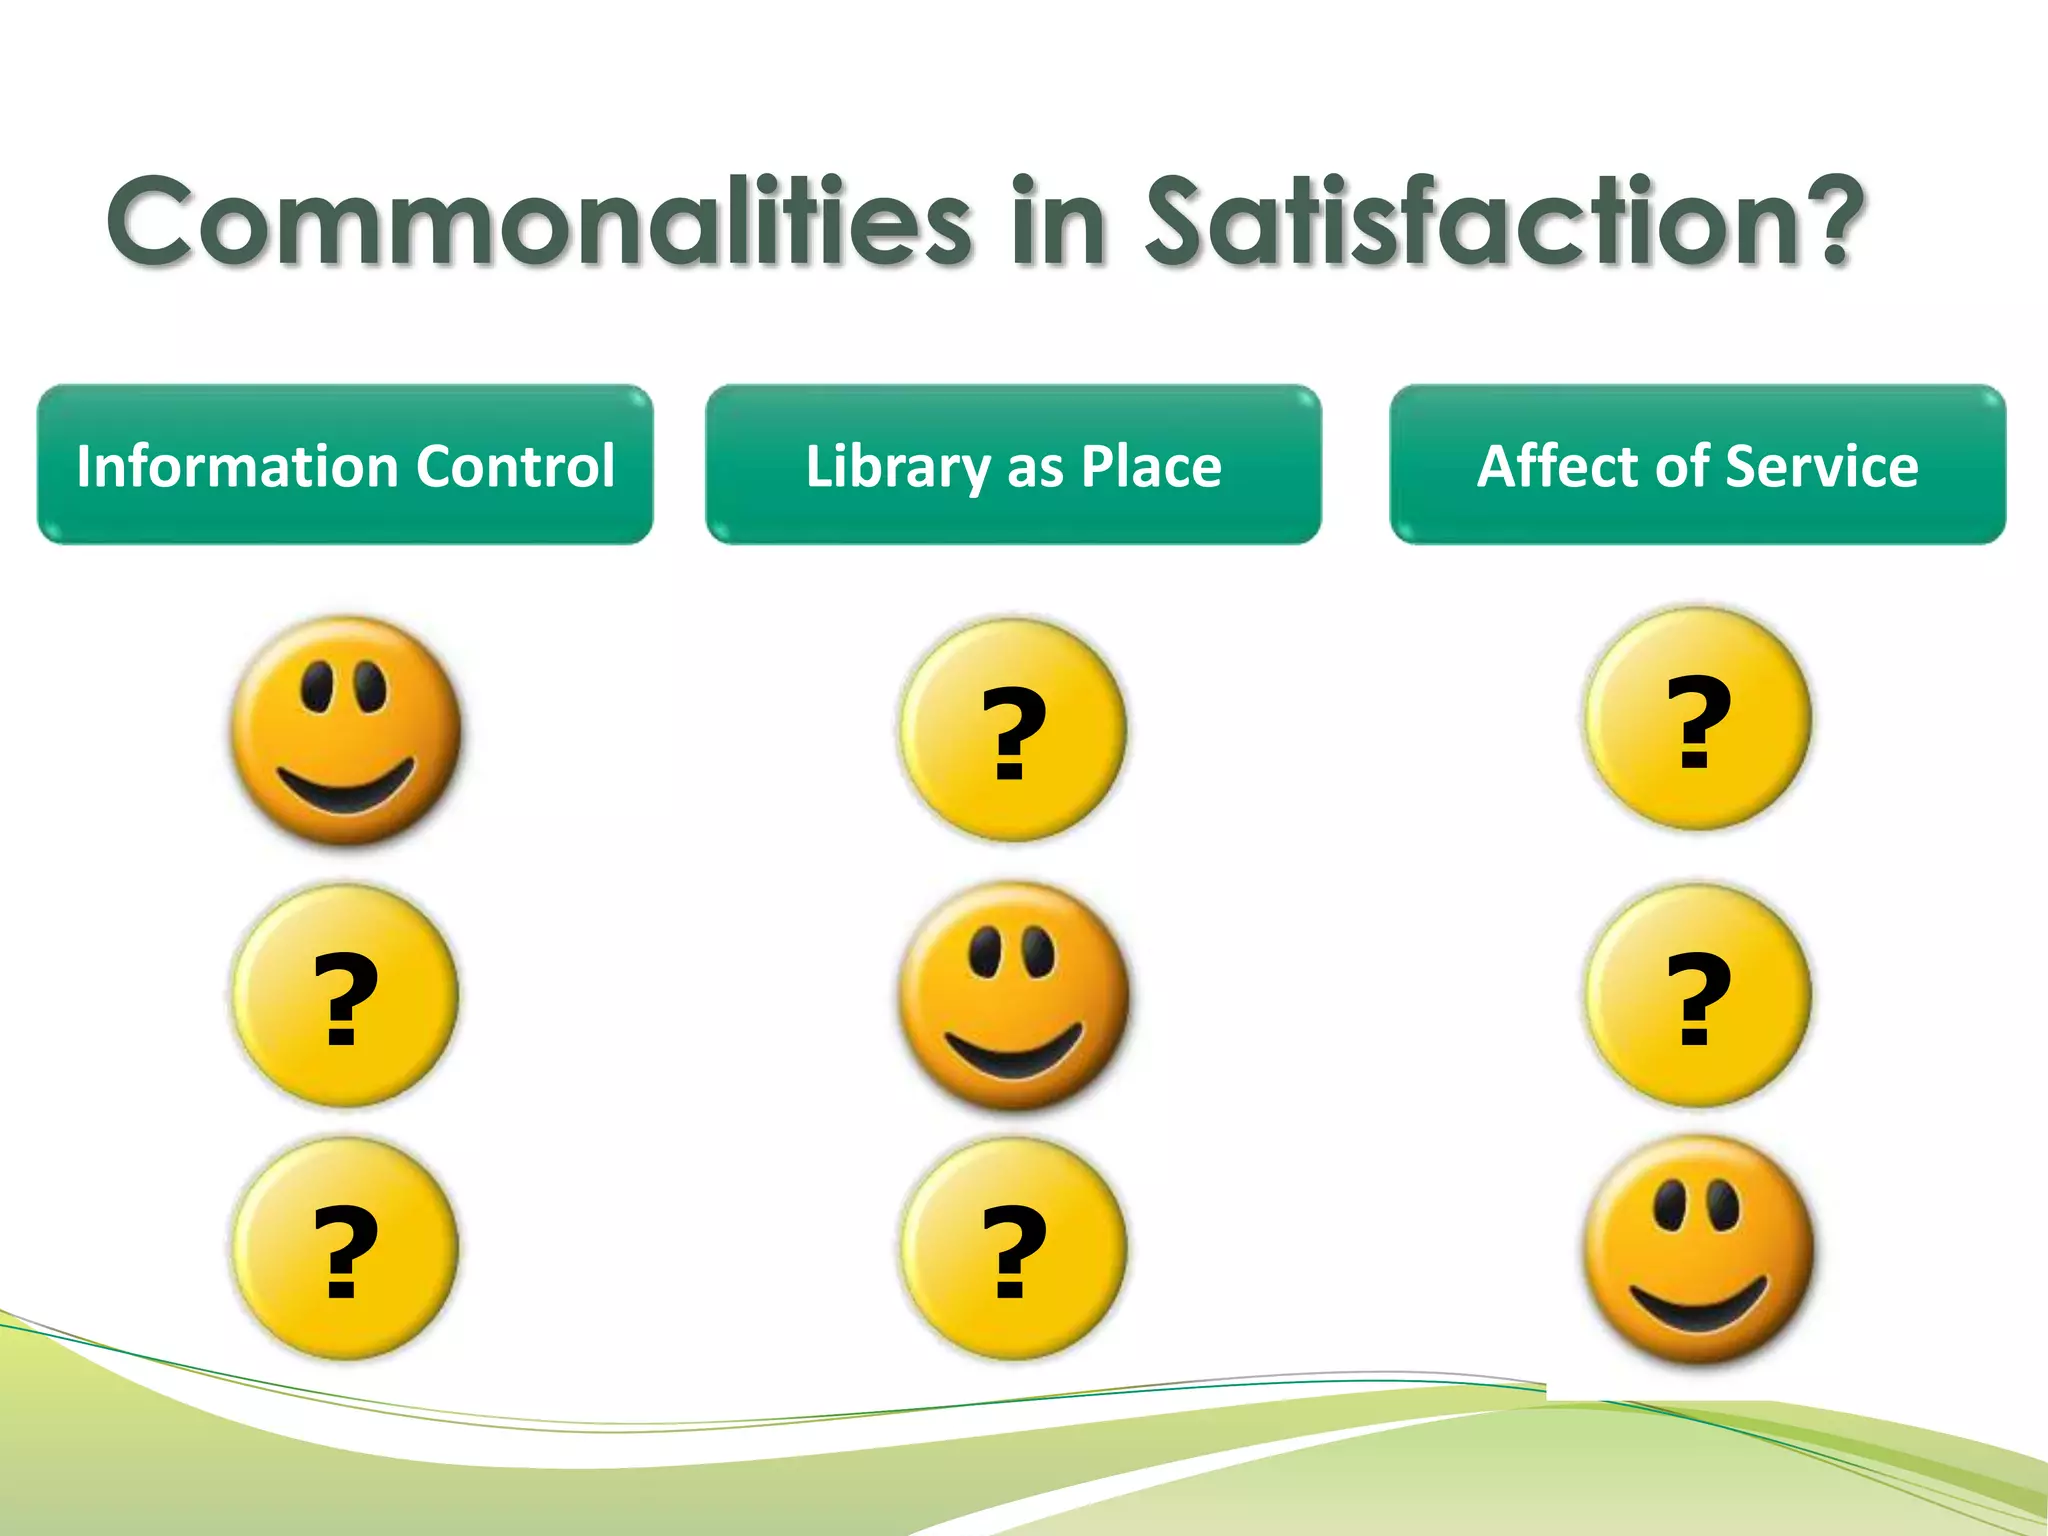
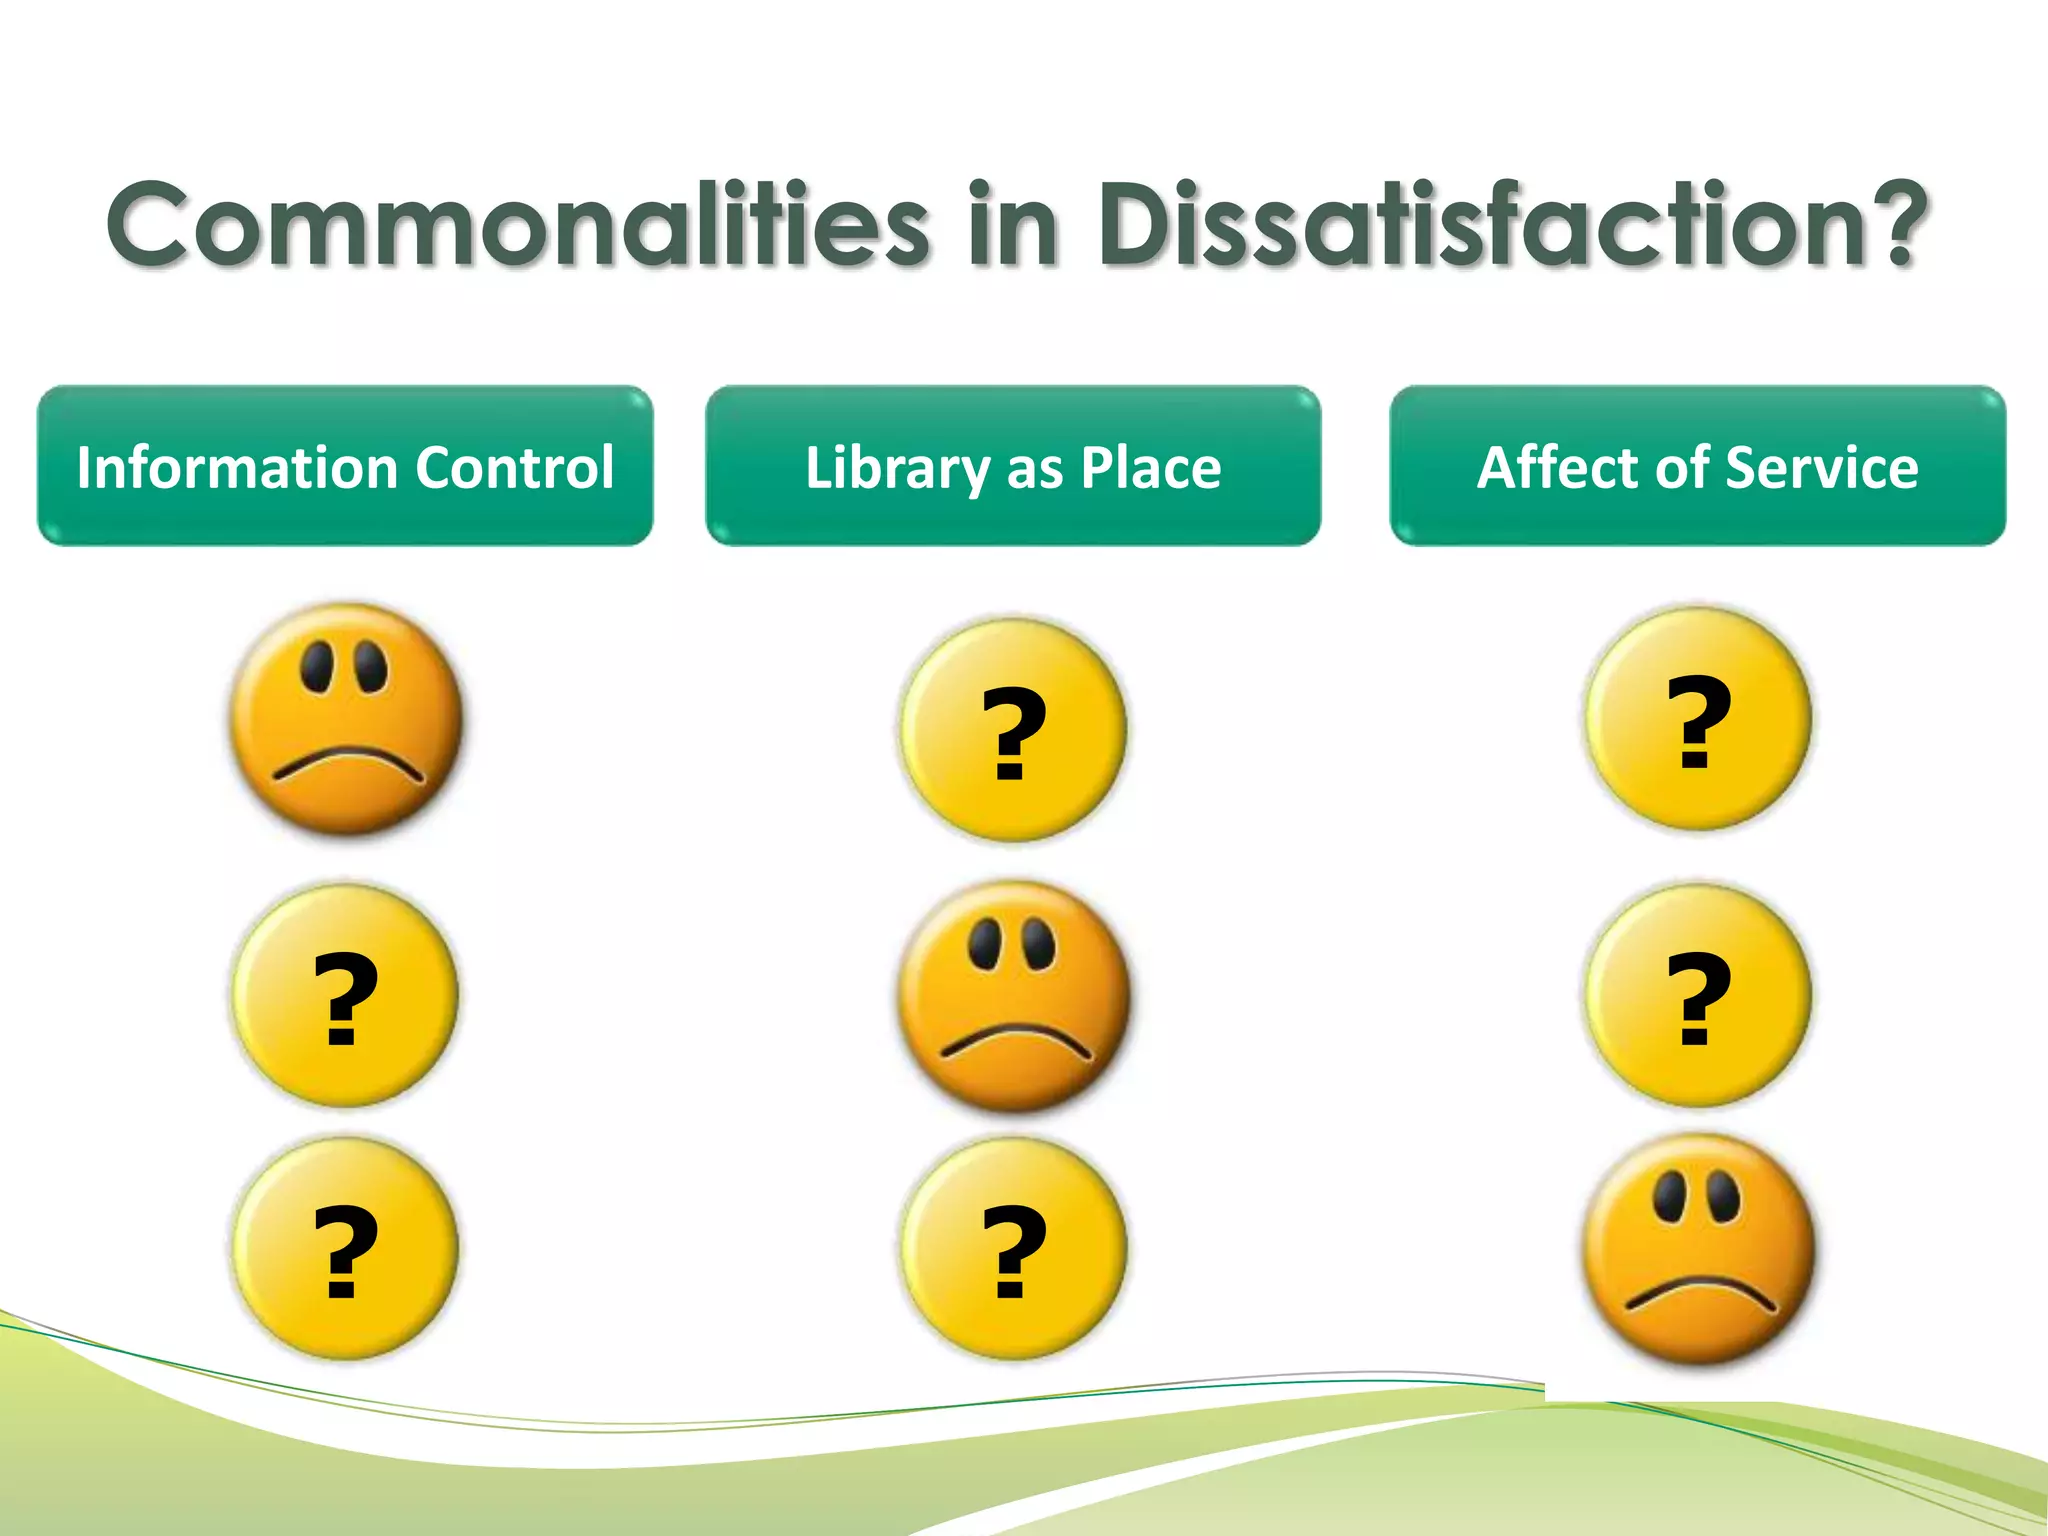
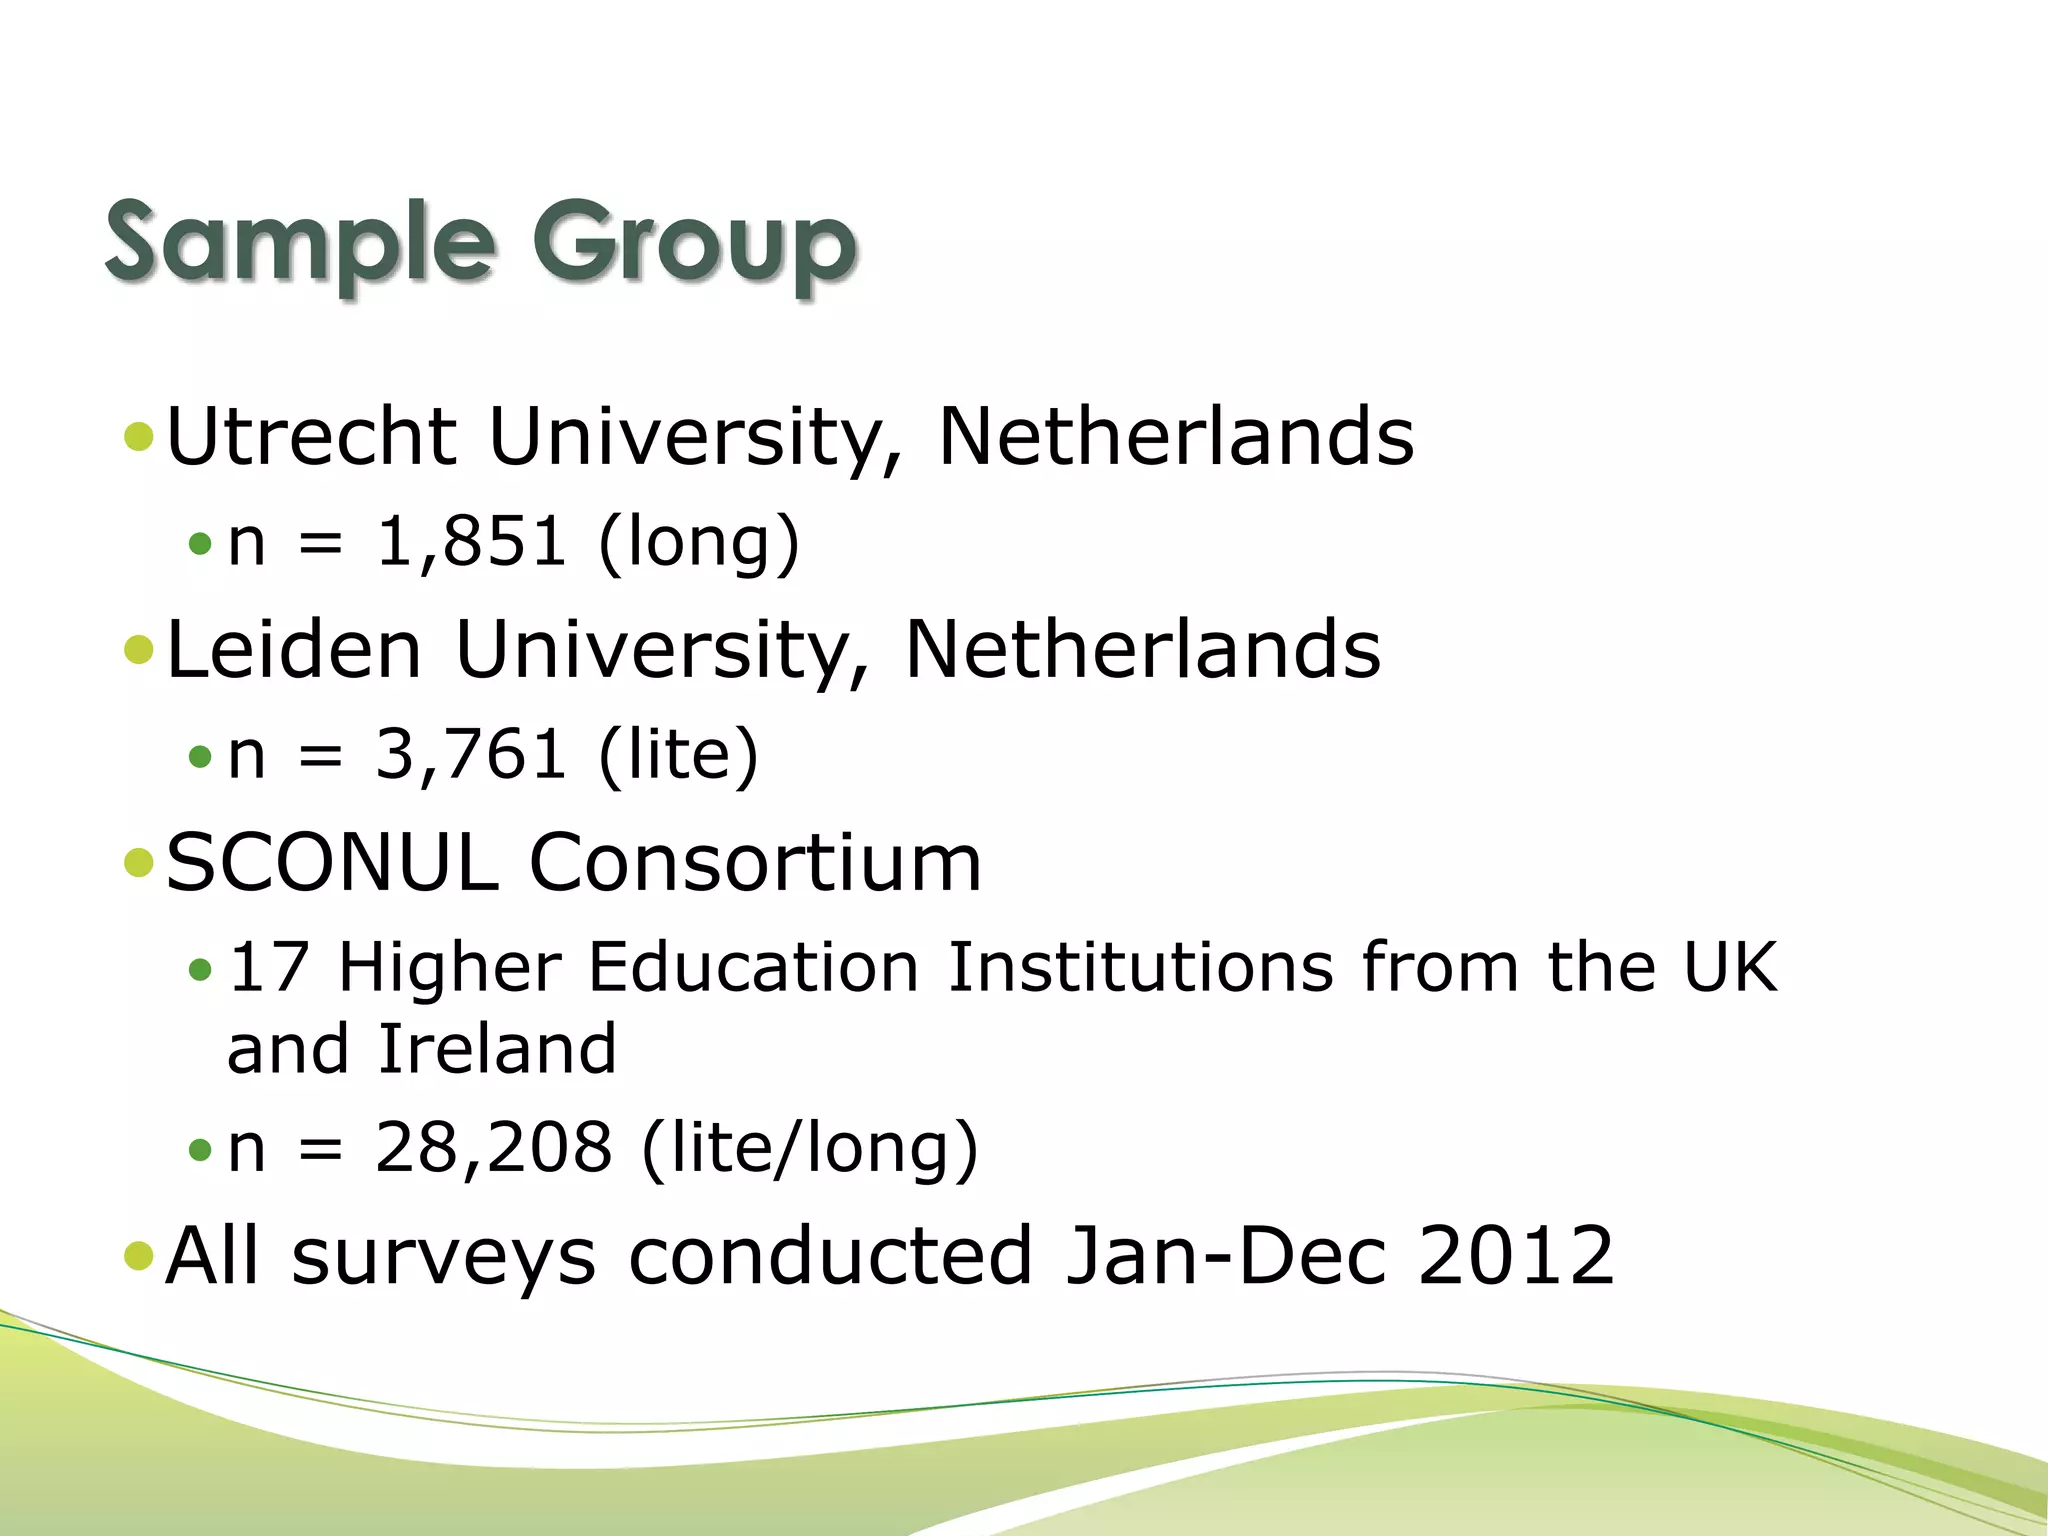

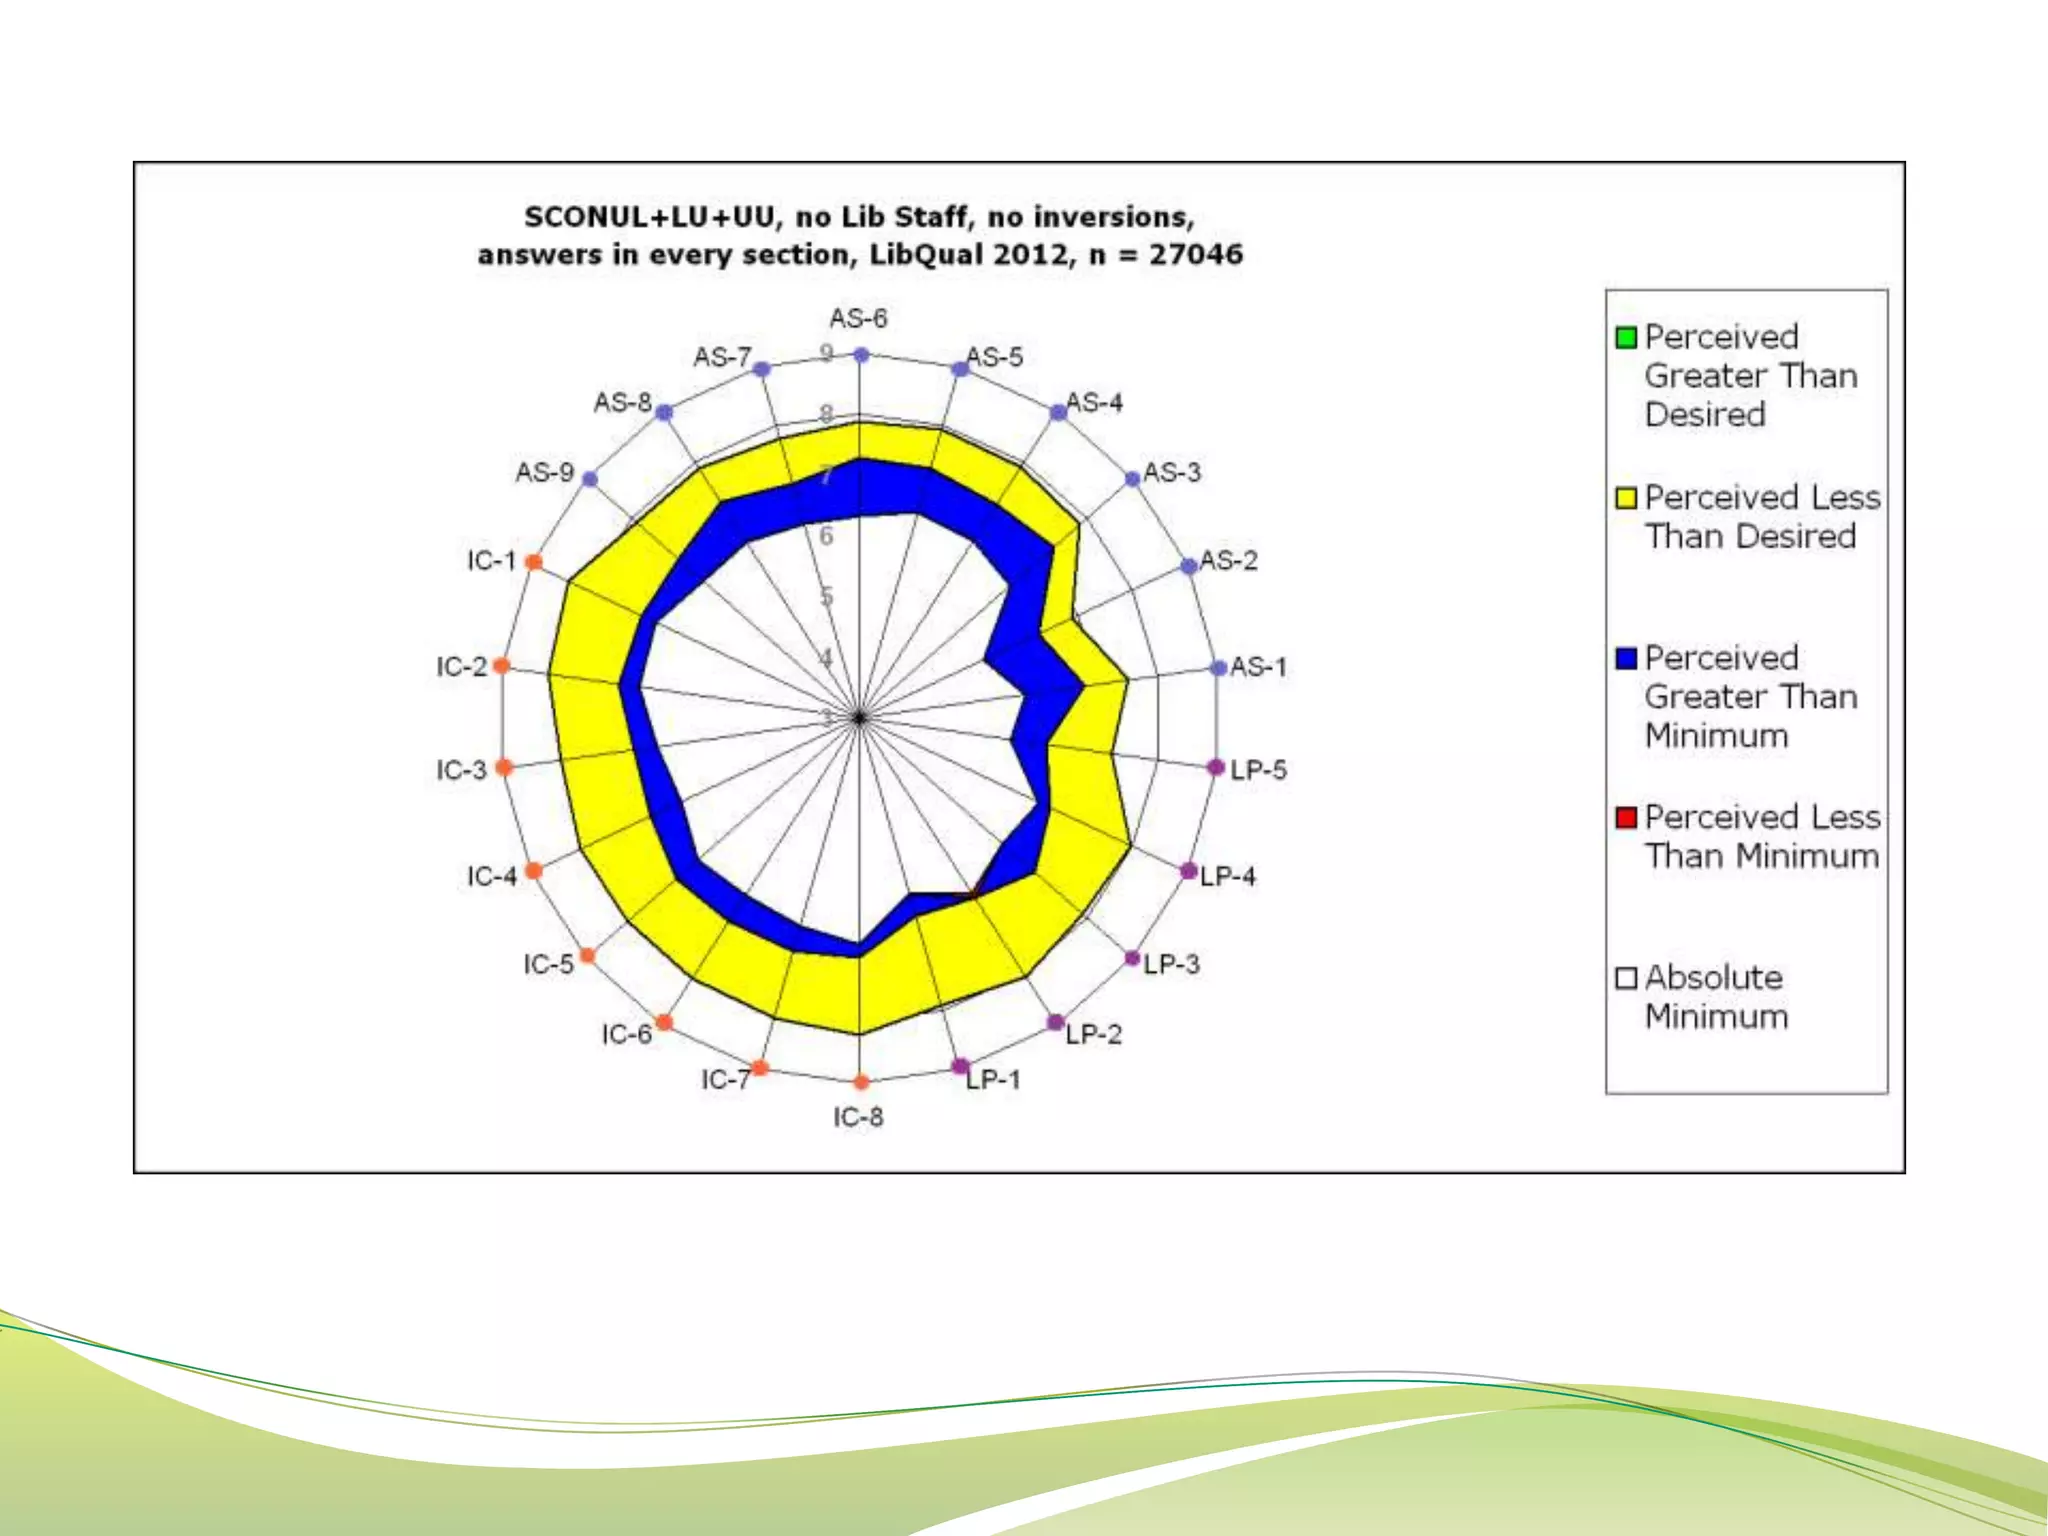
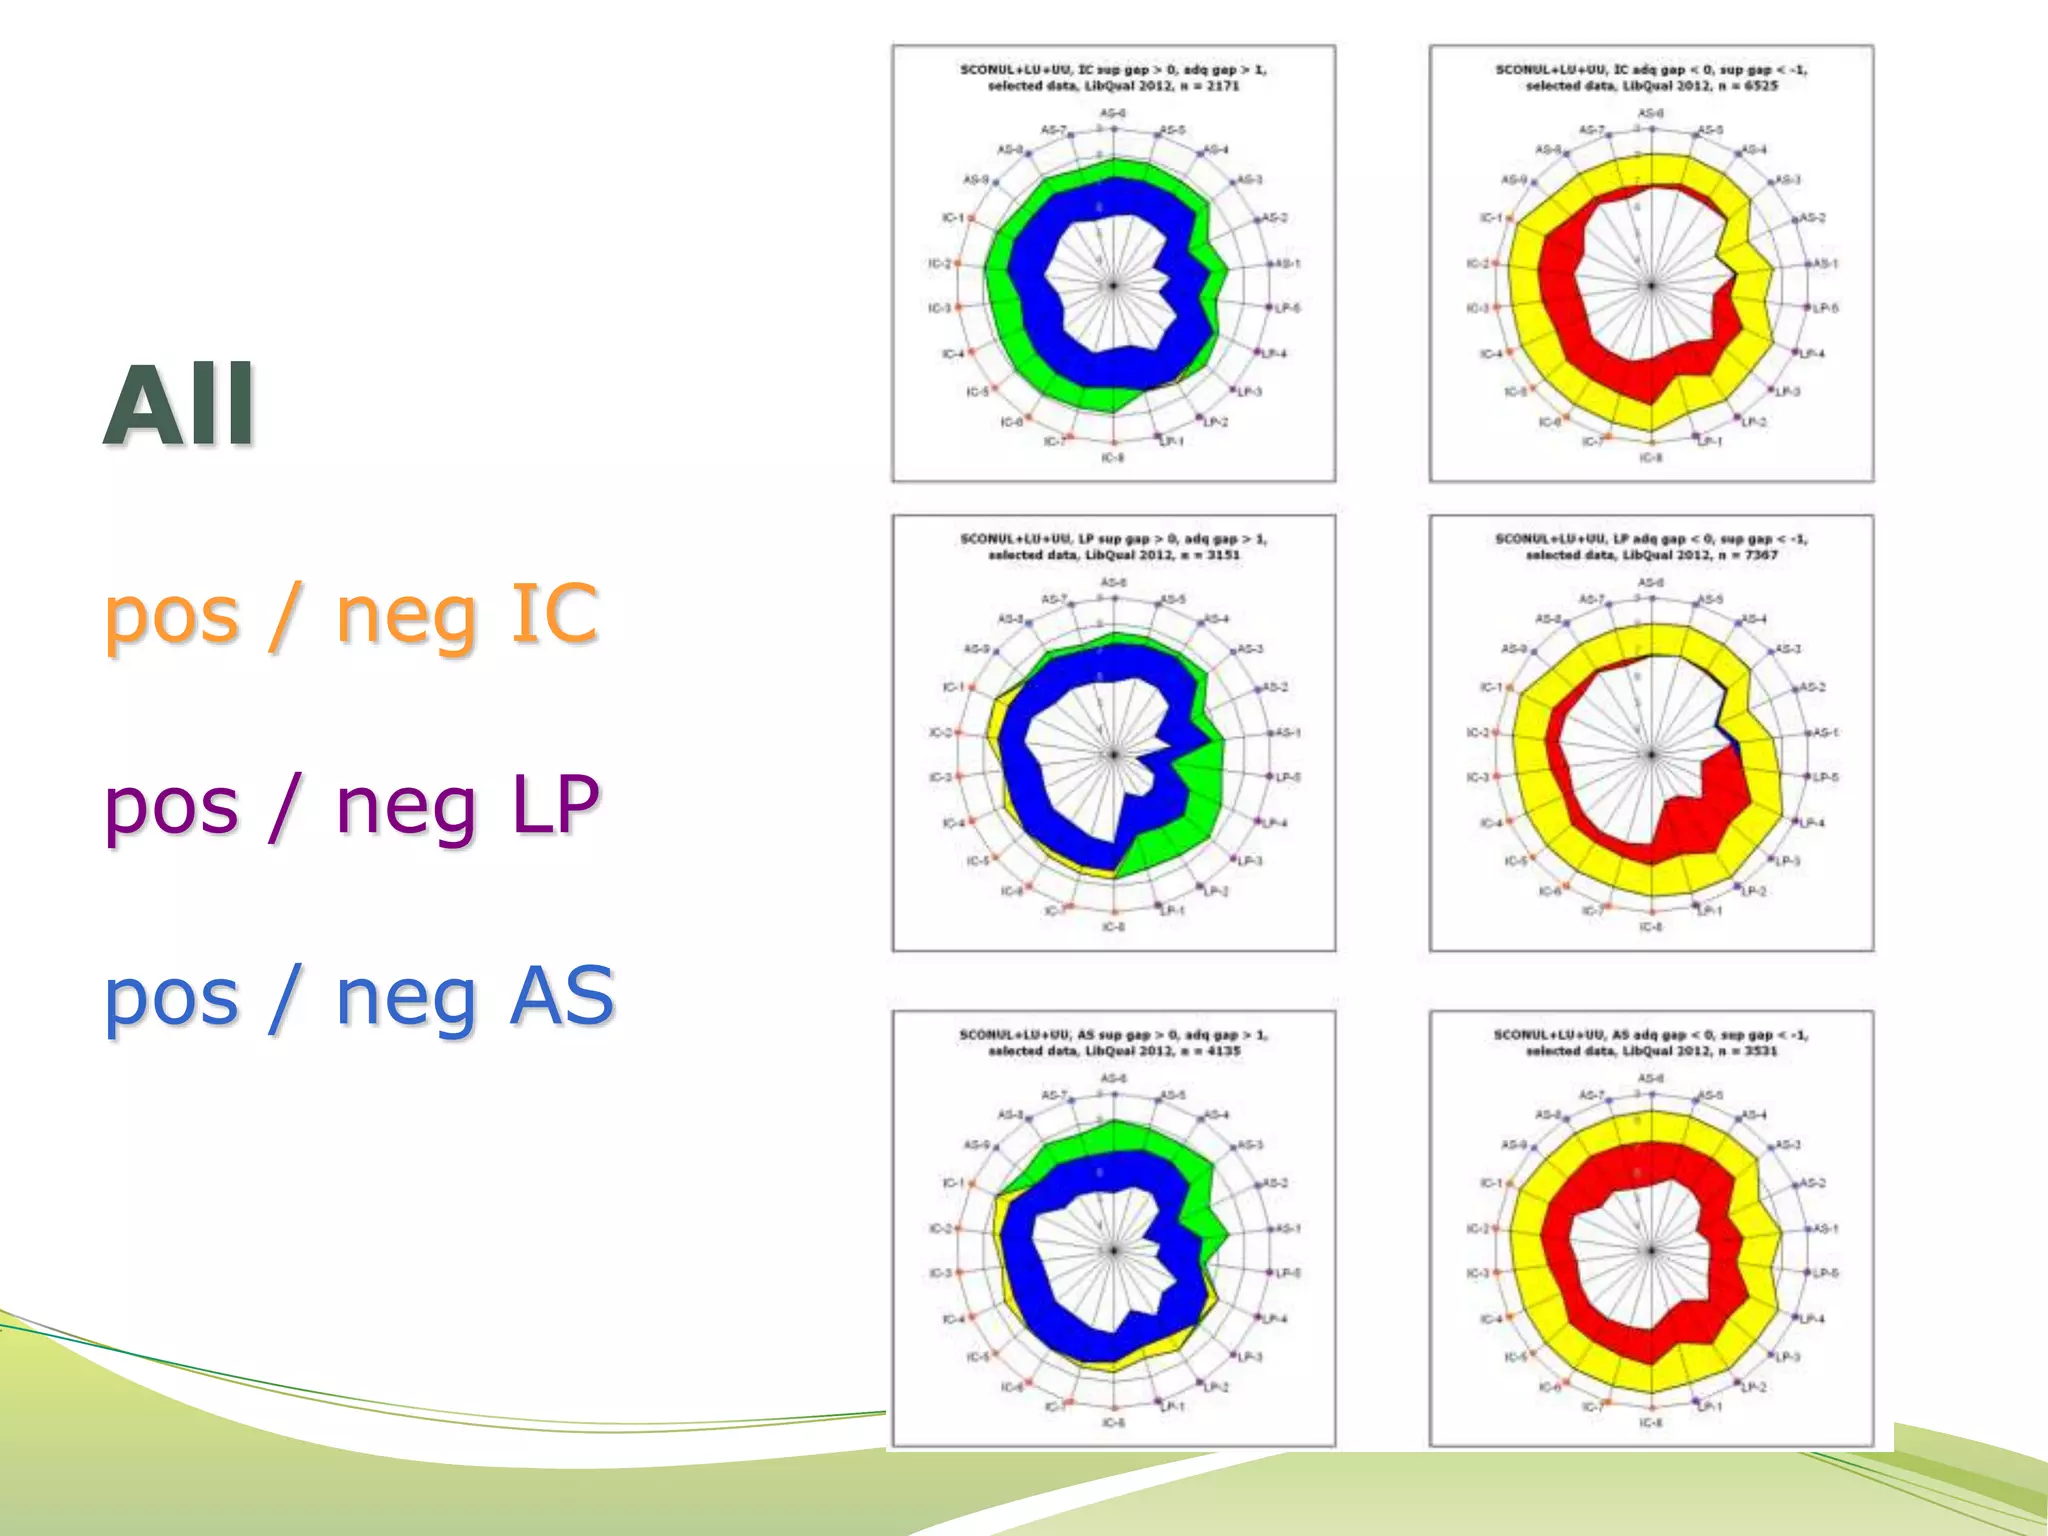
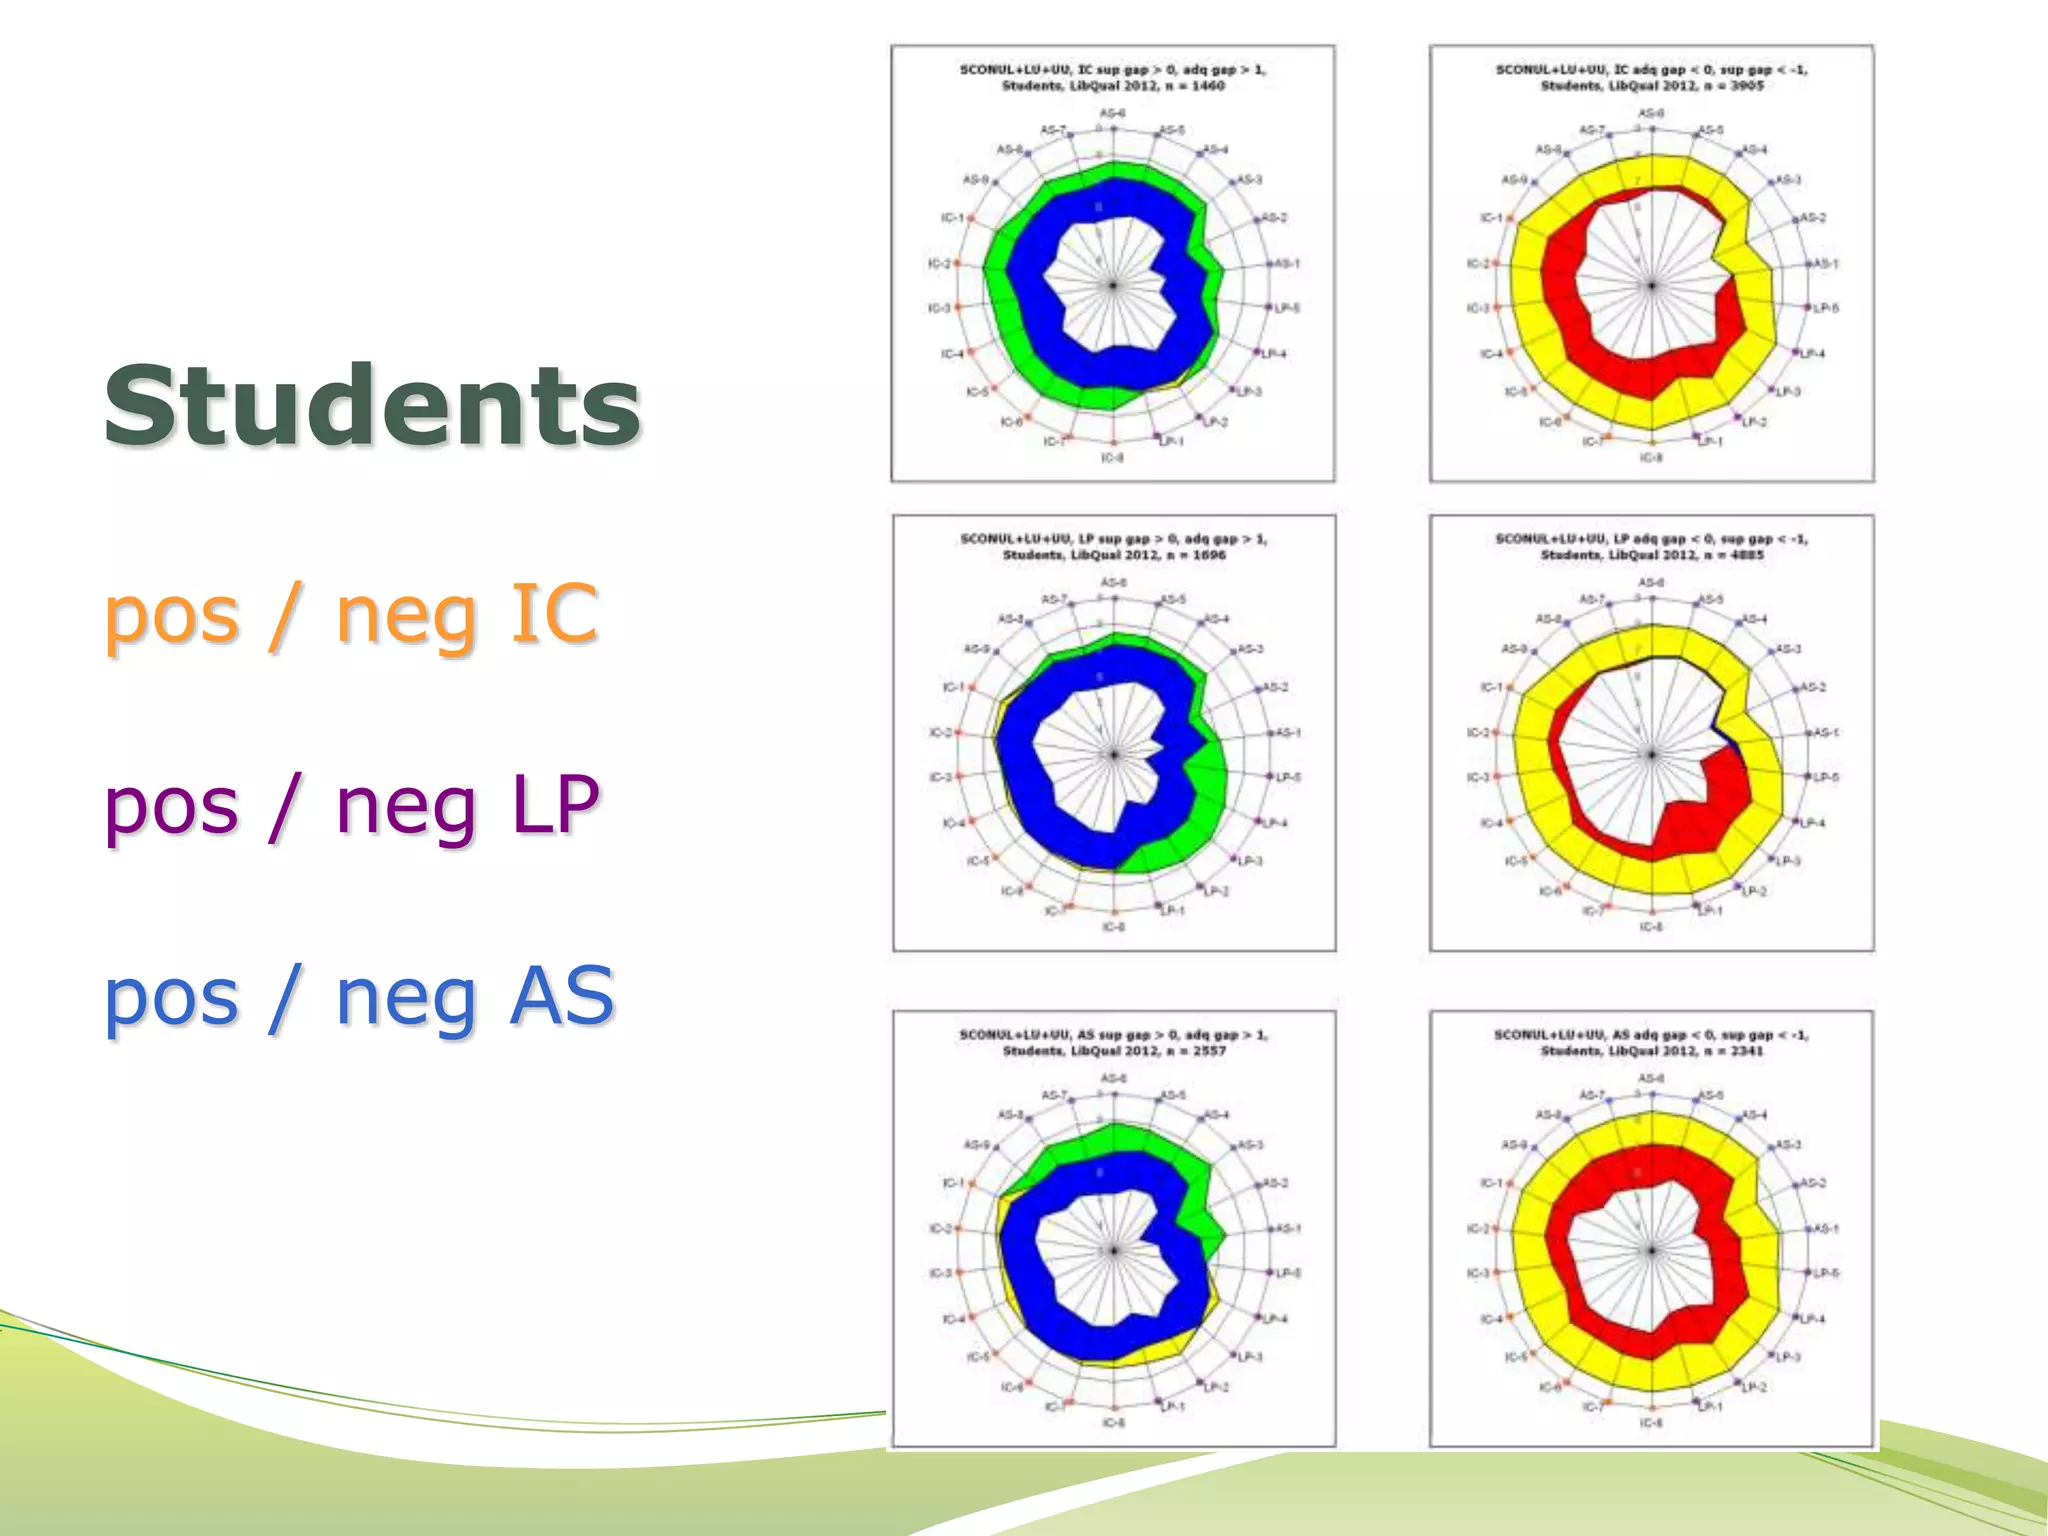
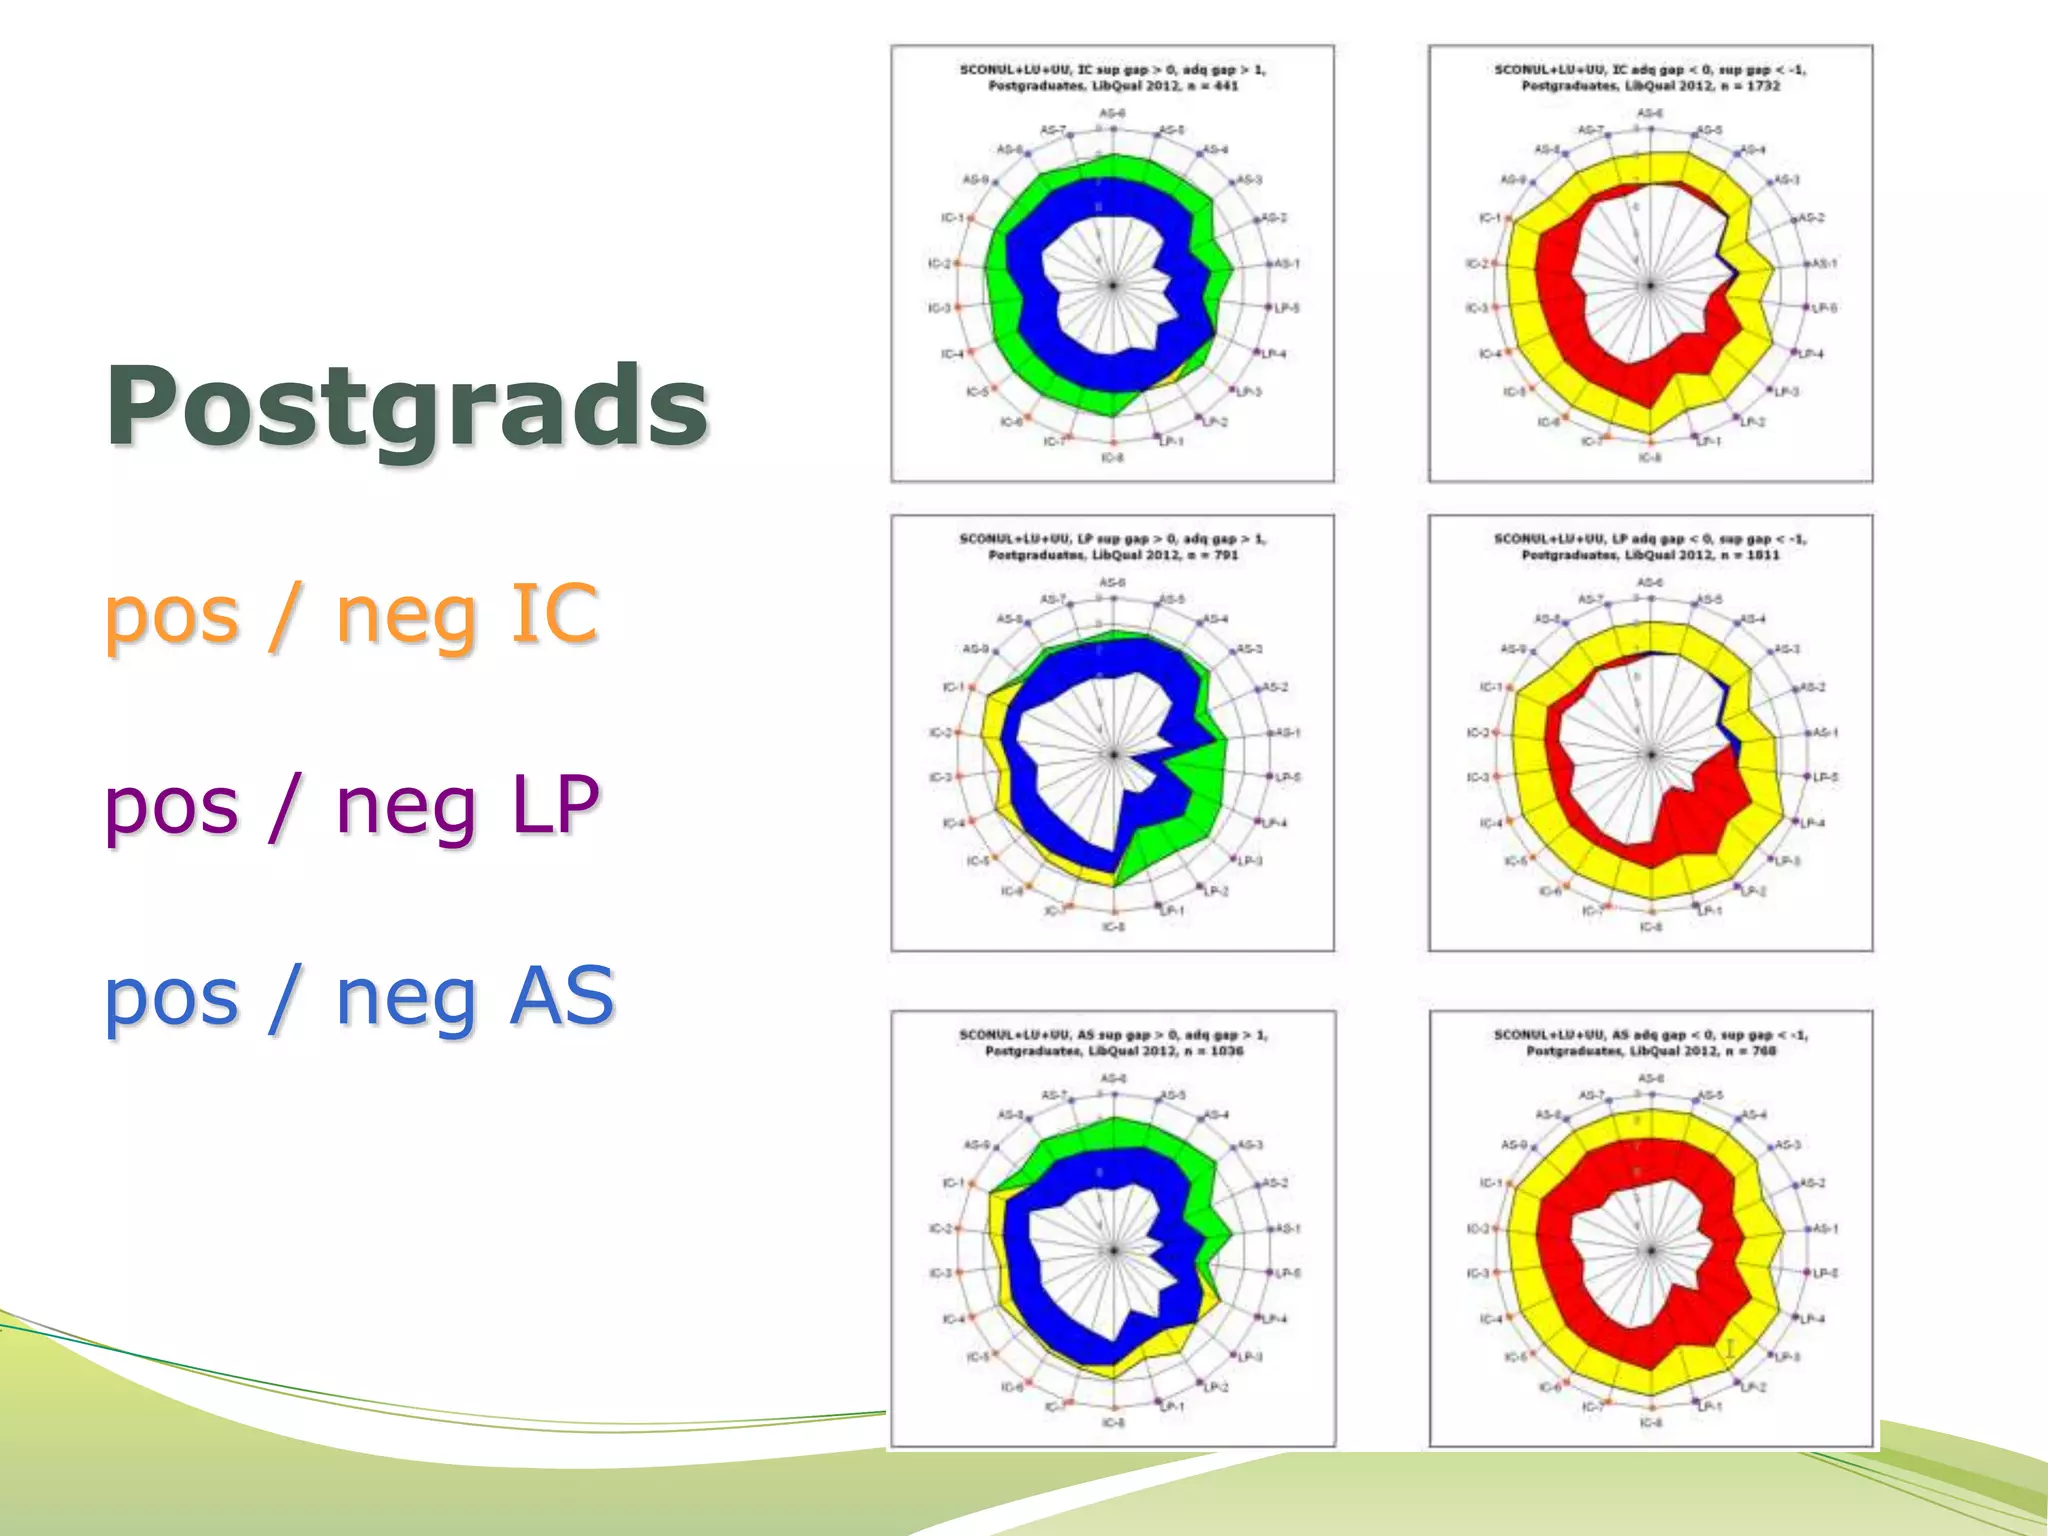
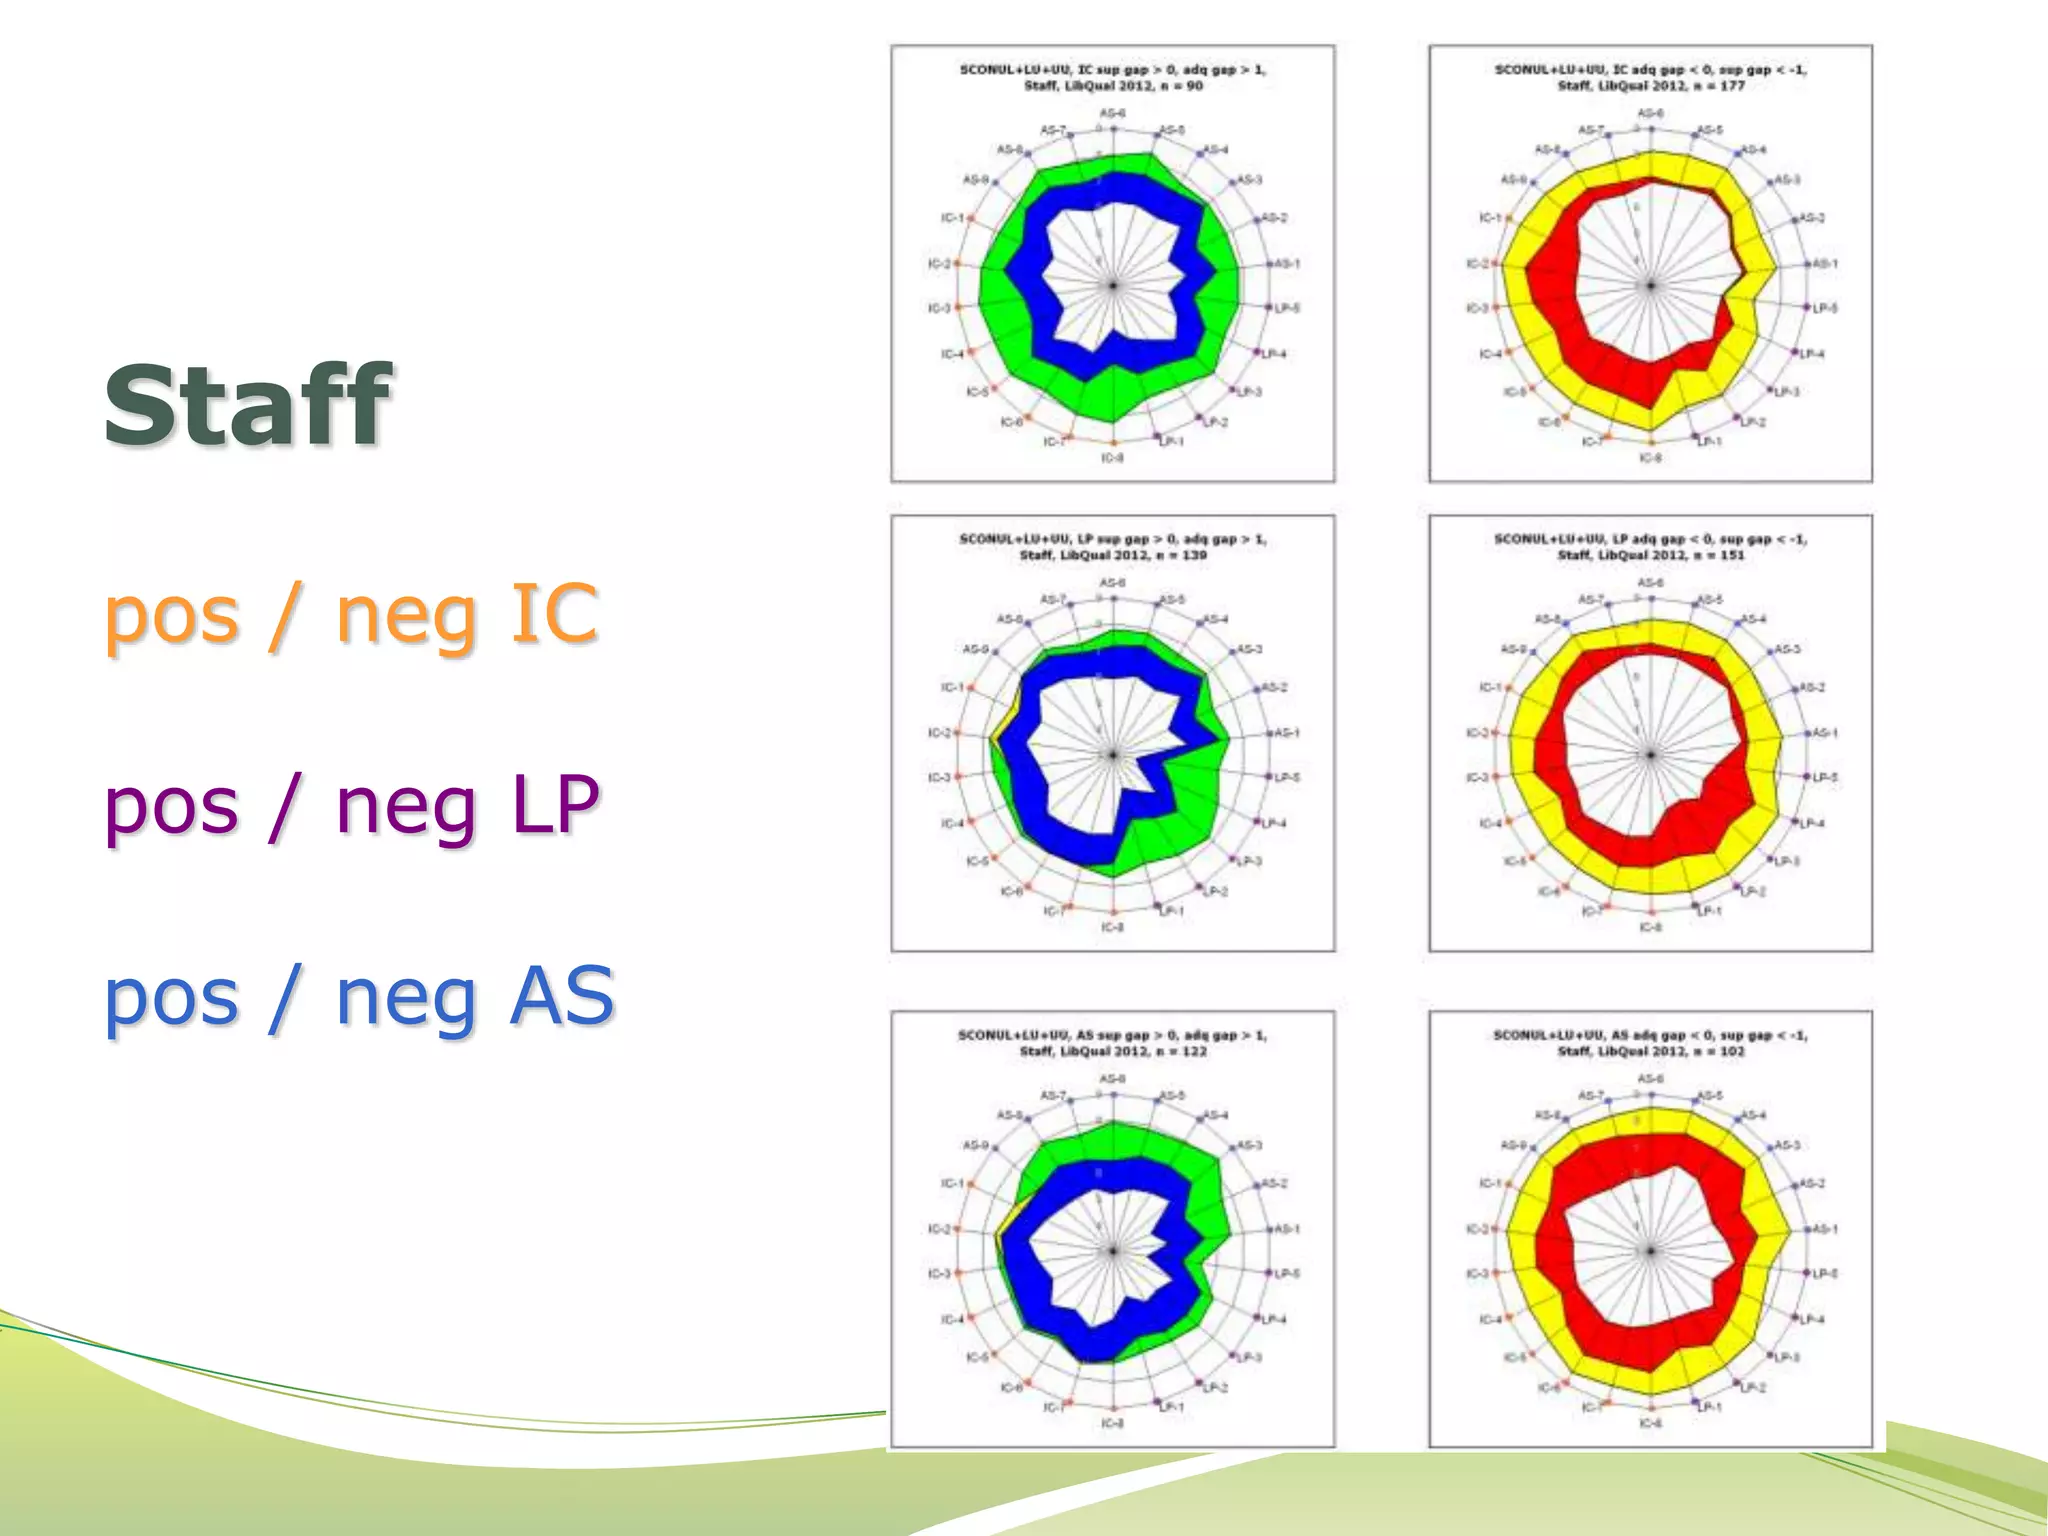
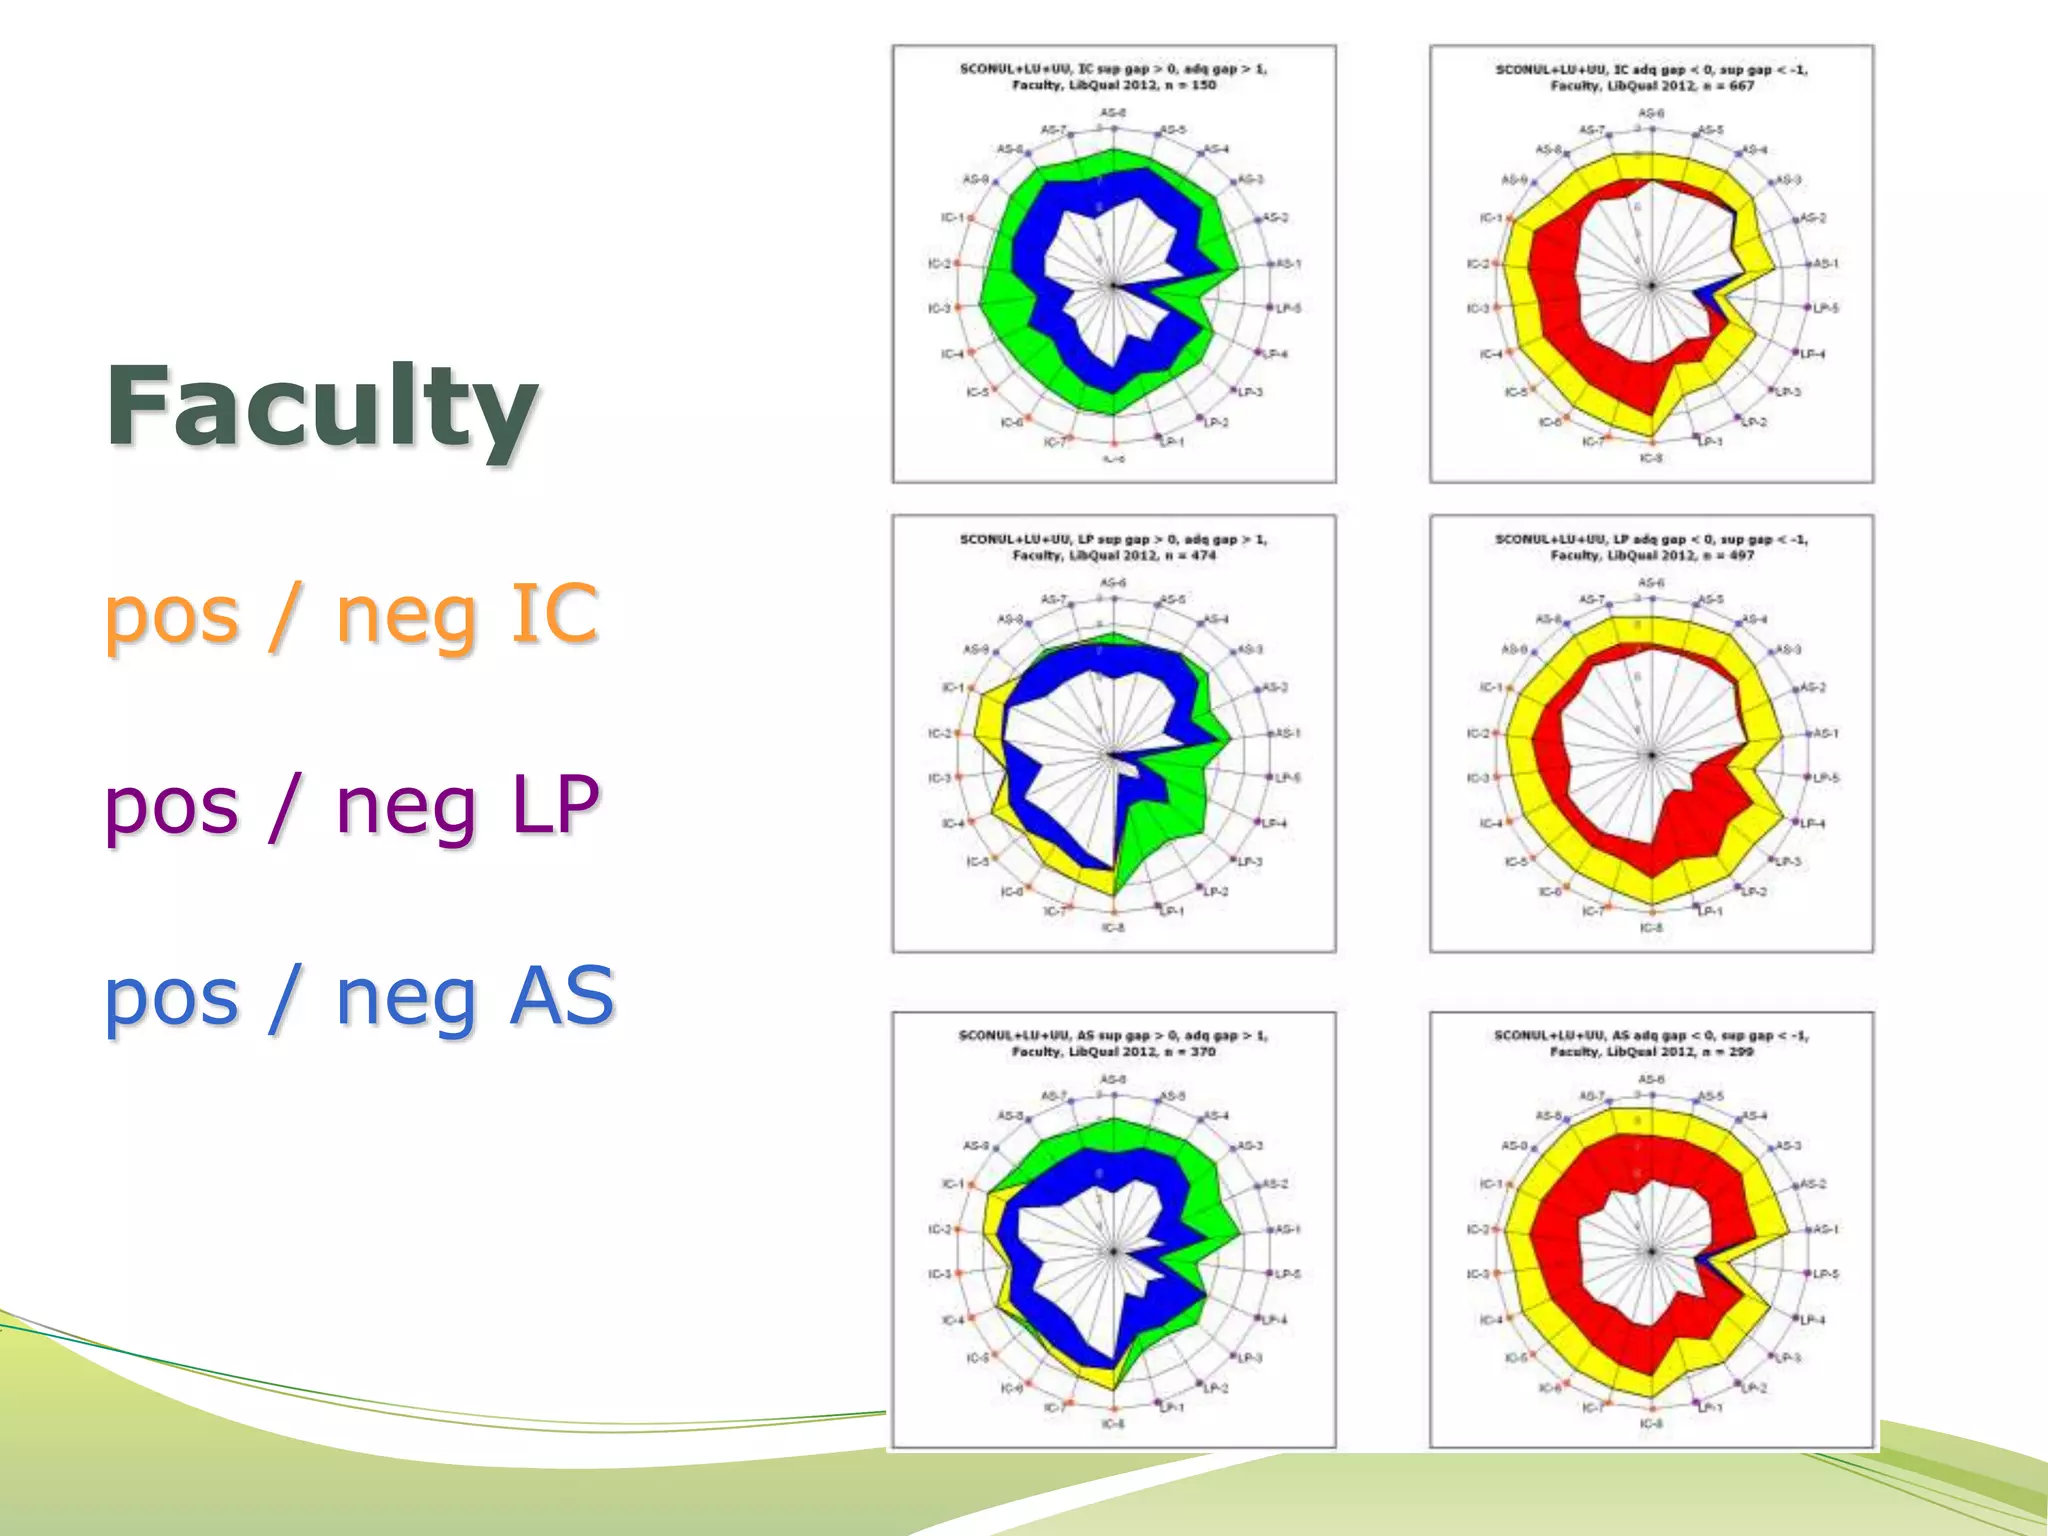

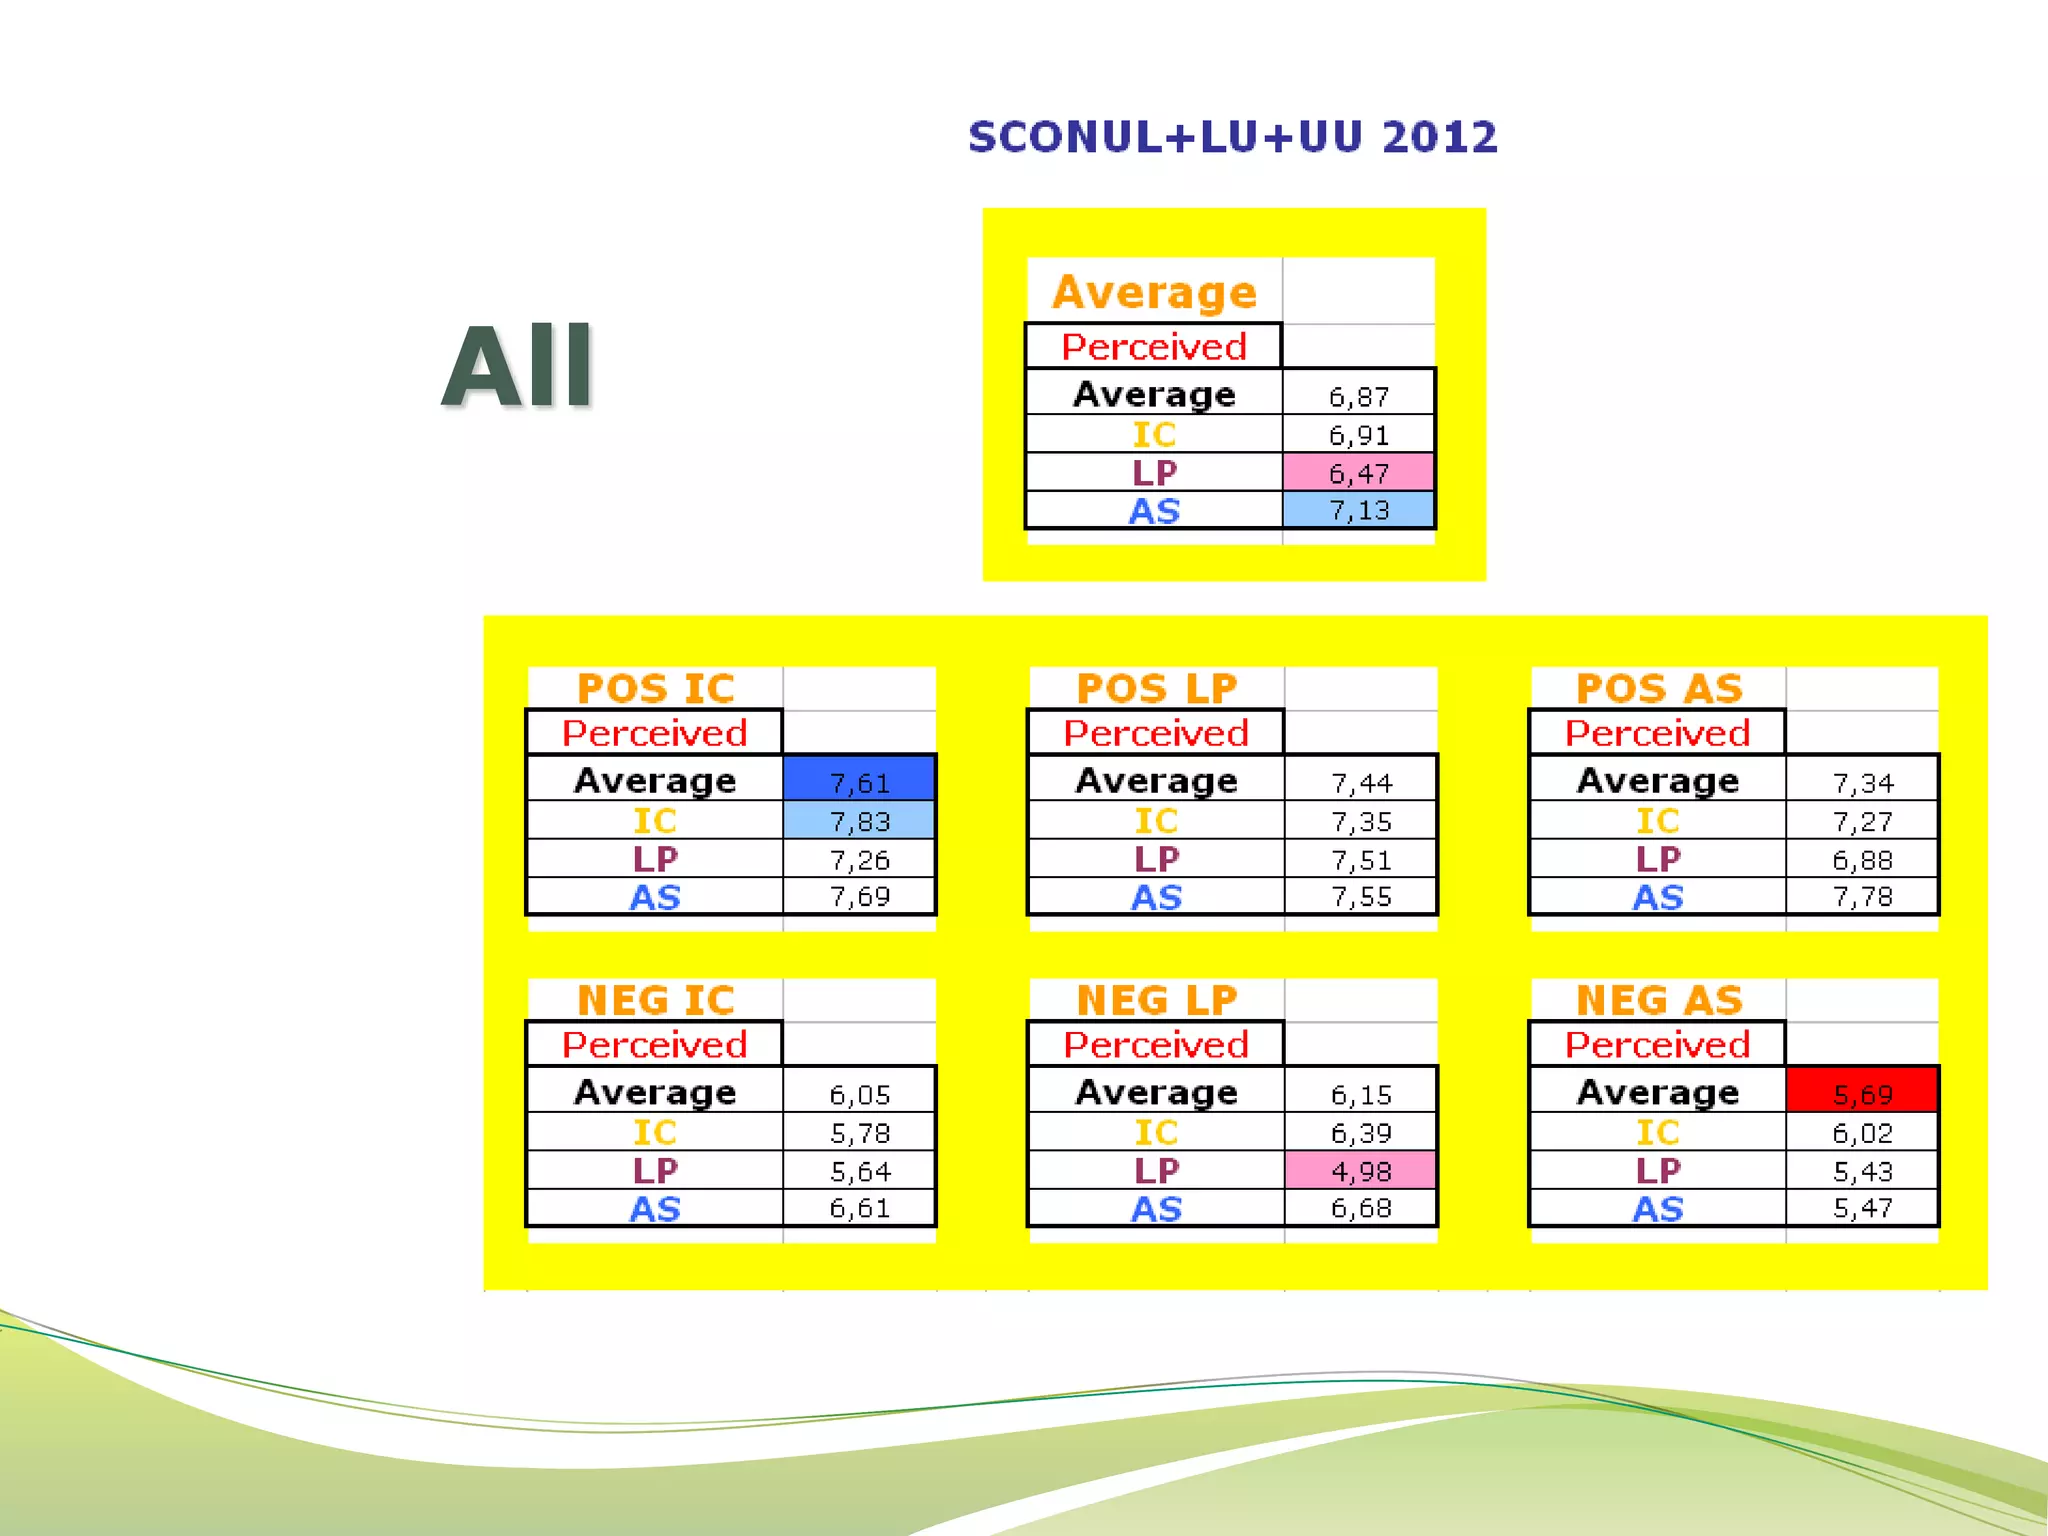
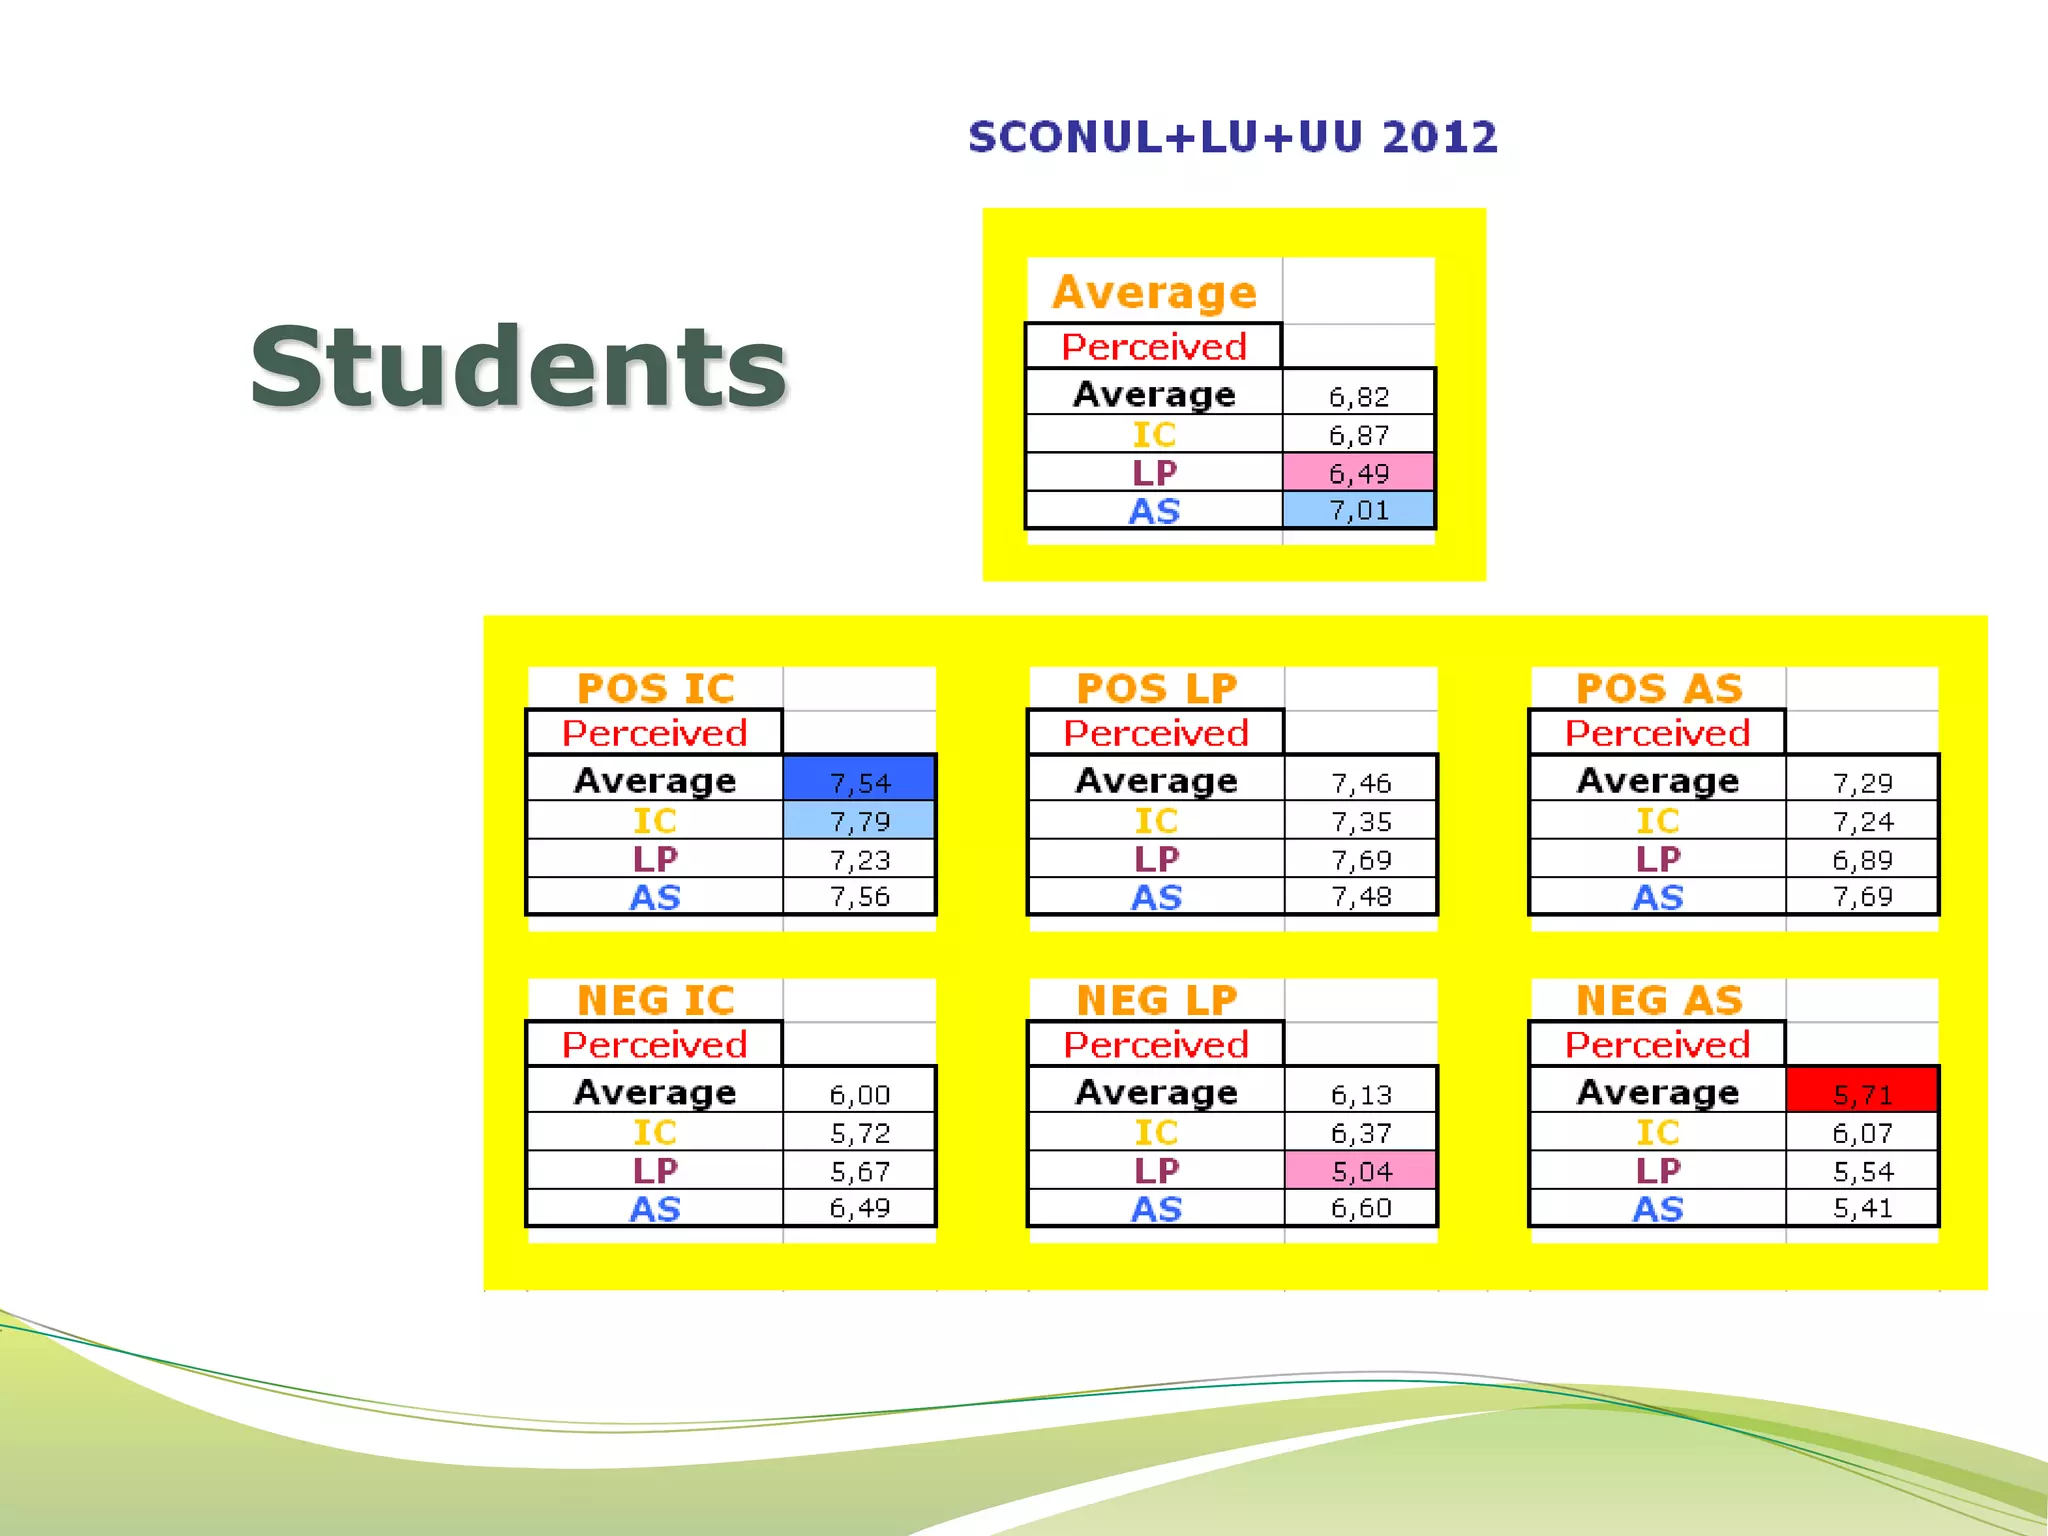
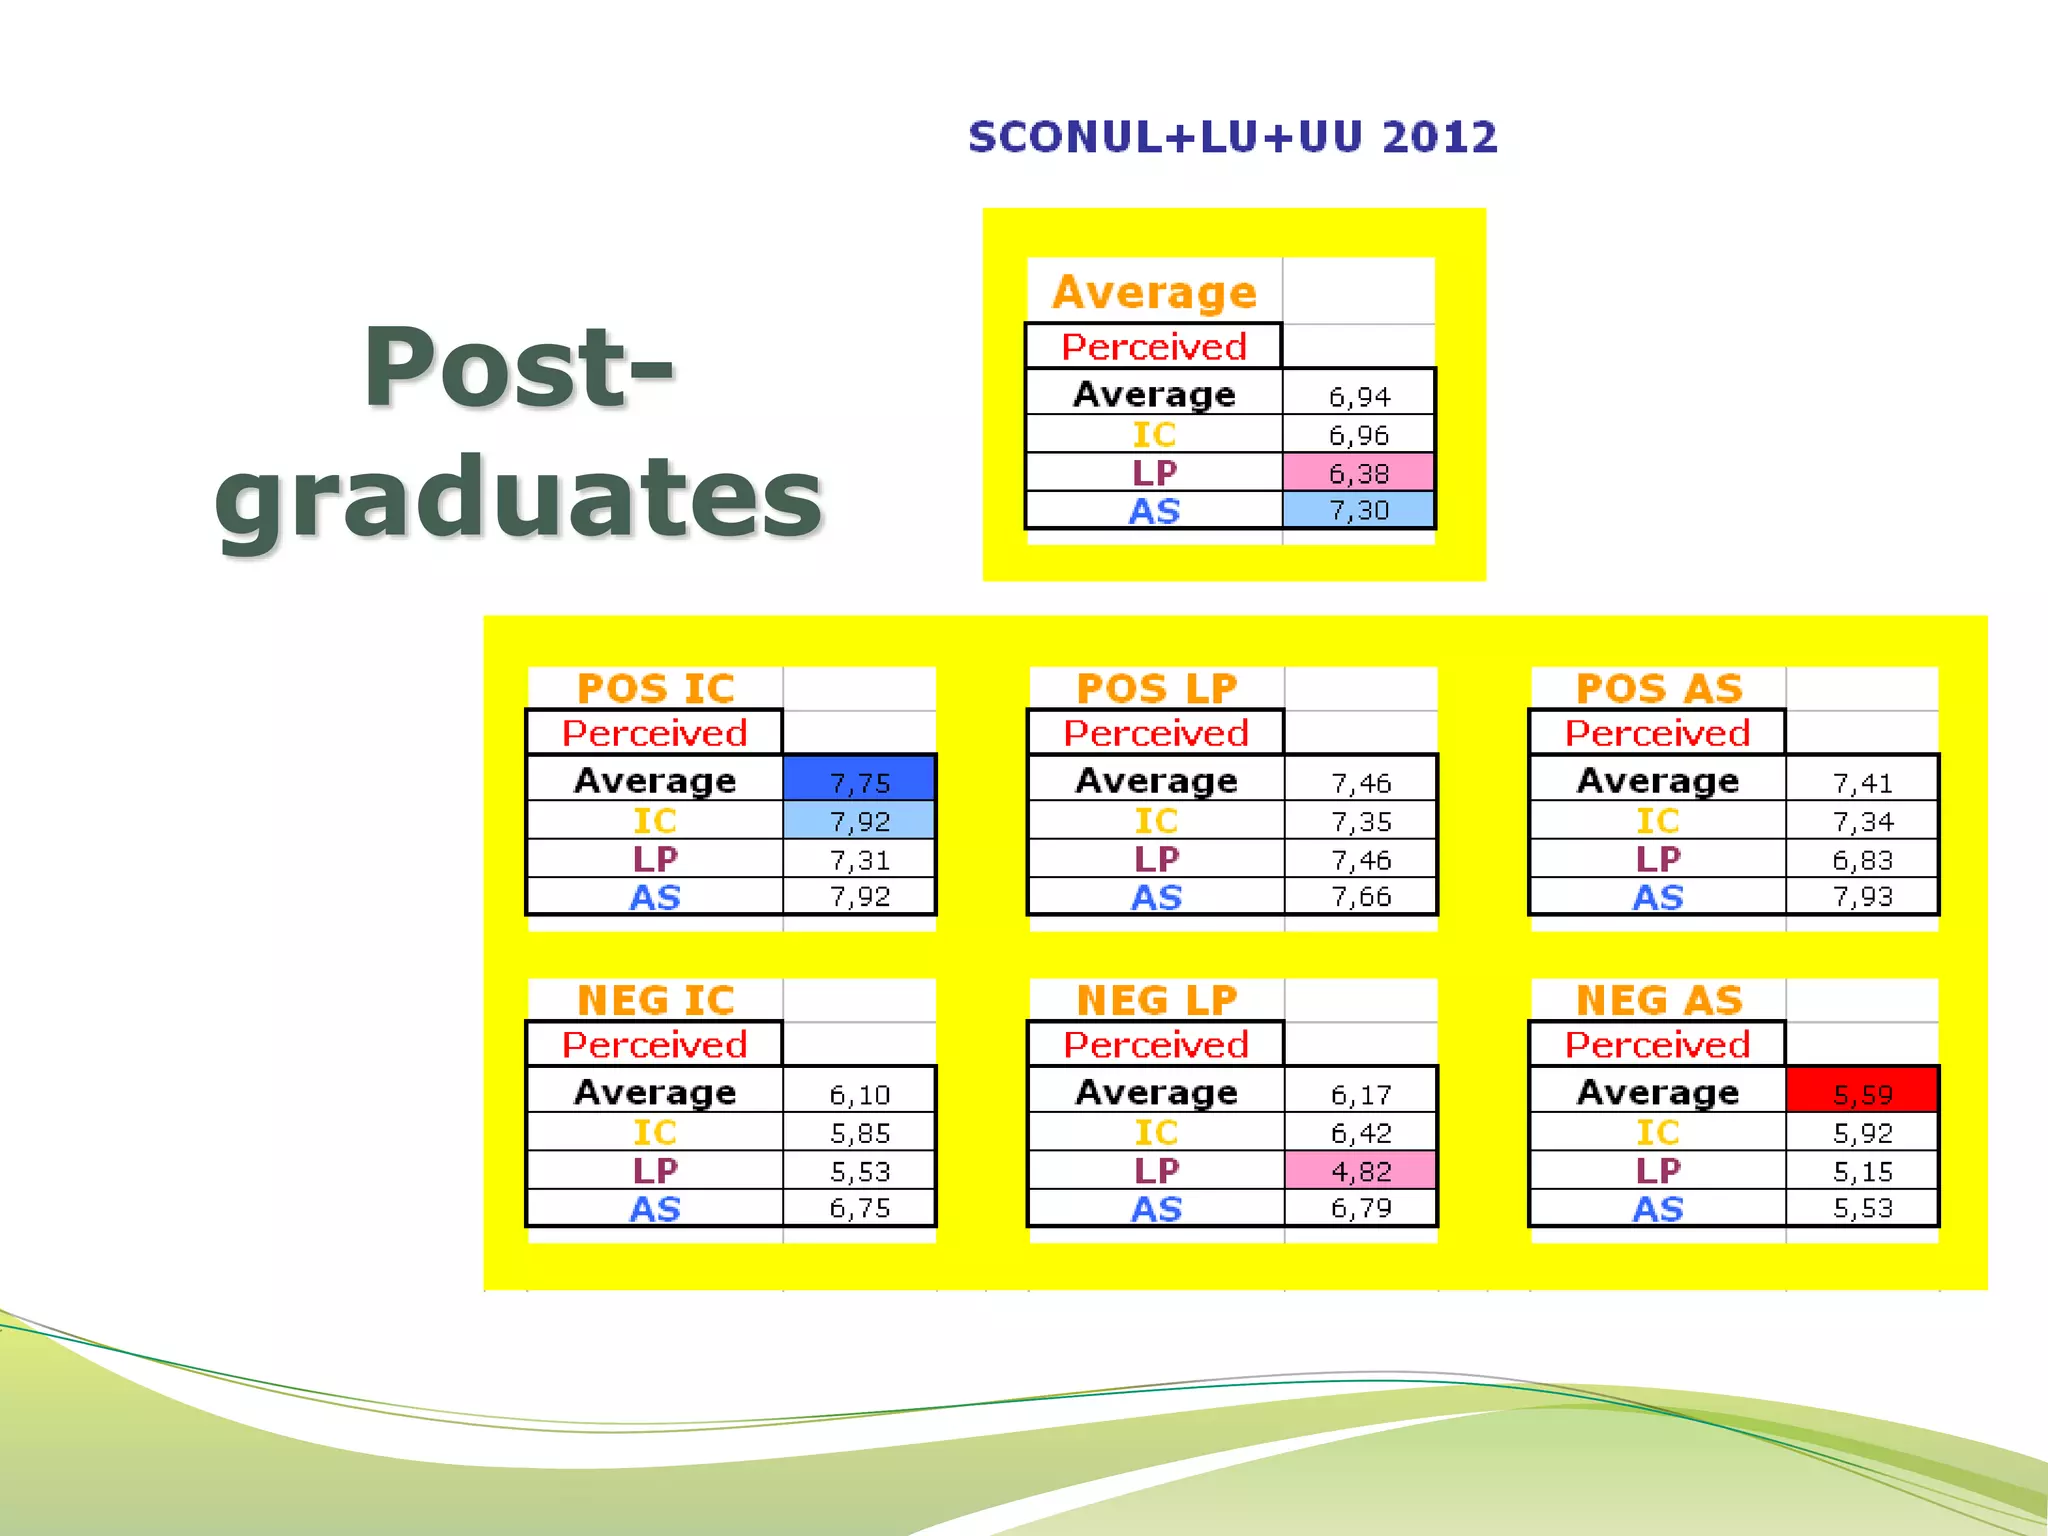
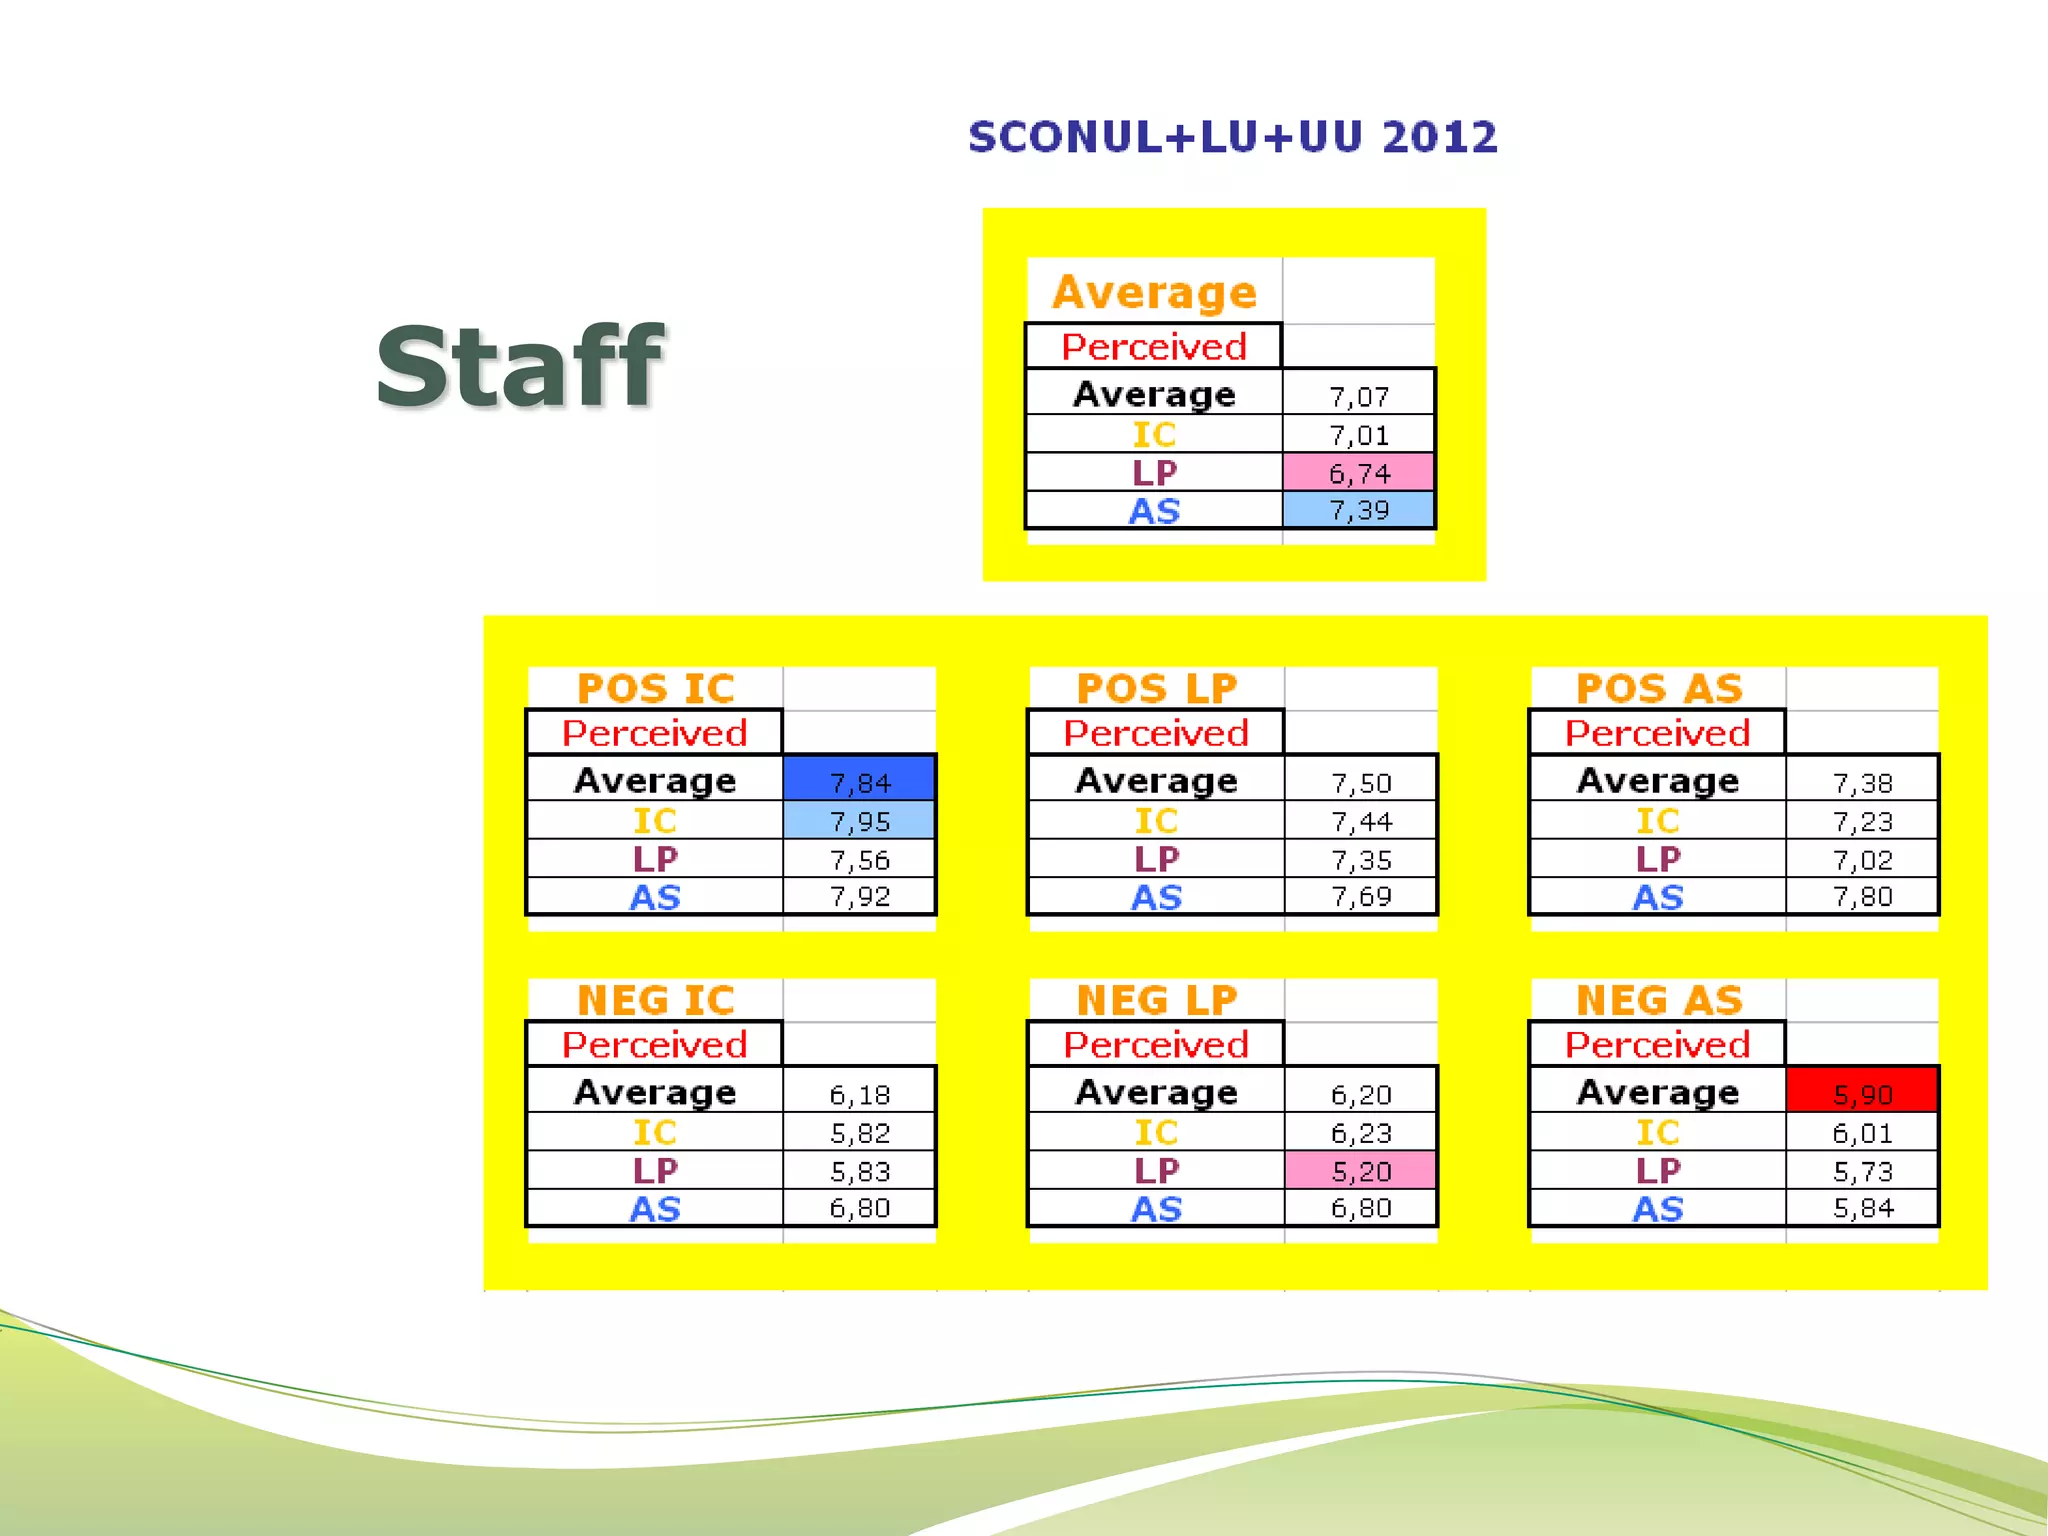
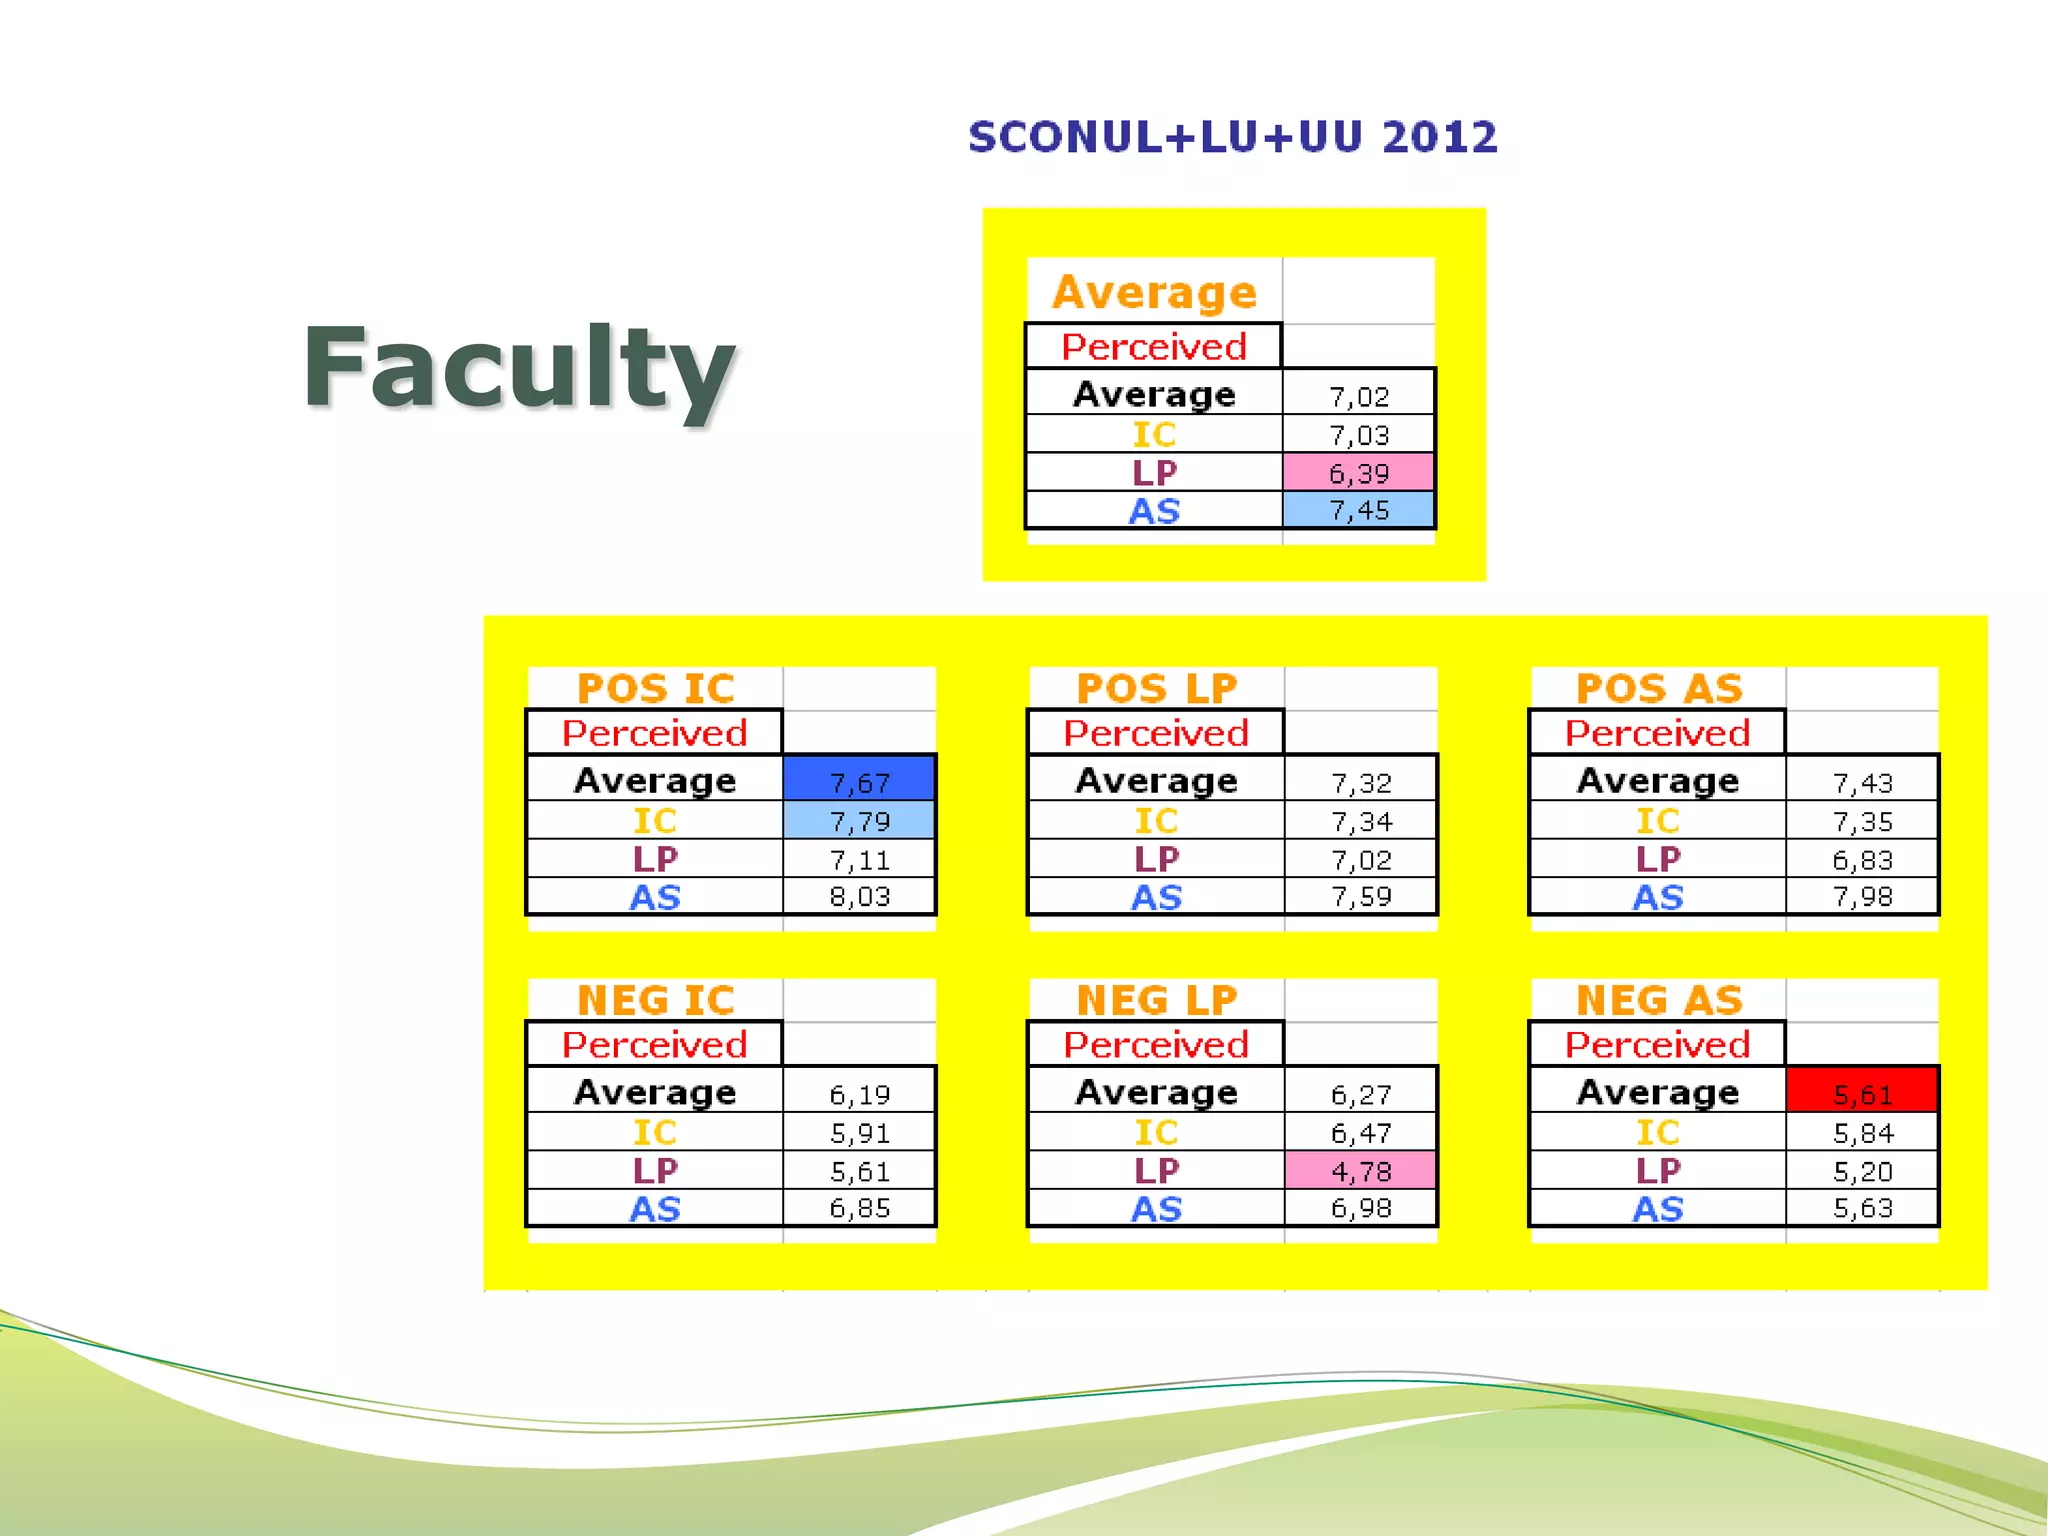
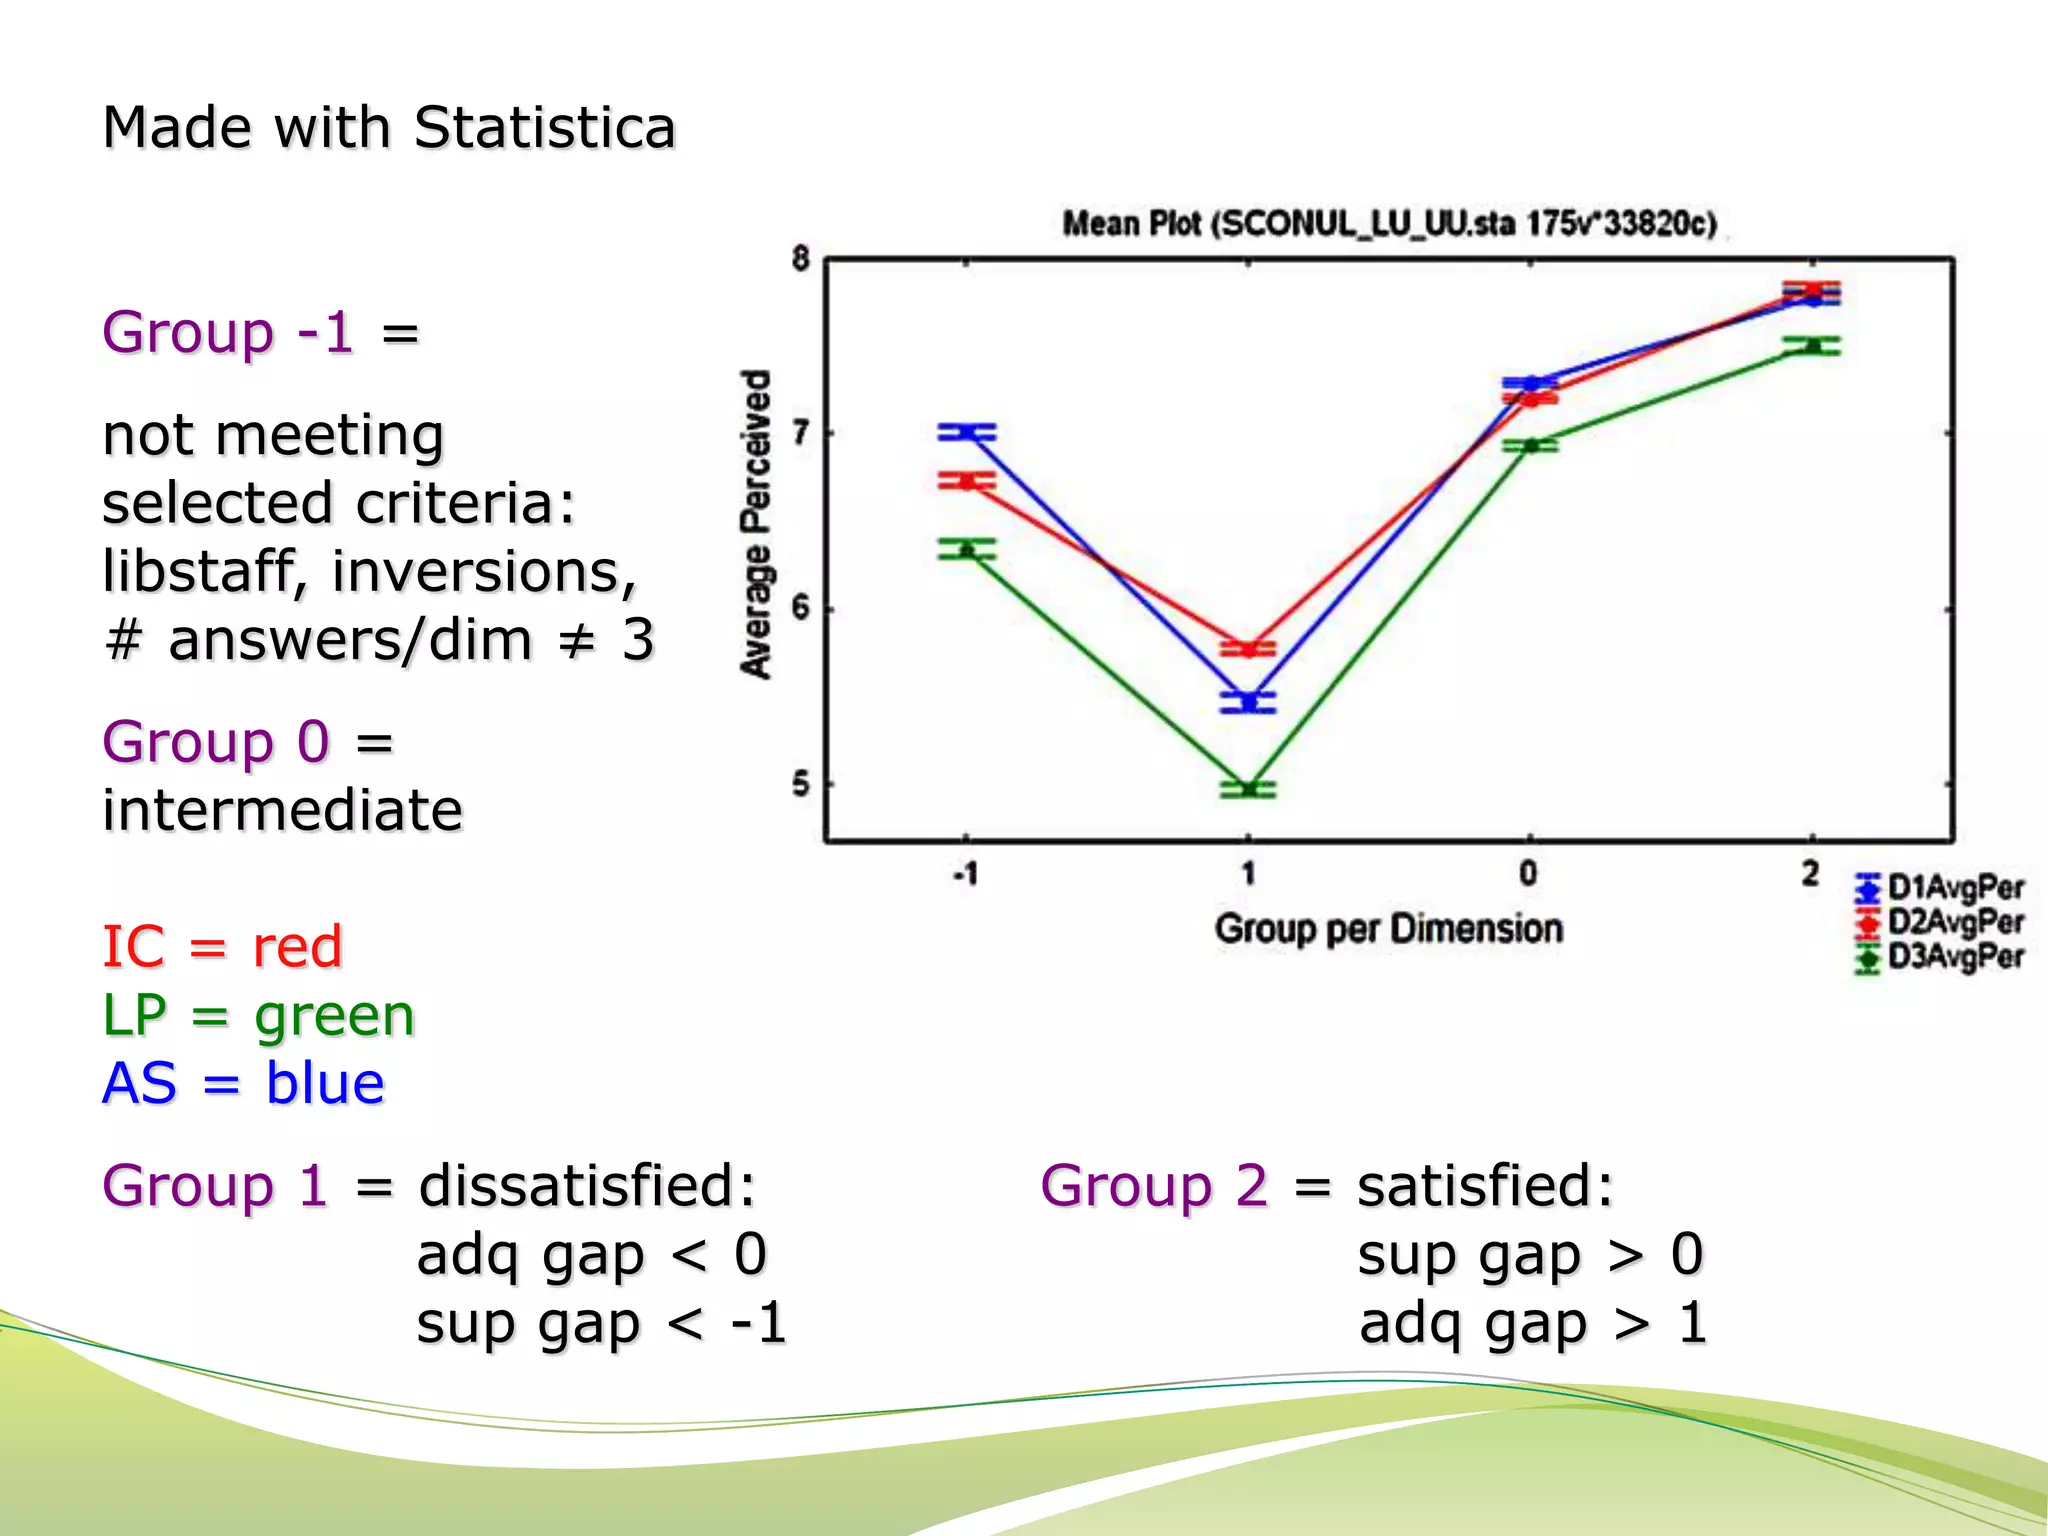
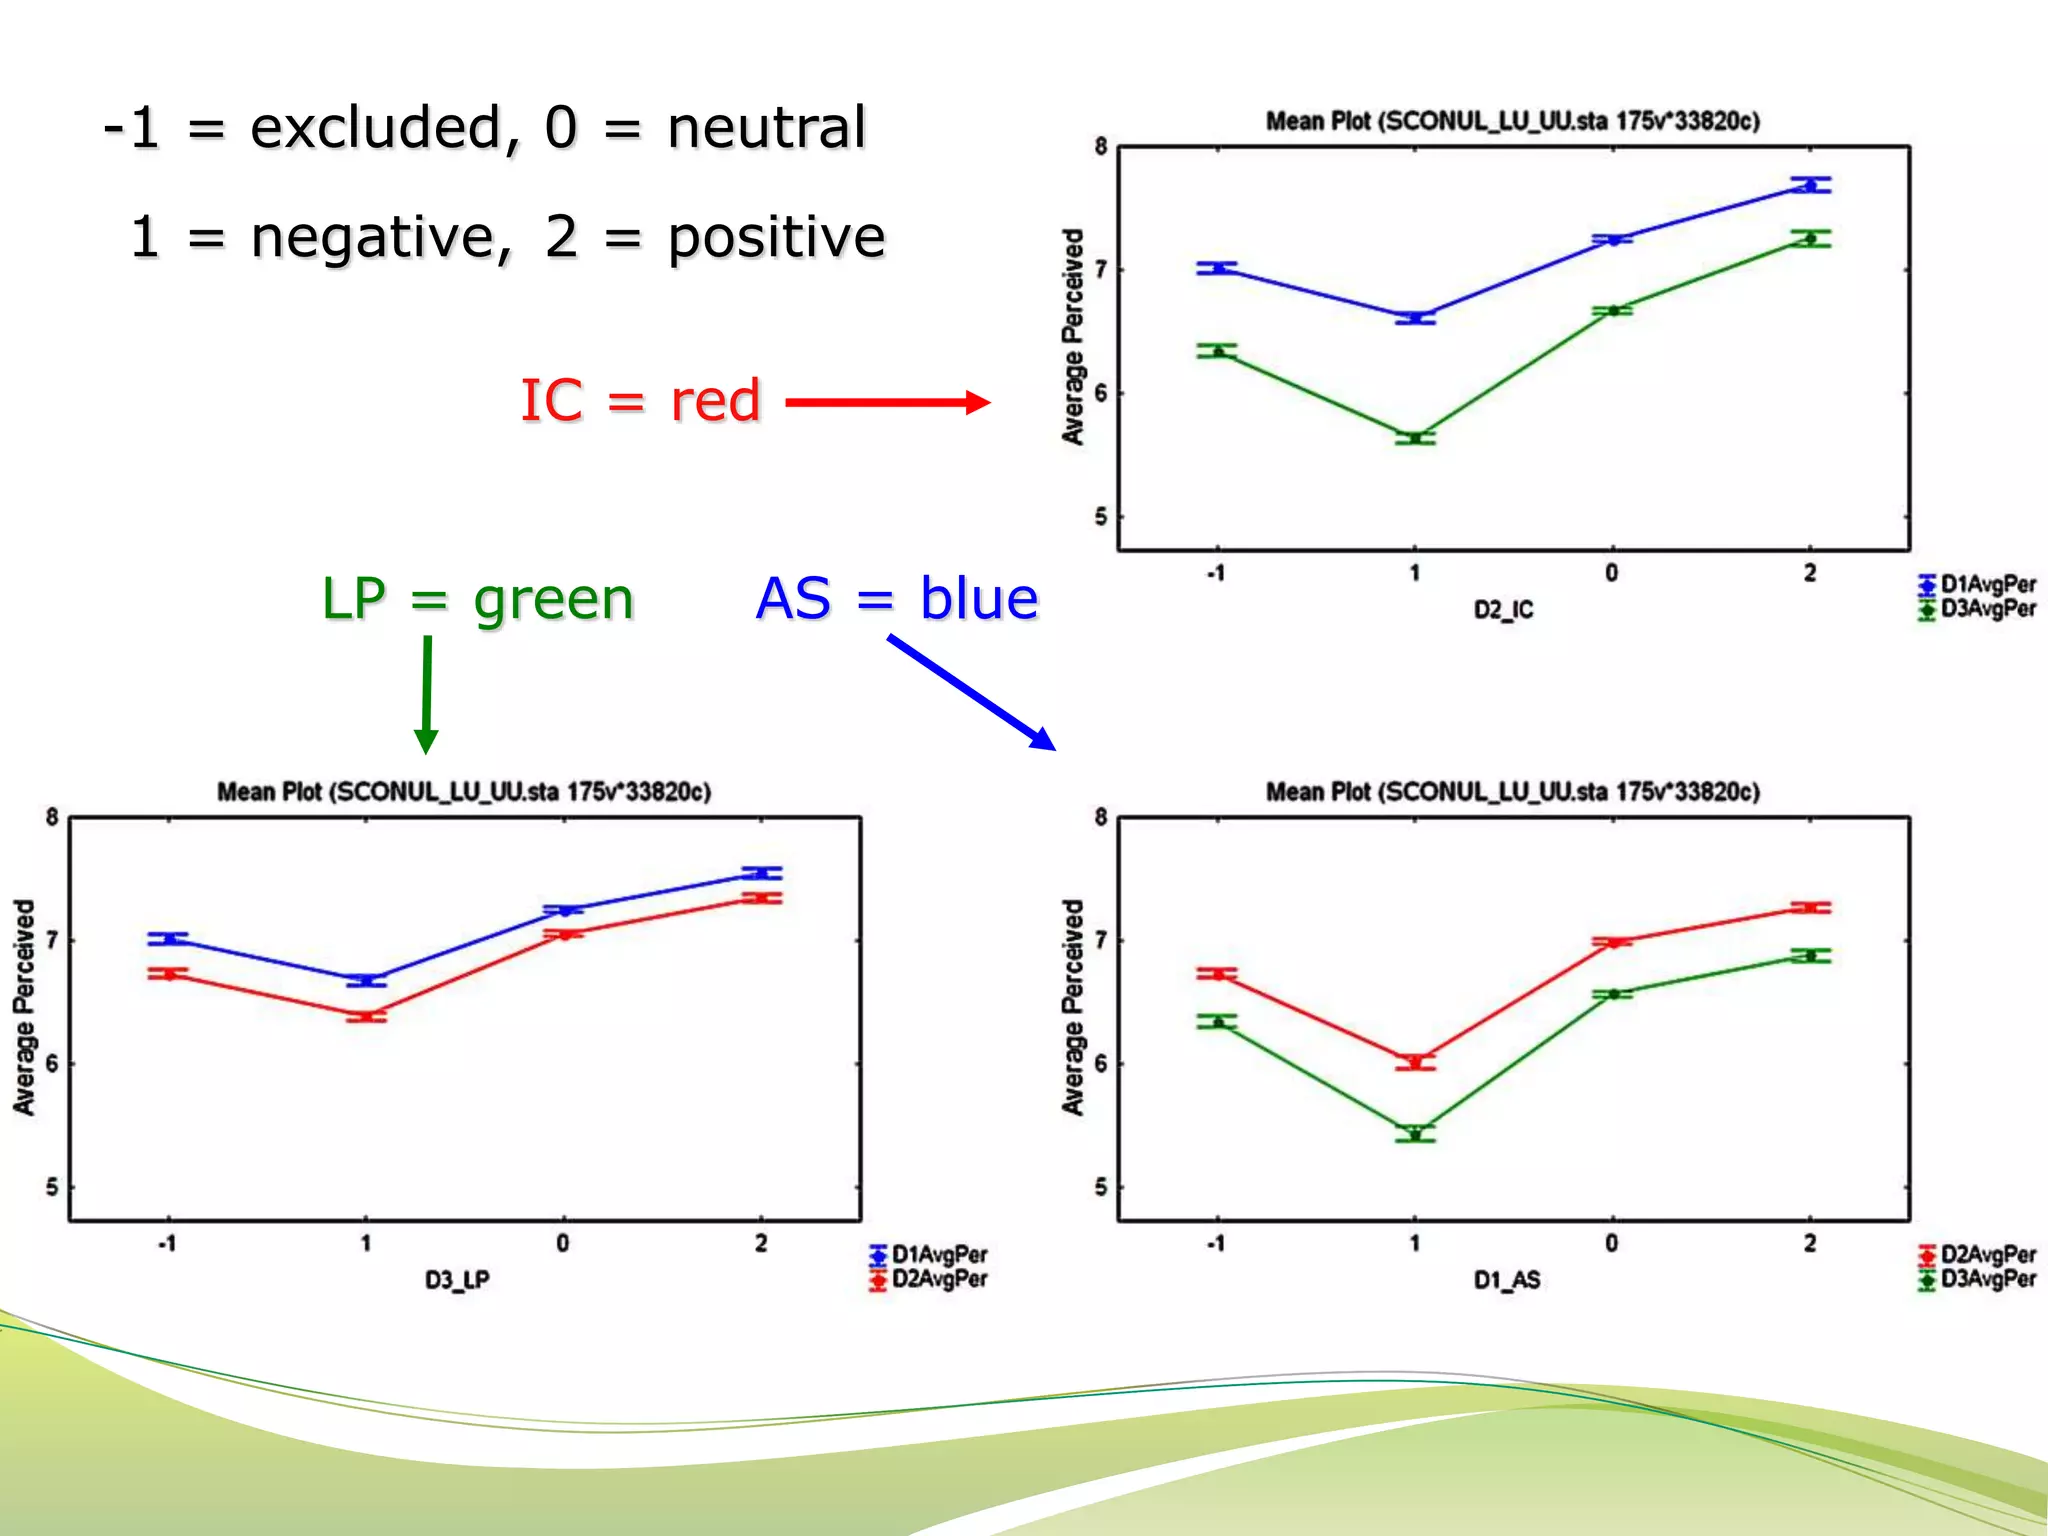
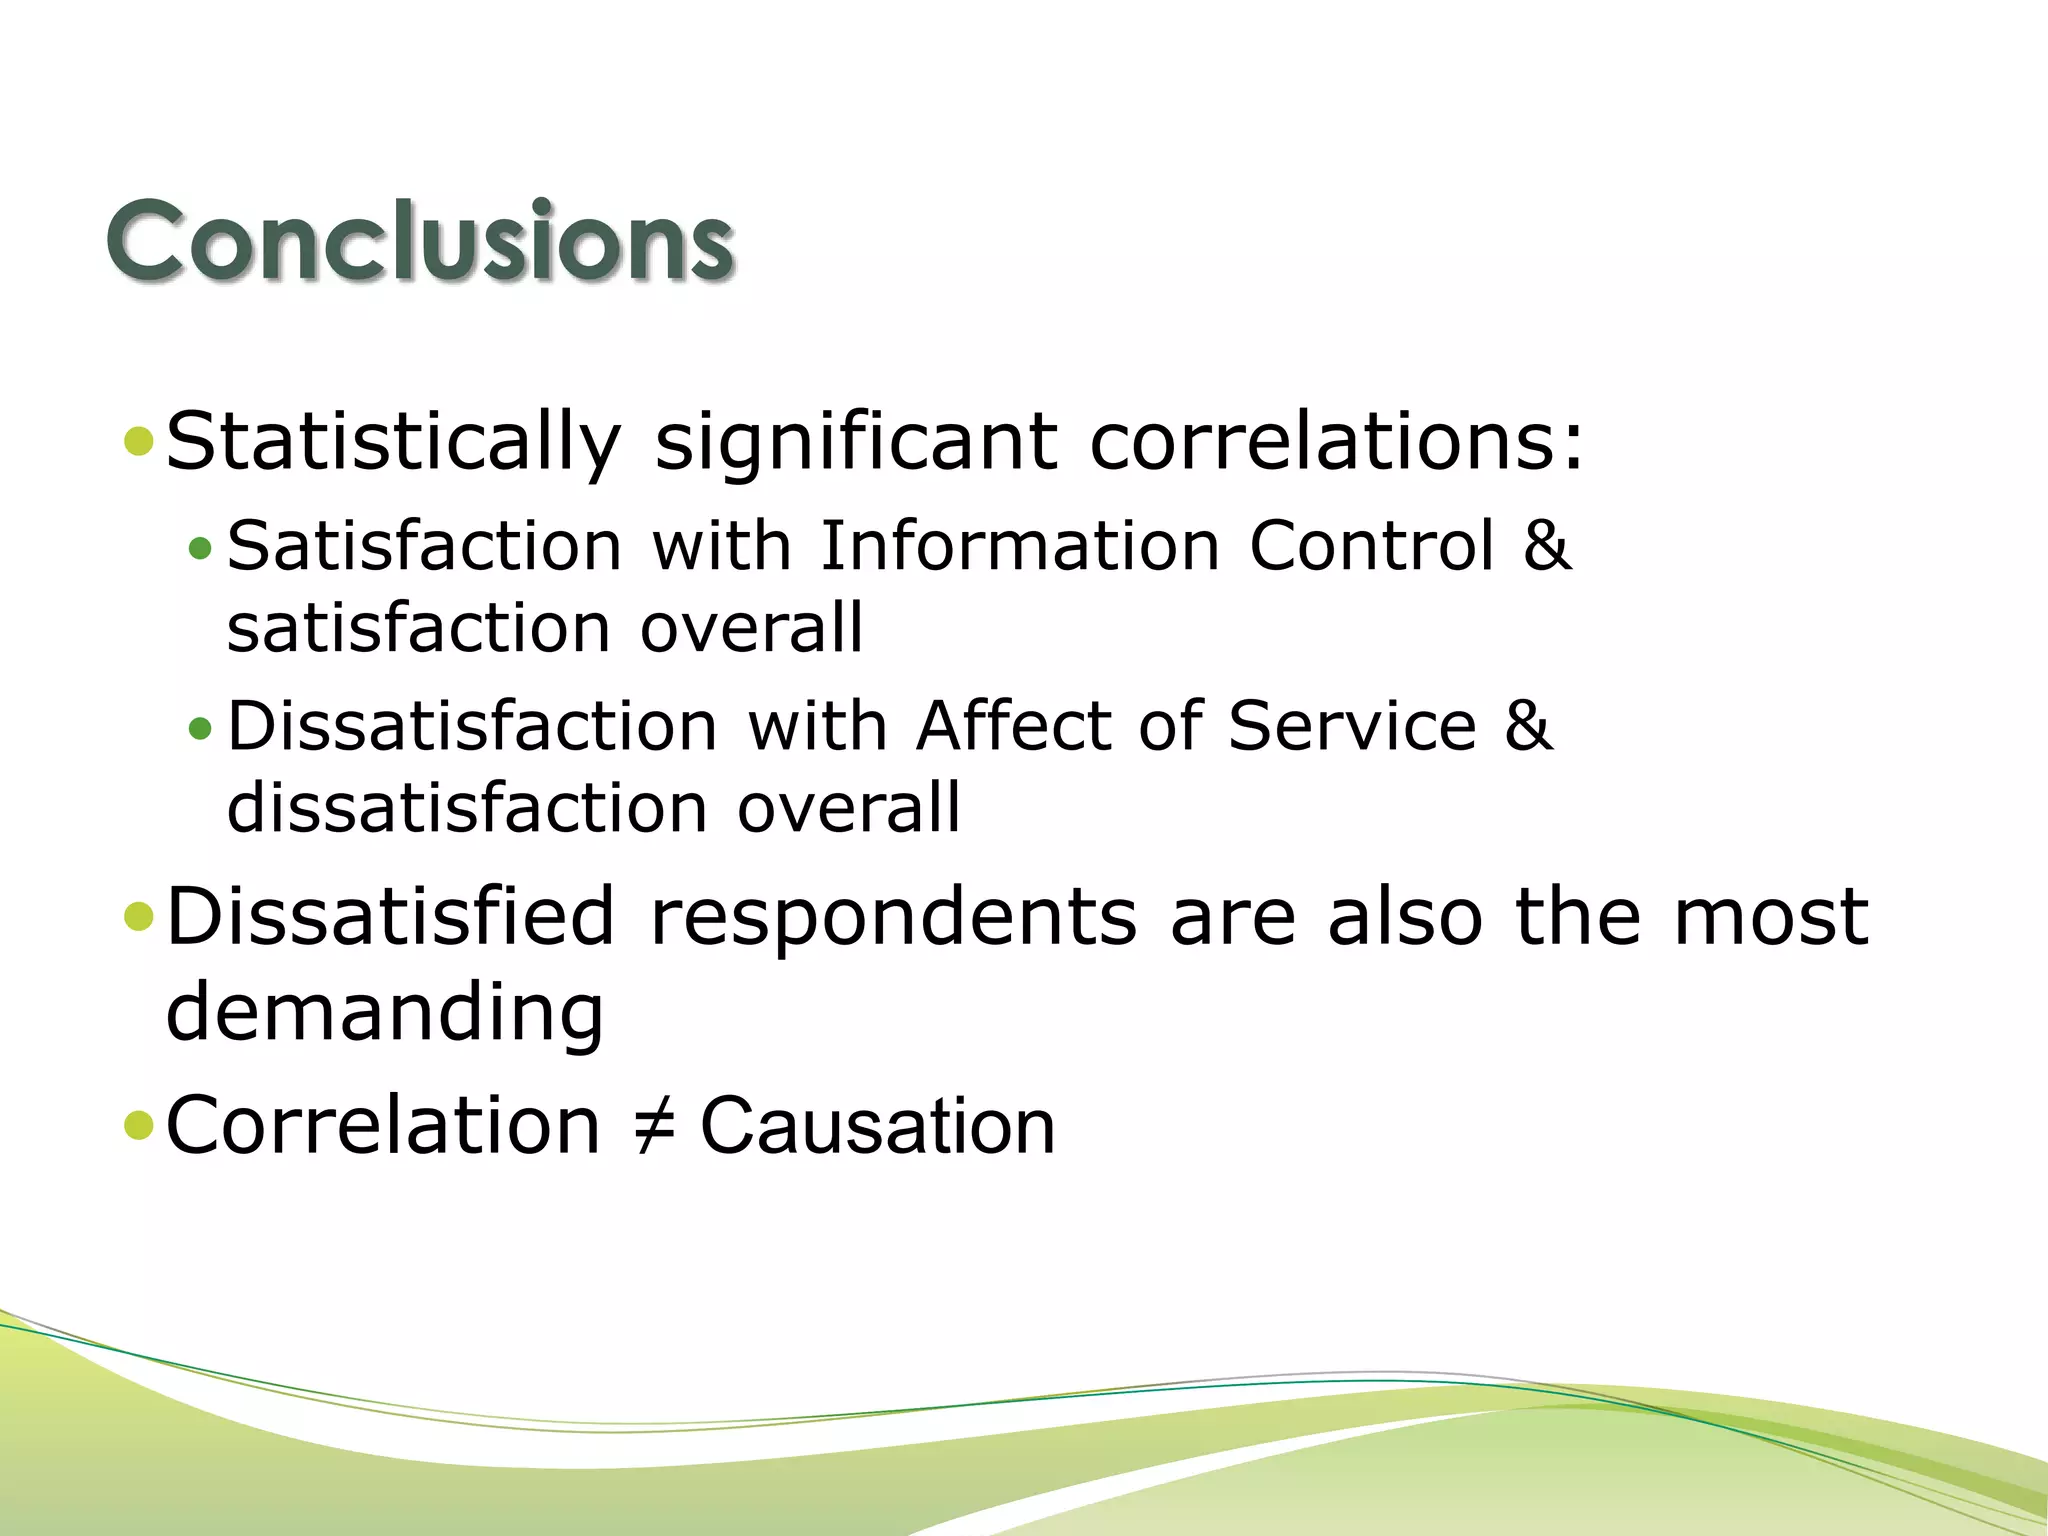


The document discusses the use of the LIBQUAL+® survey to assess customer satisfaction across multiple universities, highlighting distinct dimensions like information control and the library as a place. Findings reveal statistically significant correlations between overall satisfaction and factors like information control, while also indicating that dissatisfied respondents tend to be more demanding. The research involved a large sample size and examines the satisfaction levels of various groups including students and faculty.


