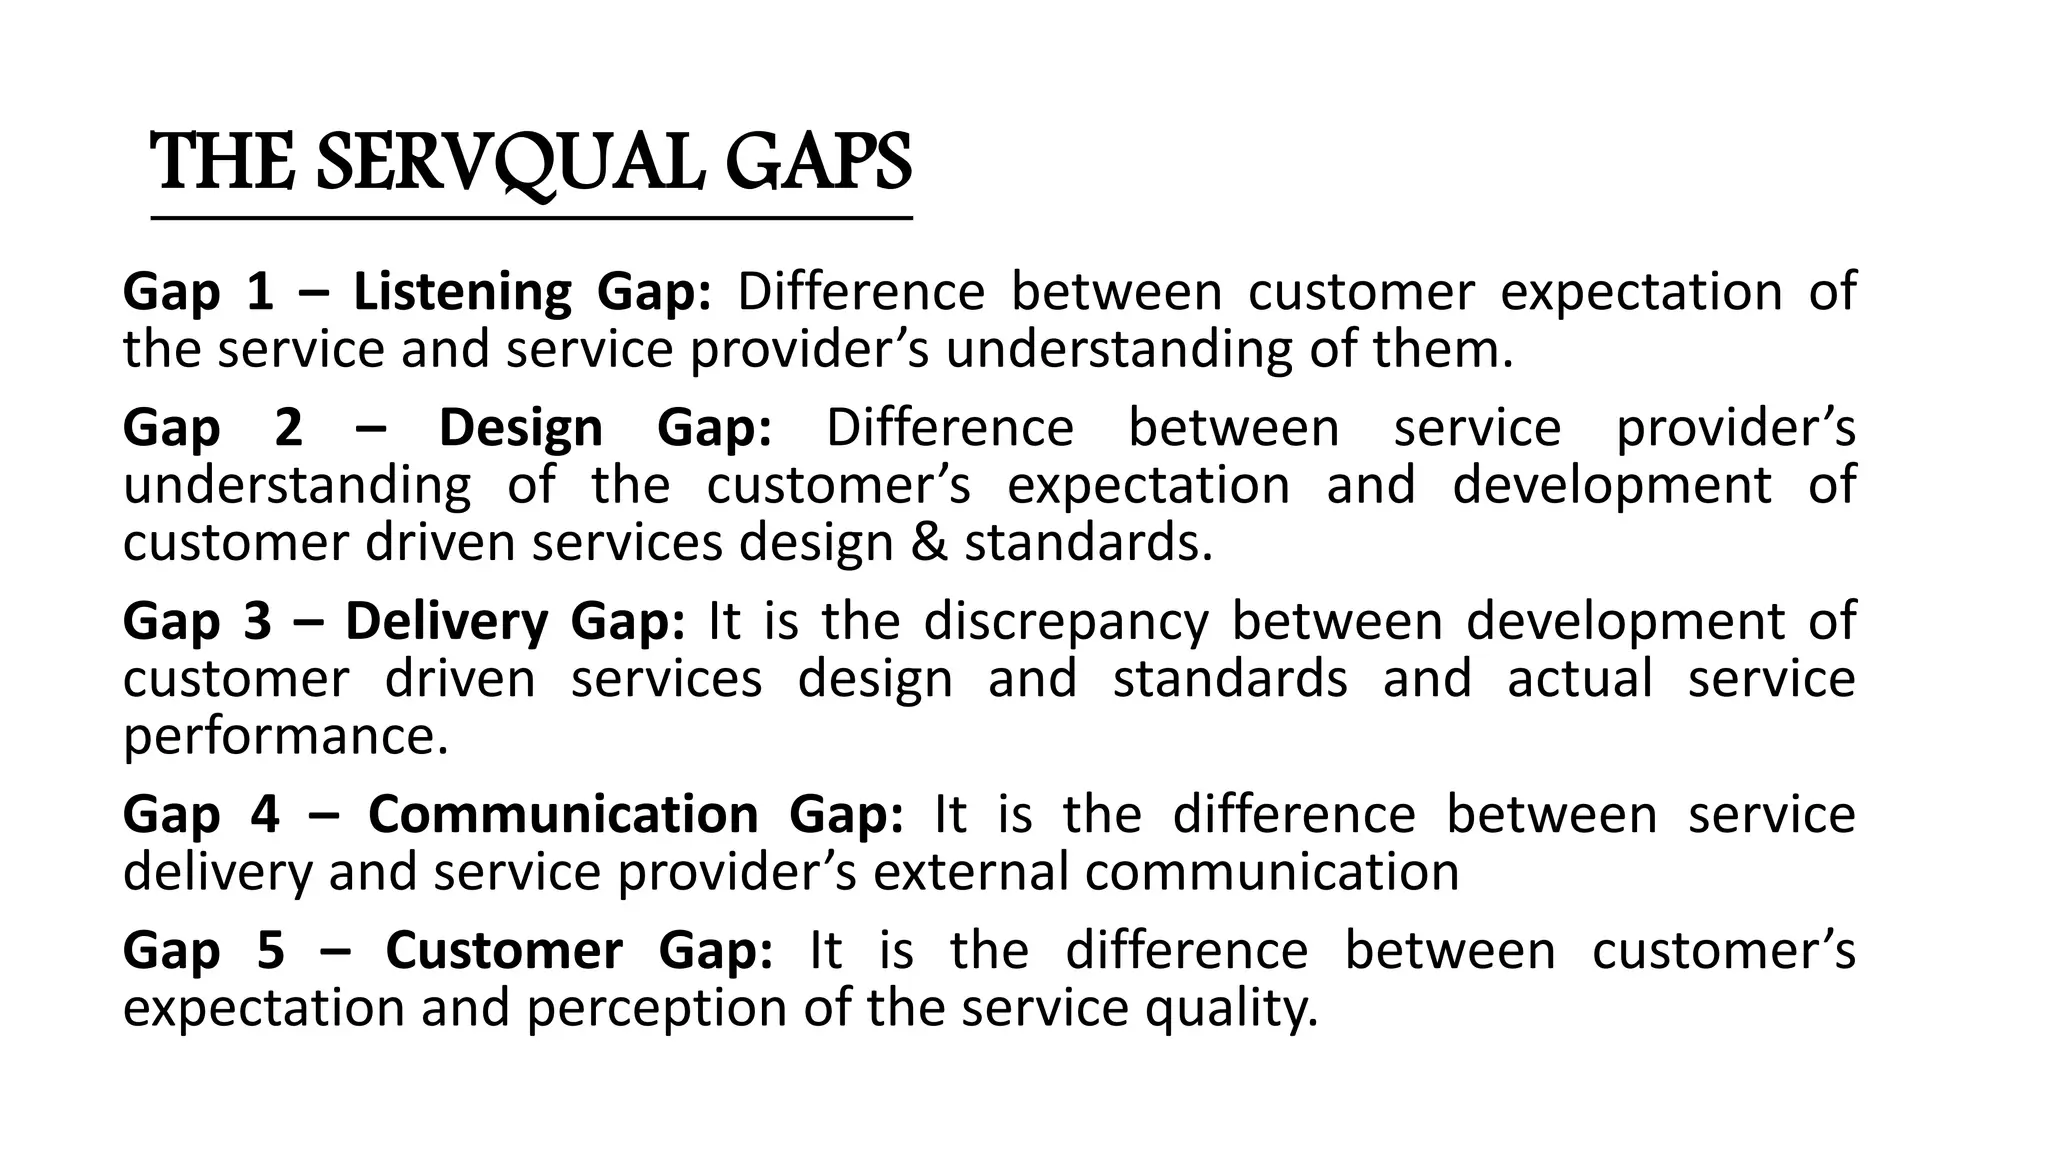
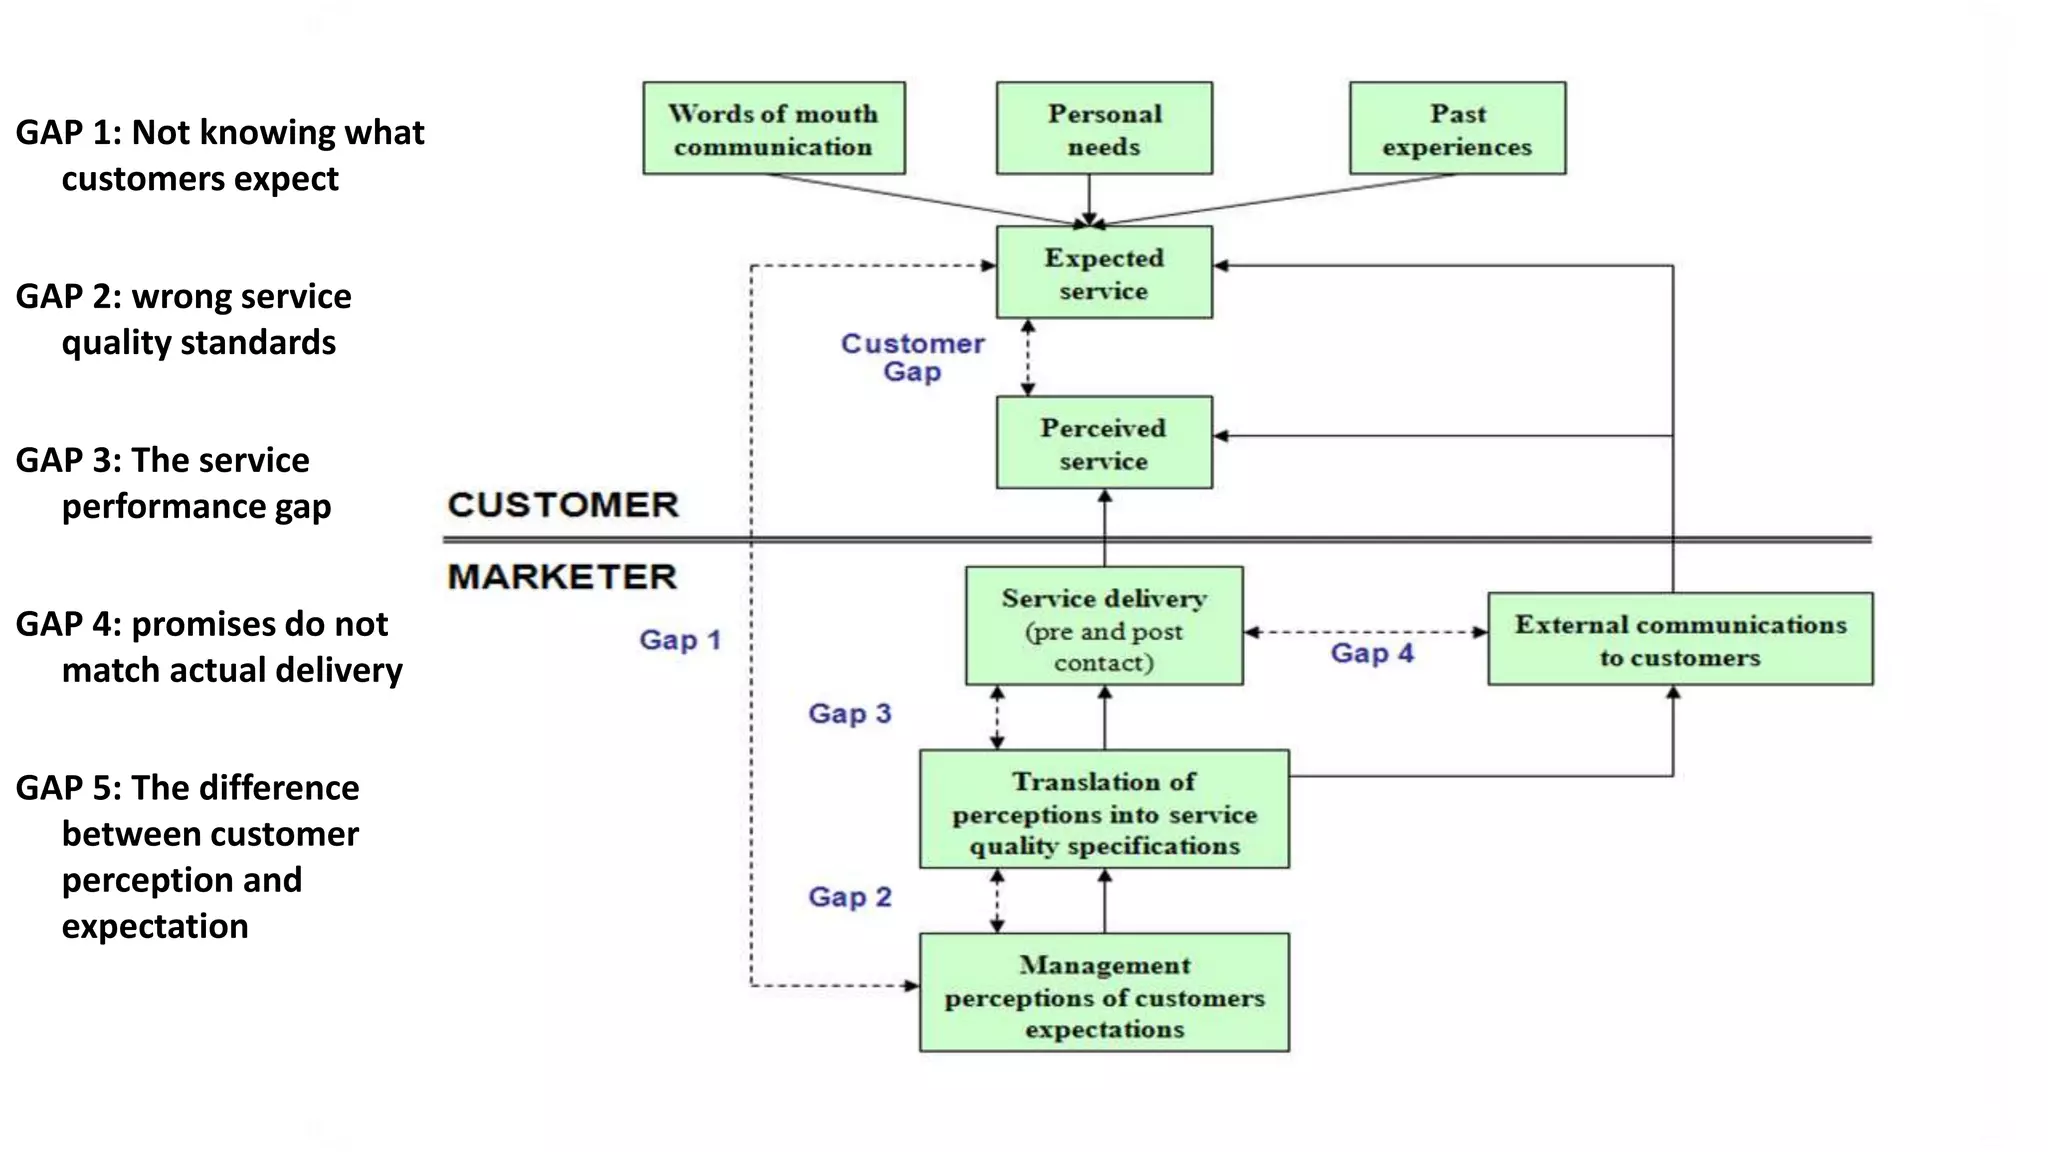
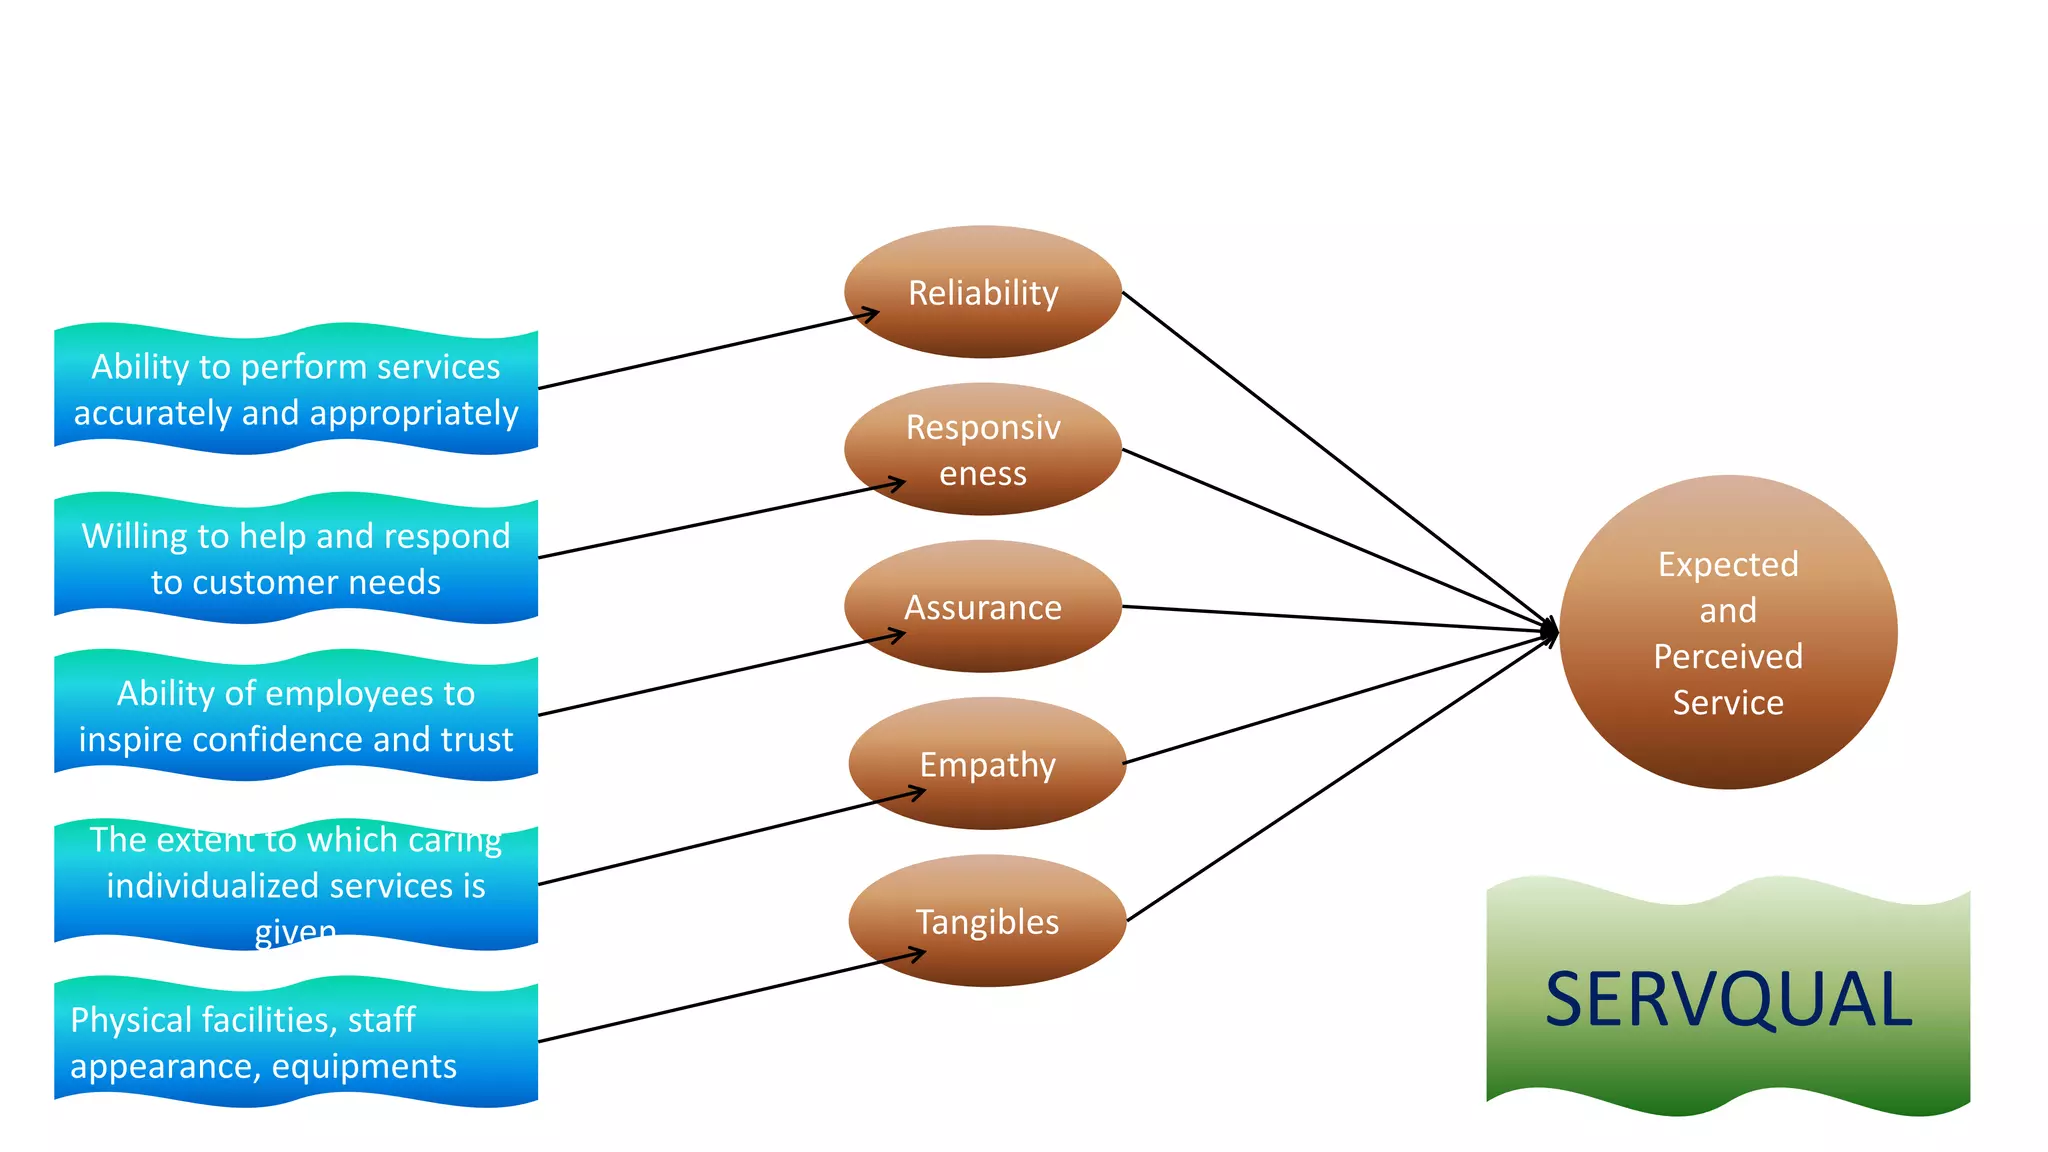
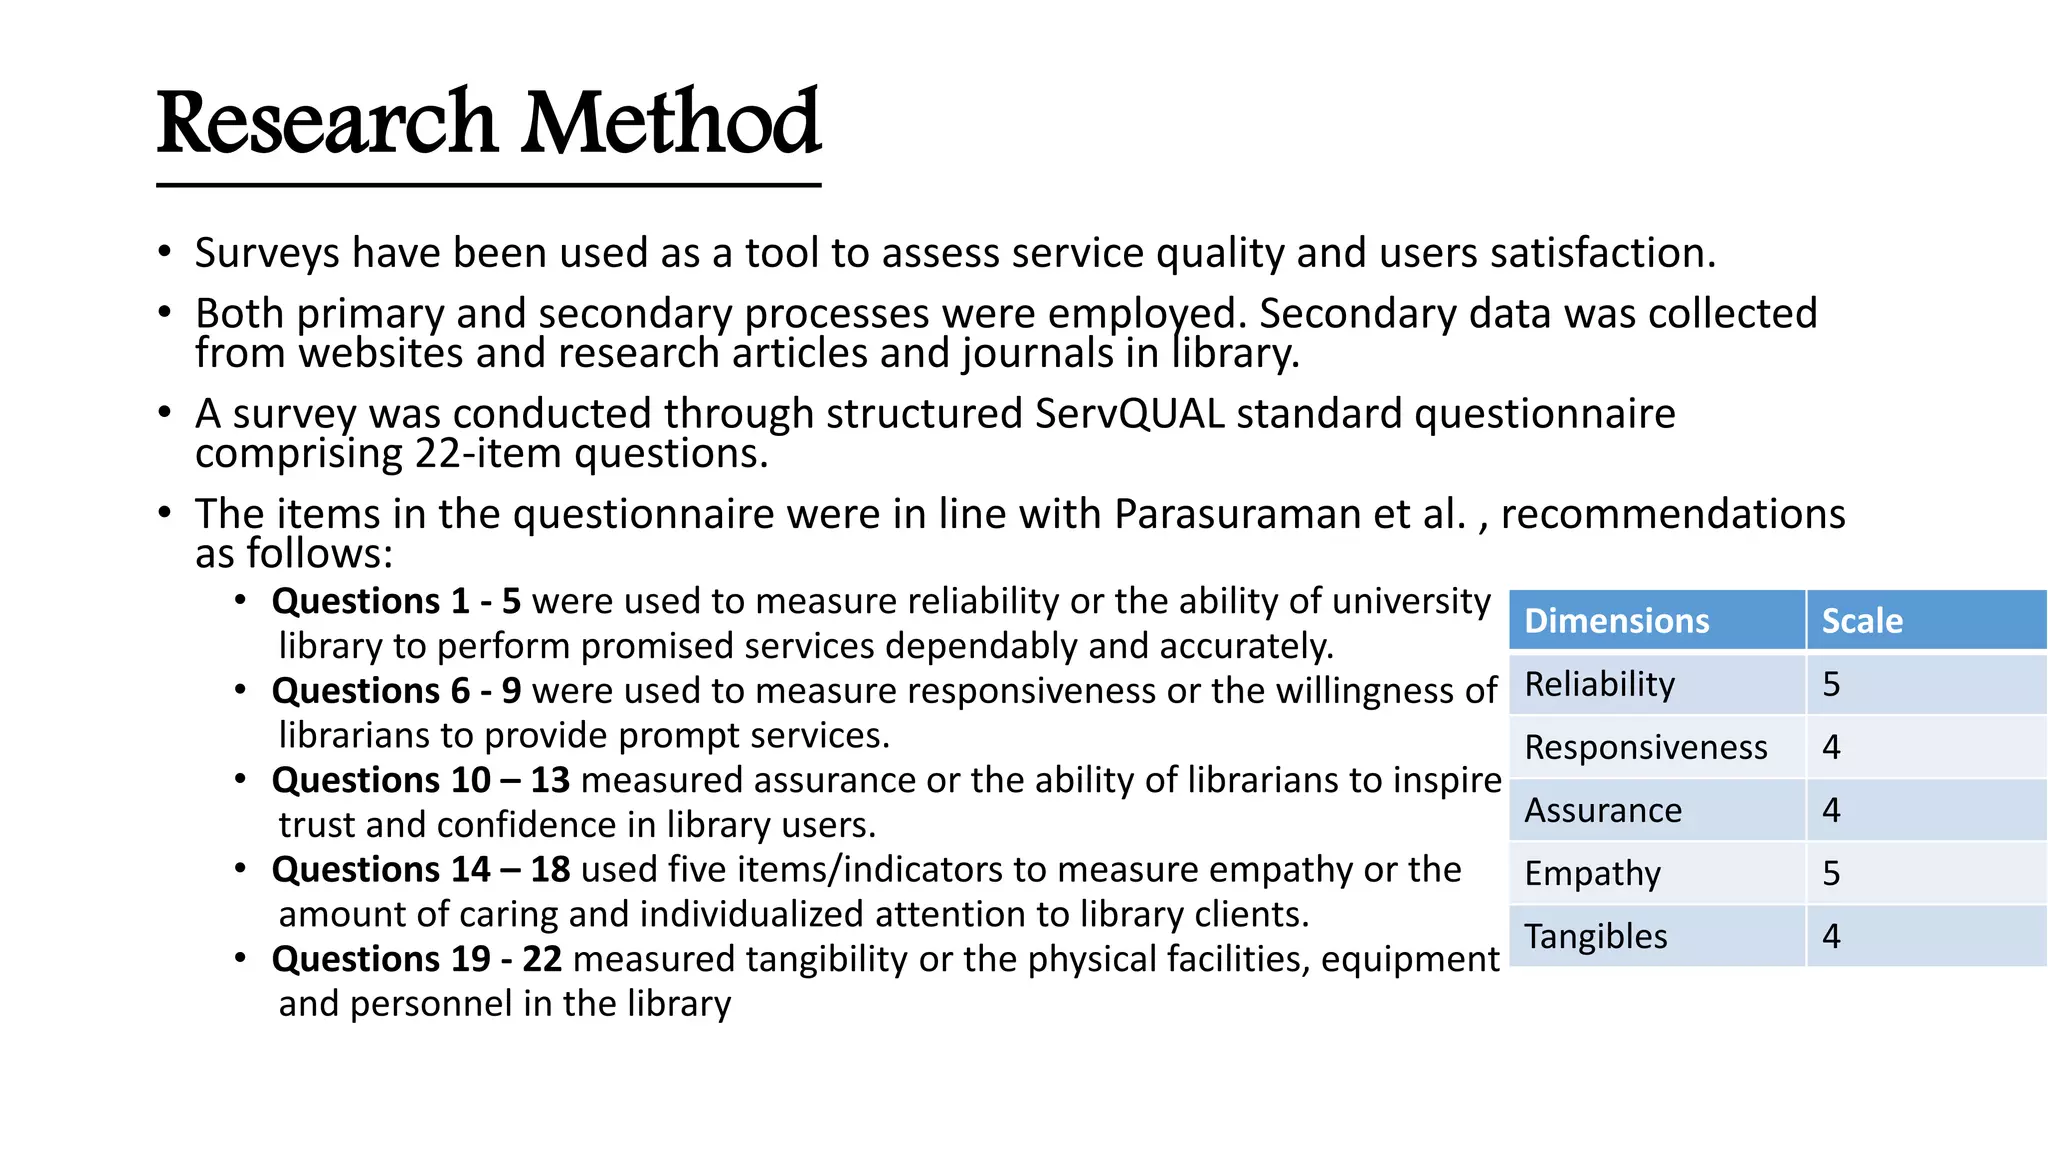
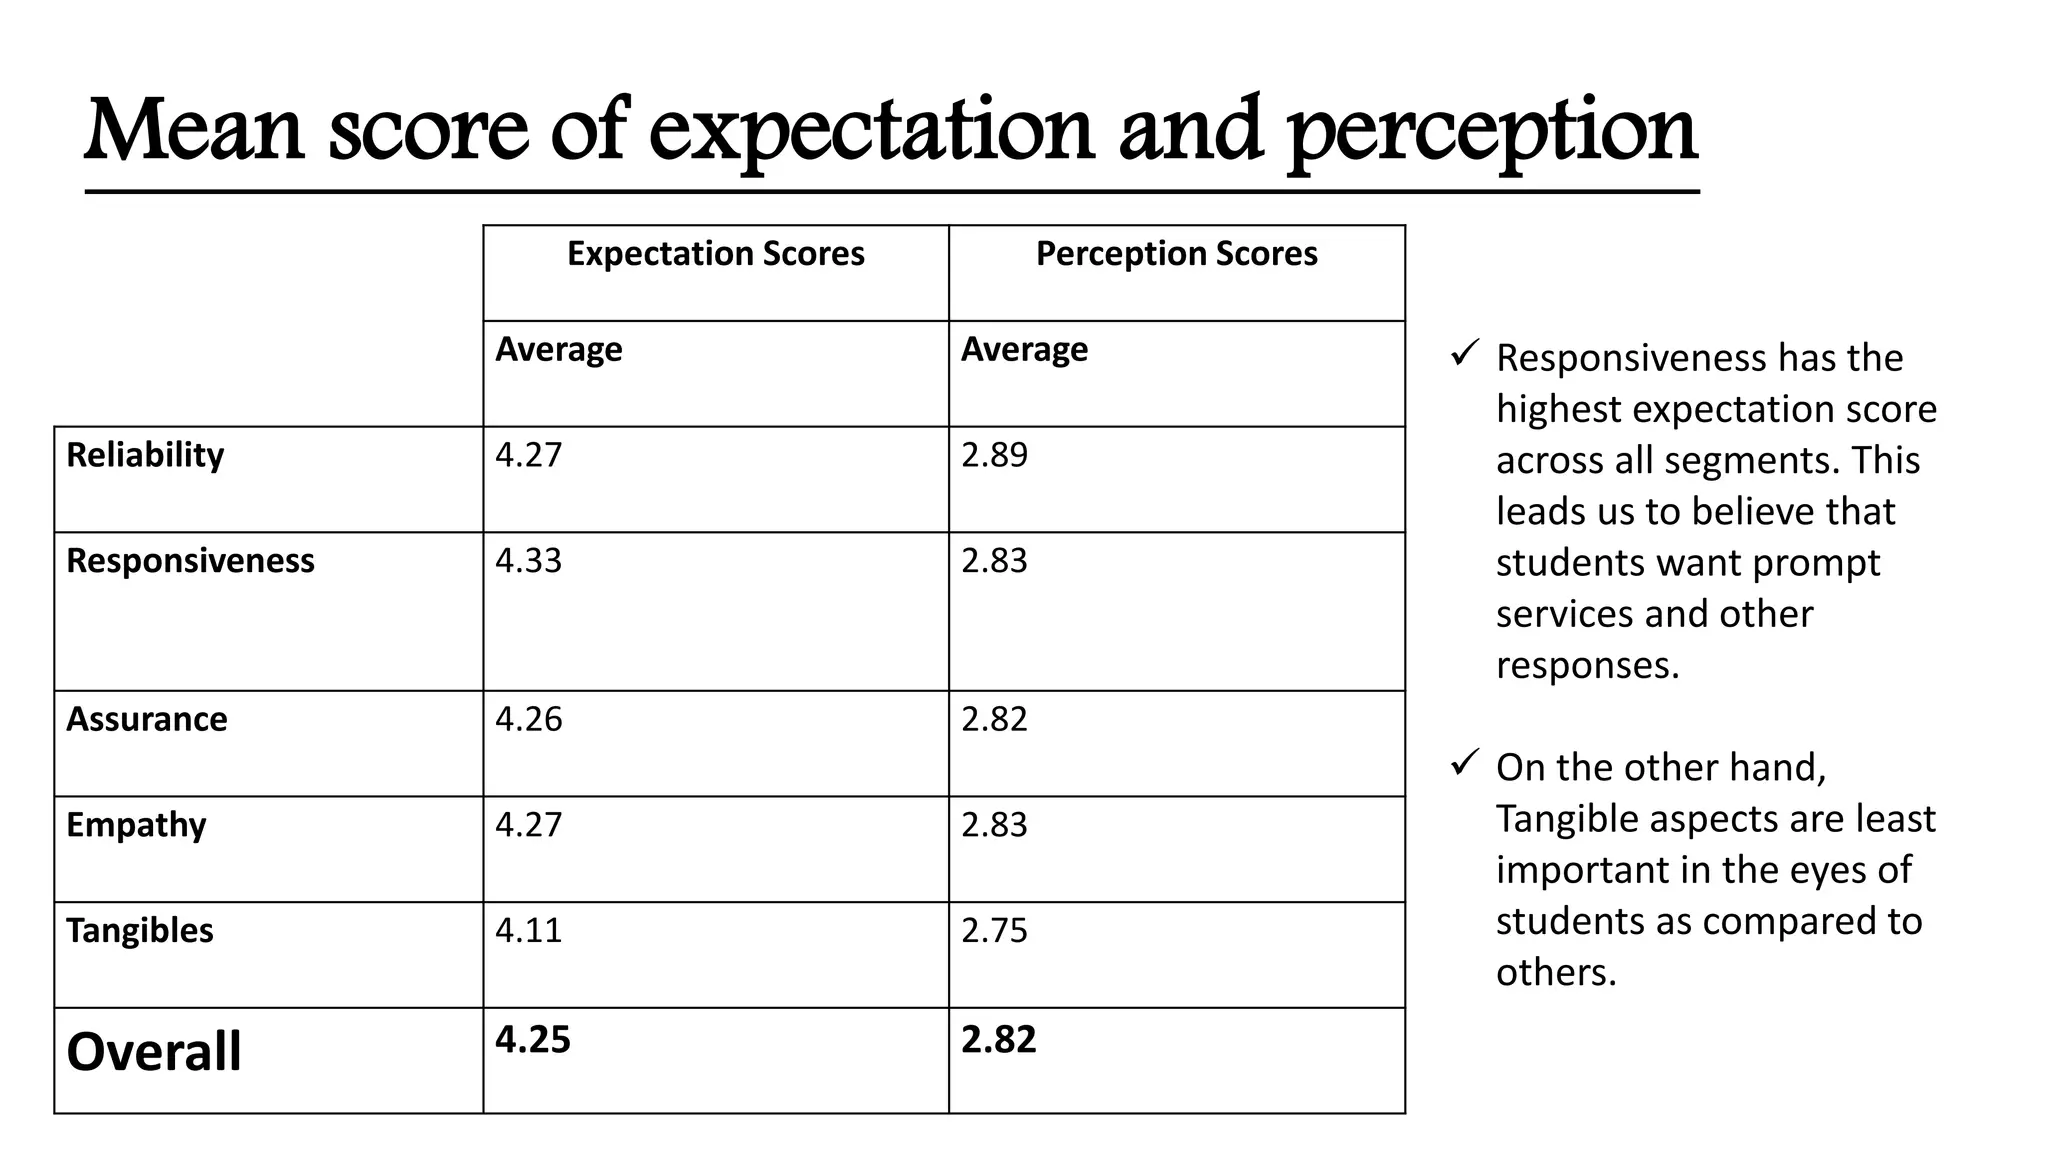
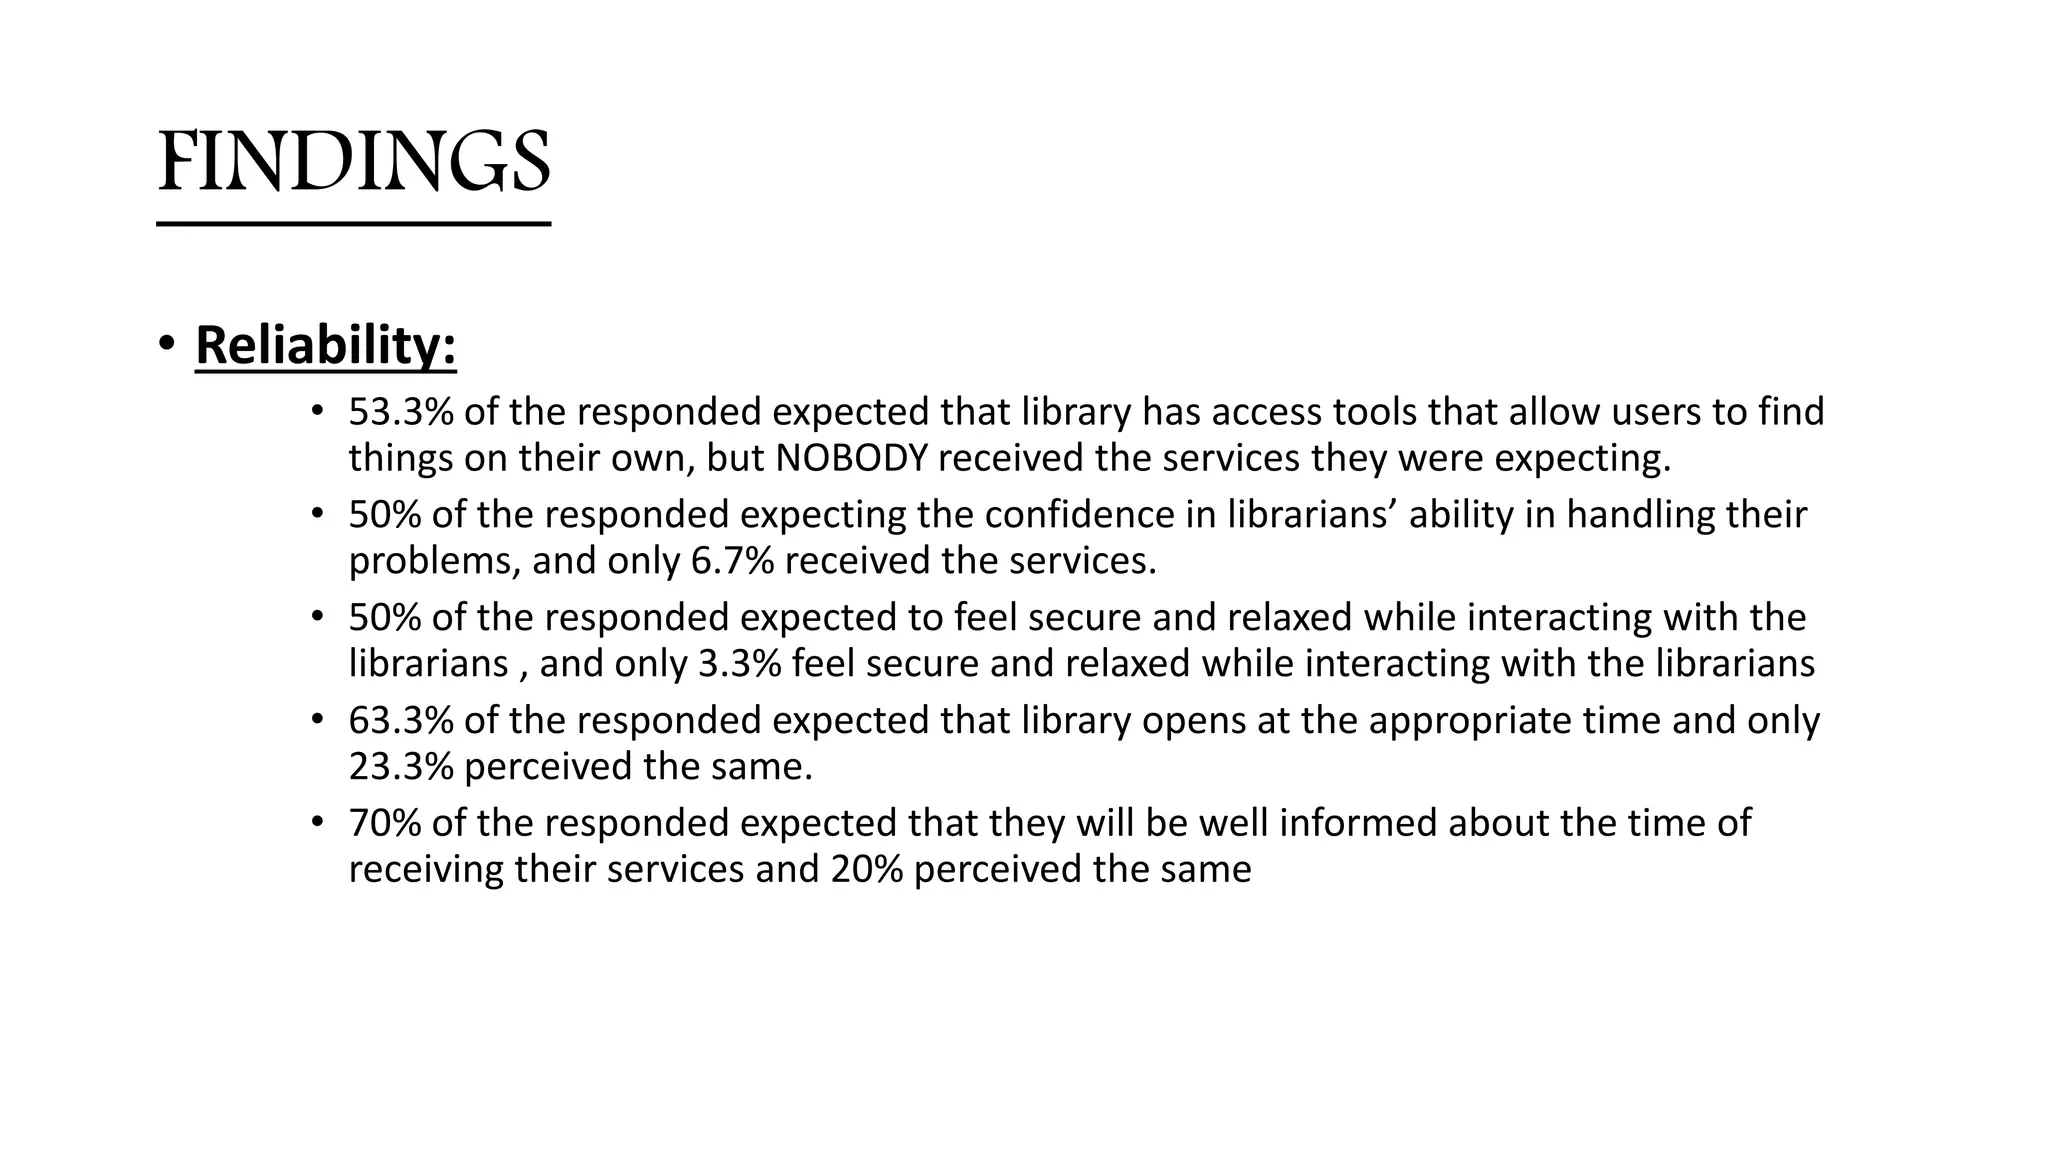
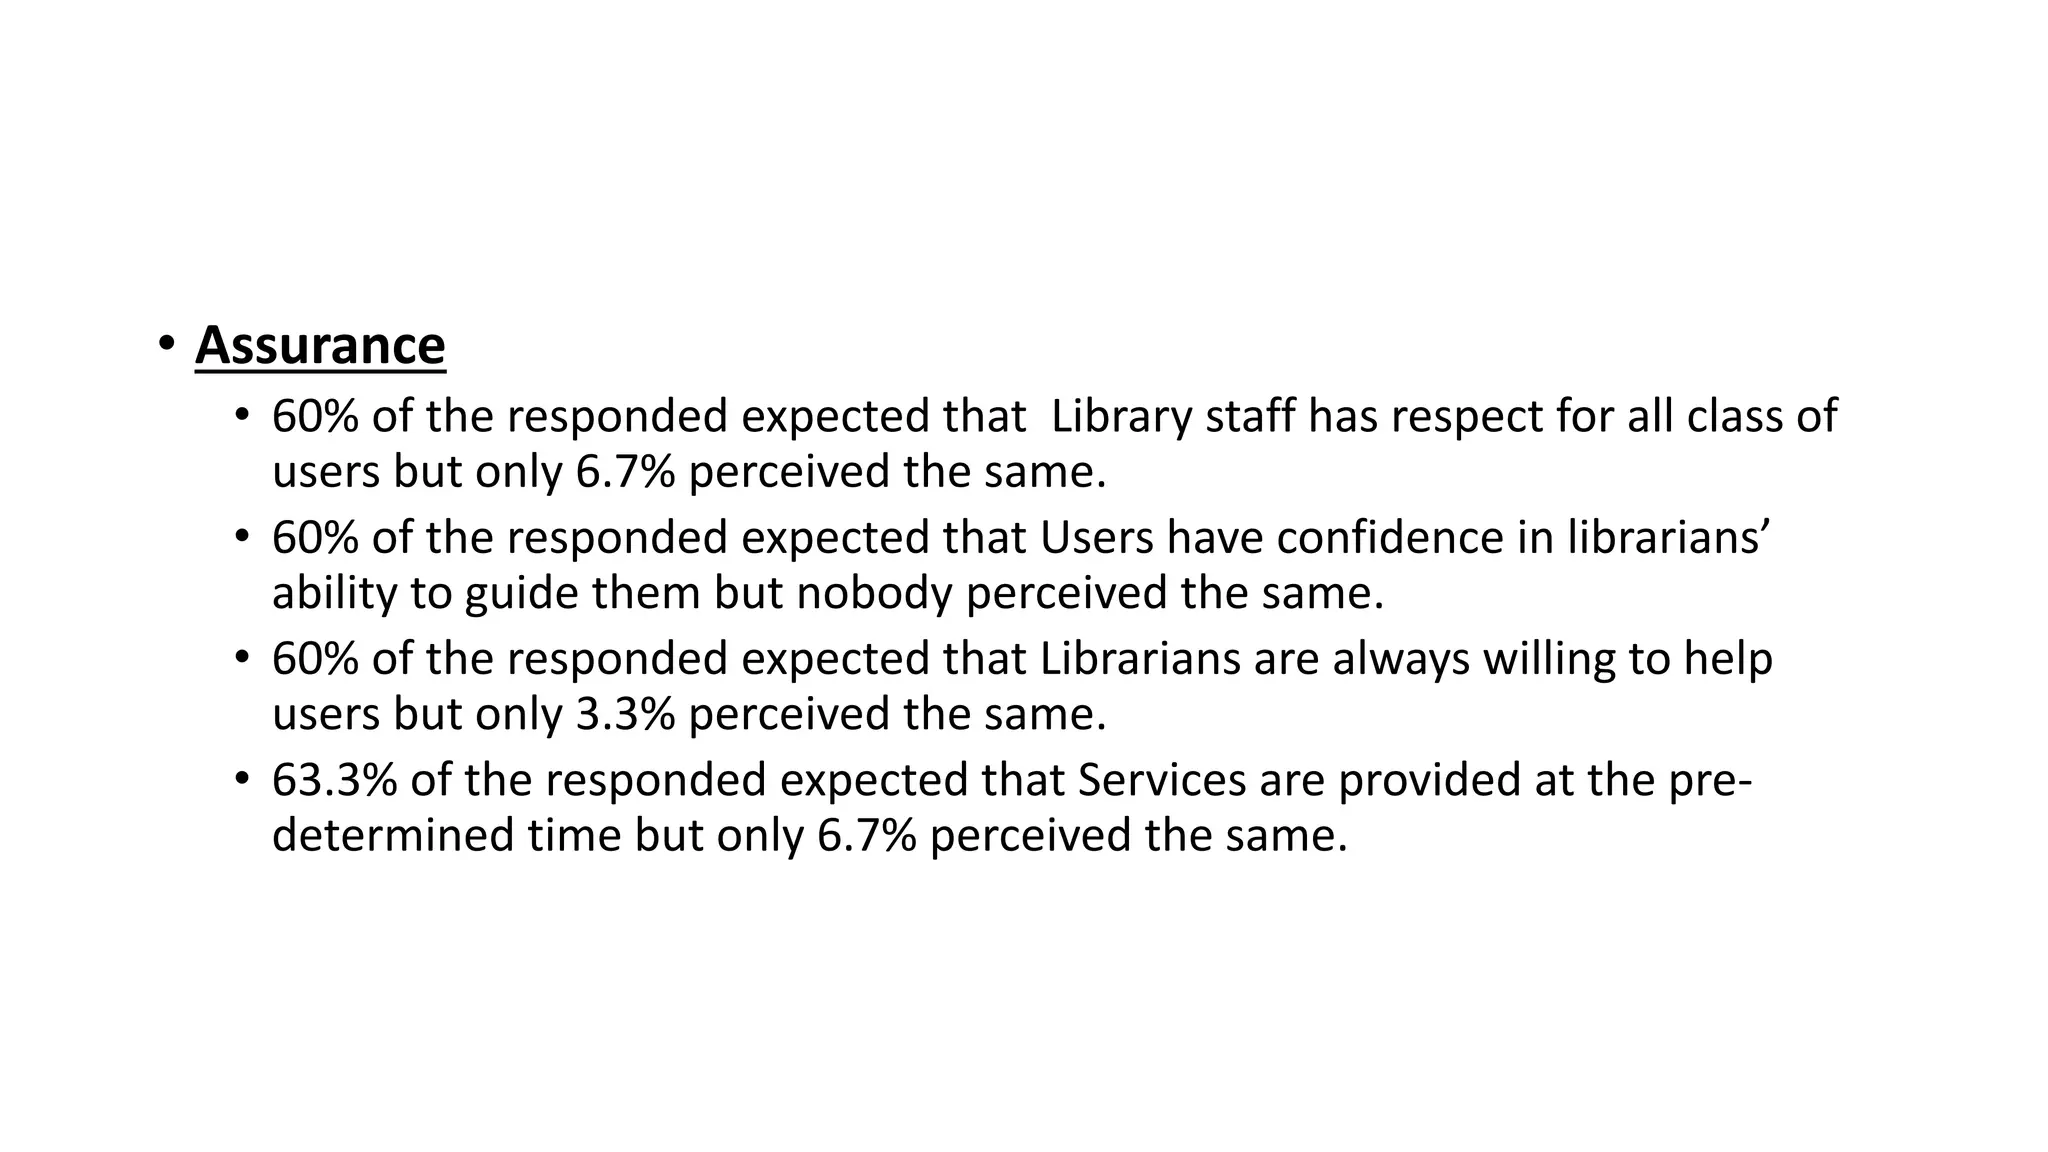
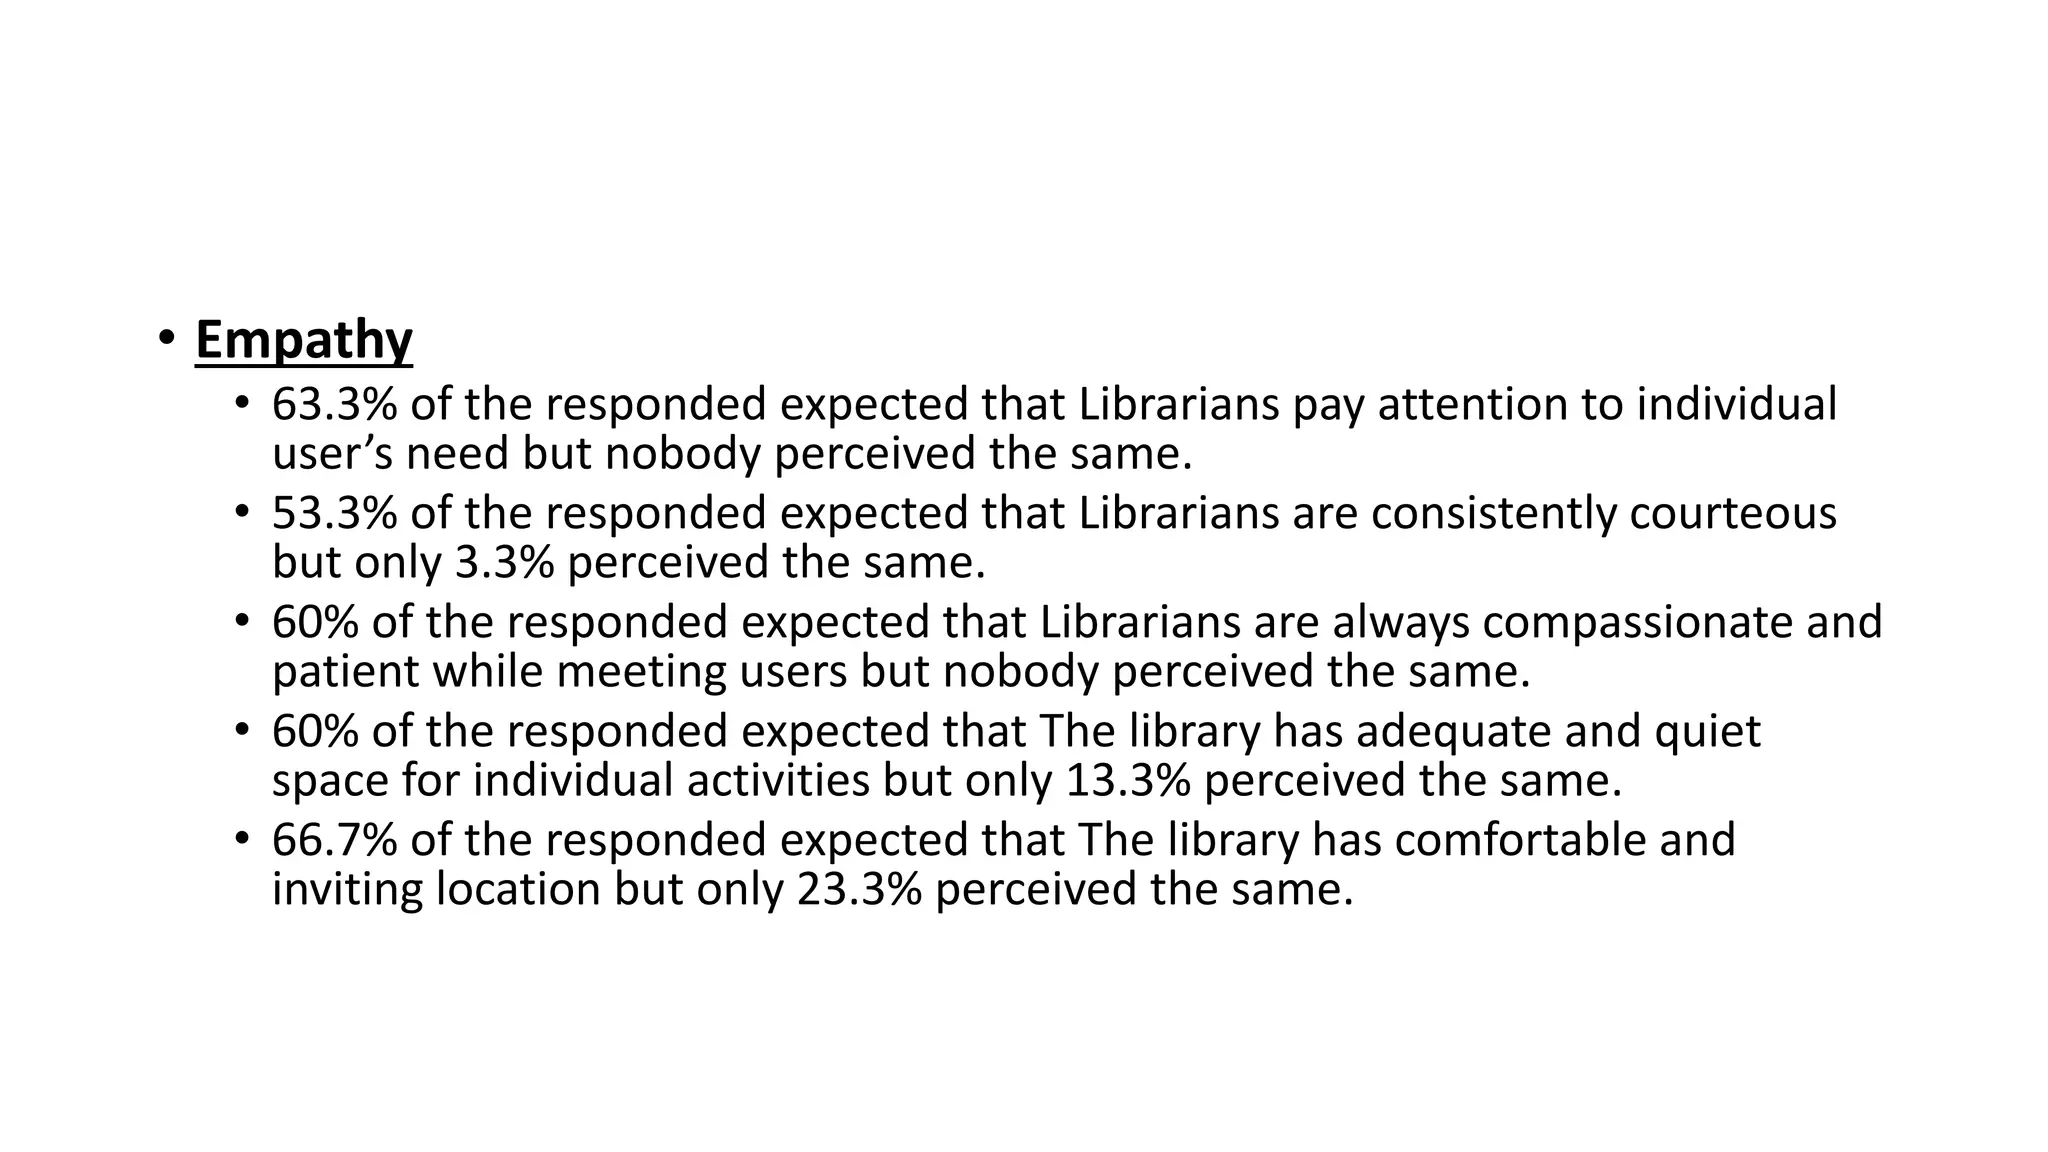
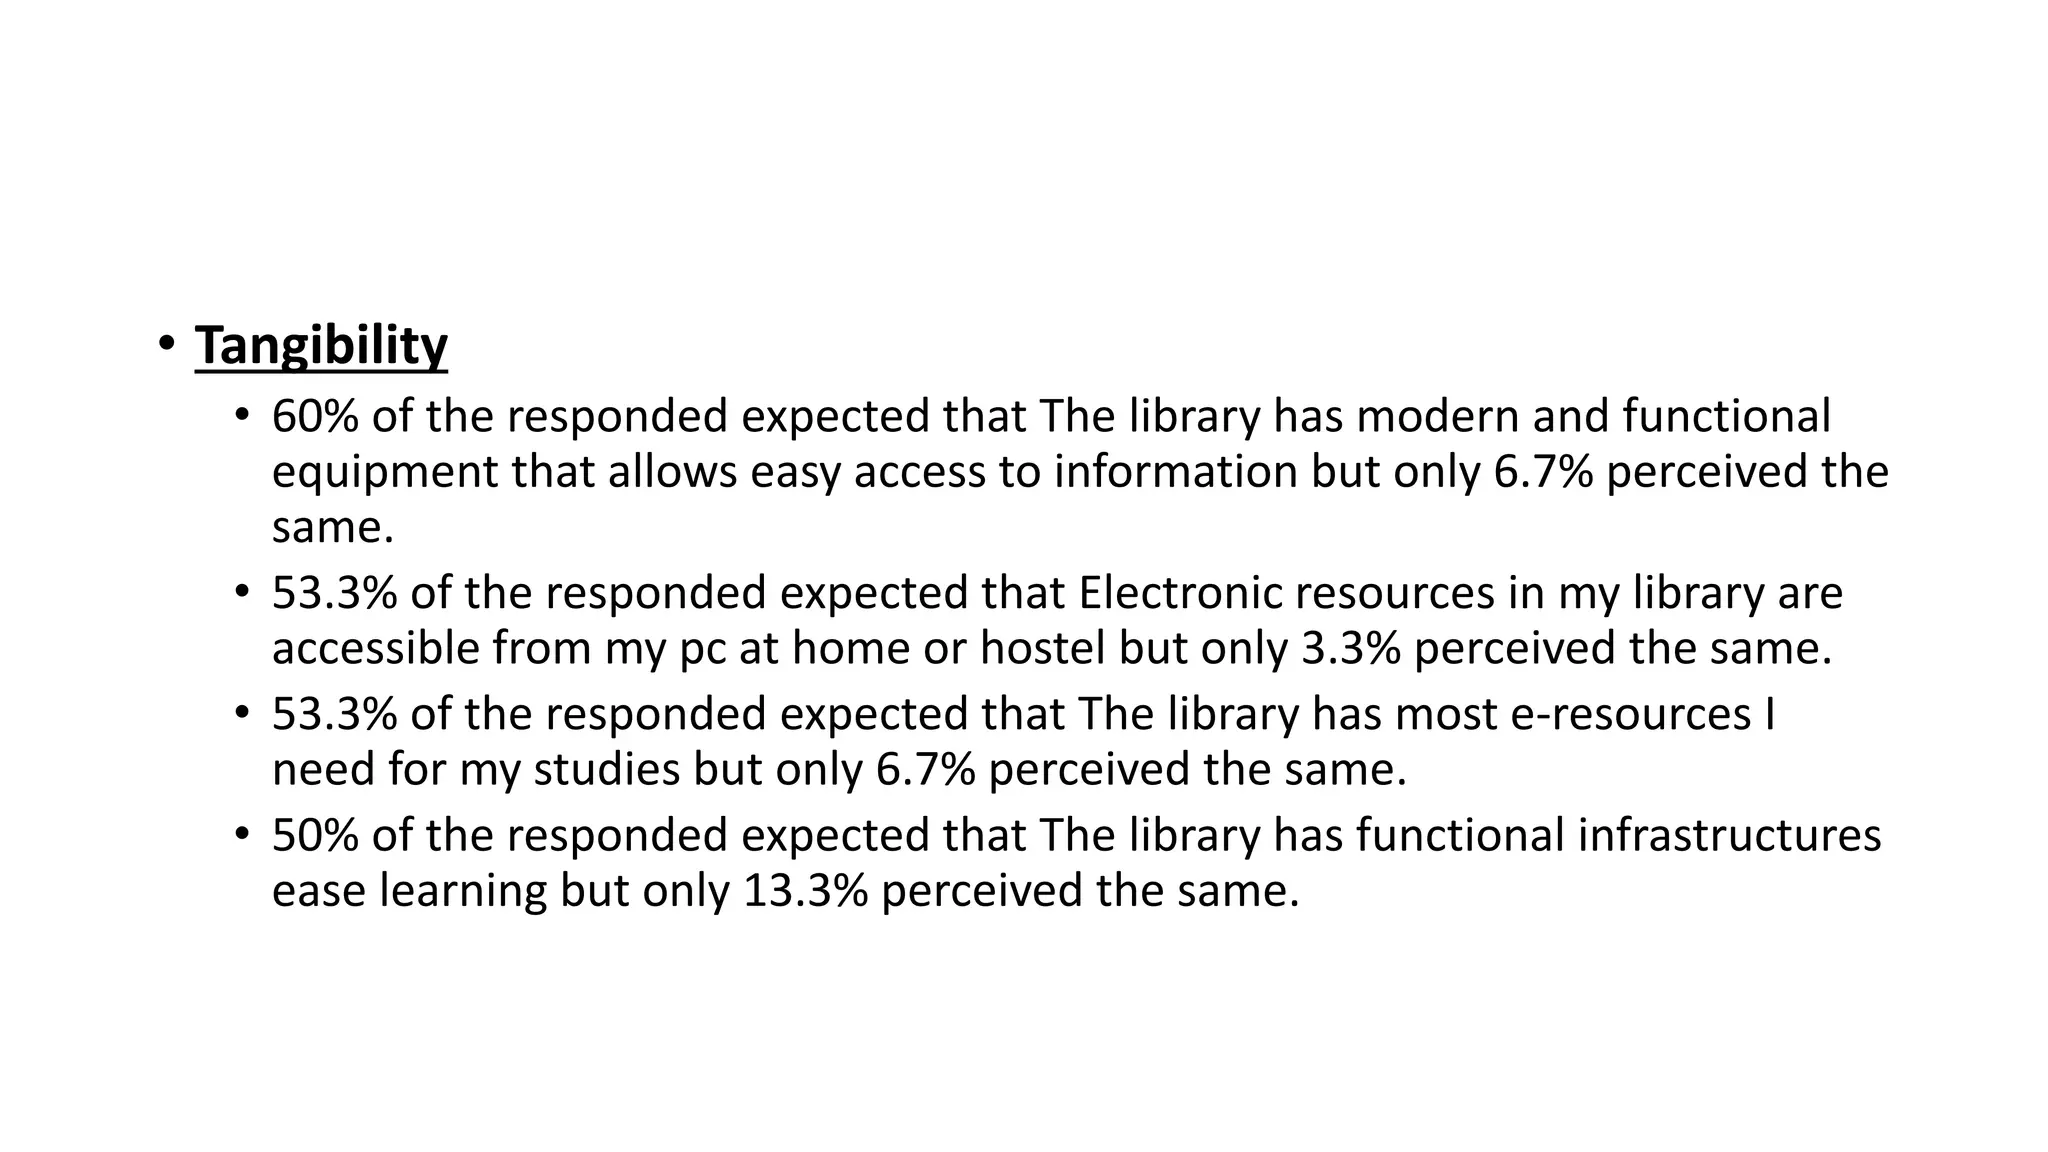
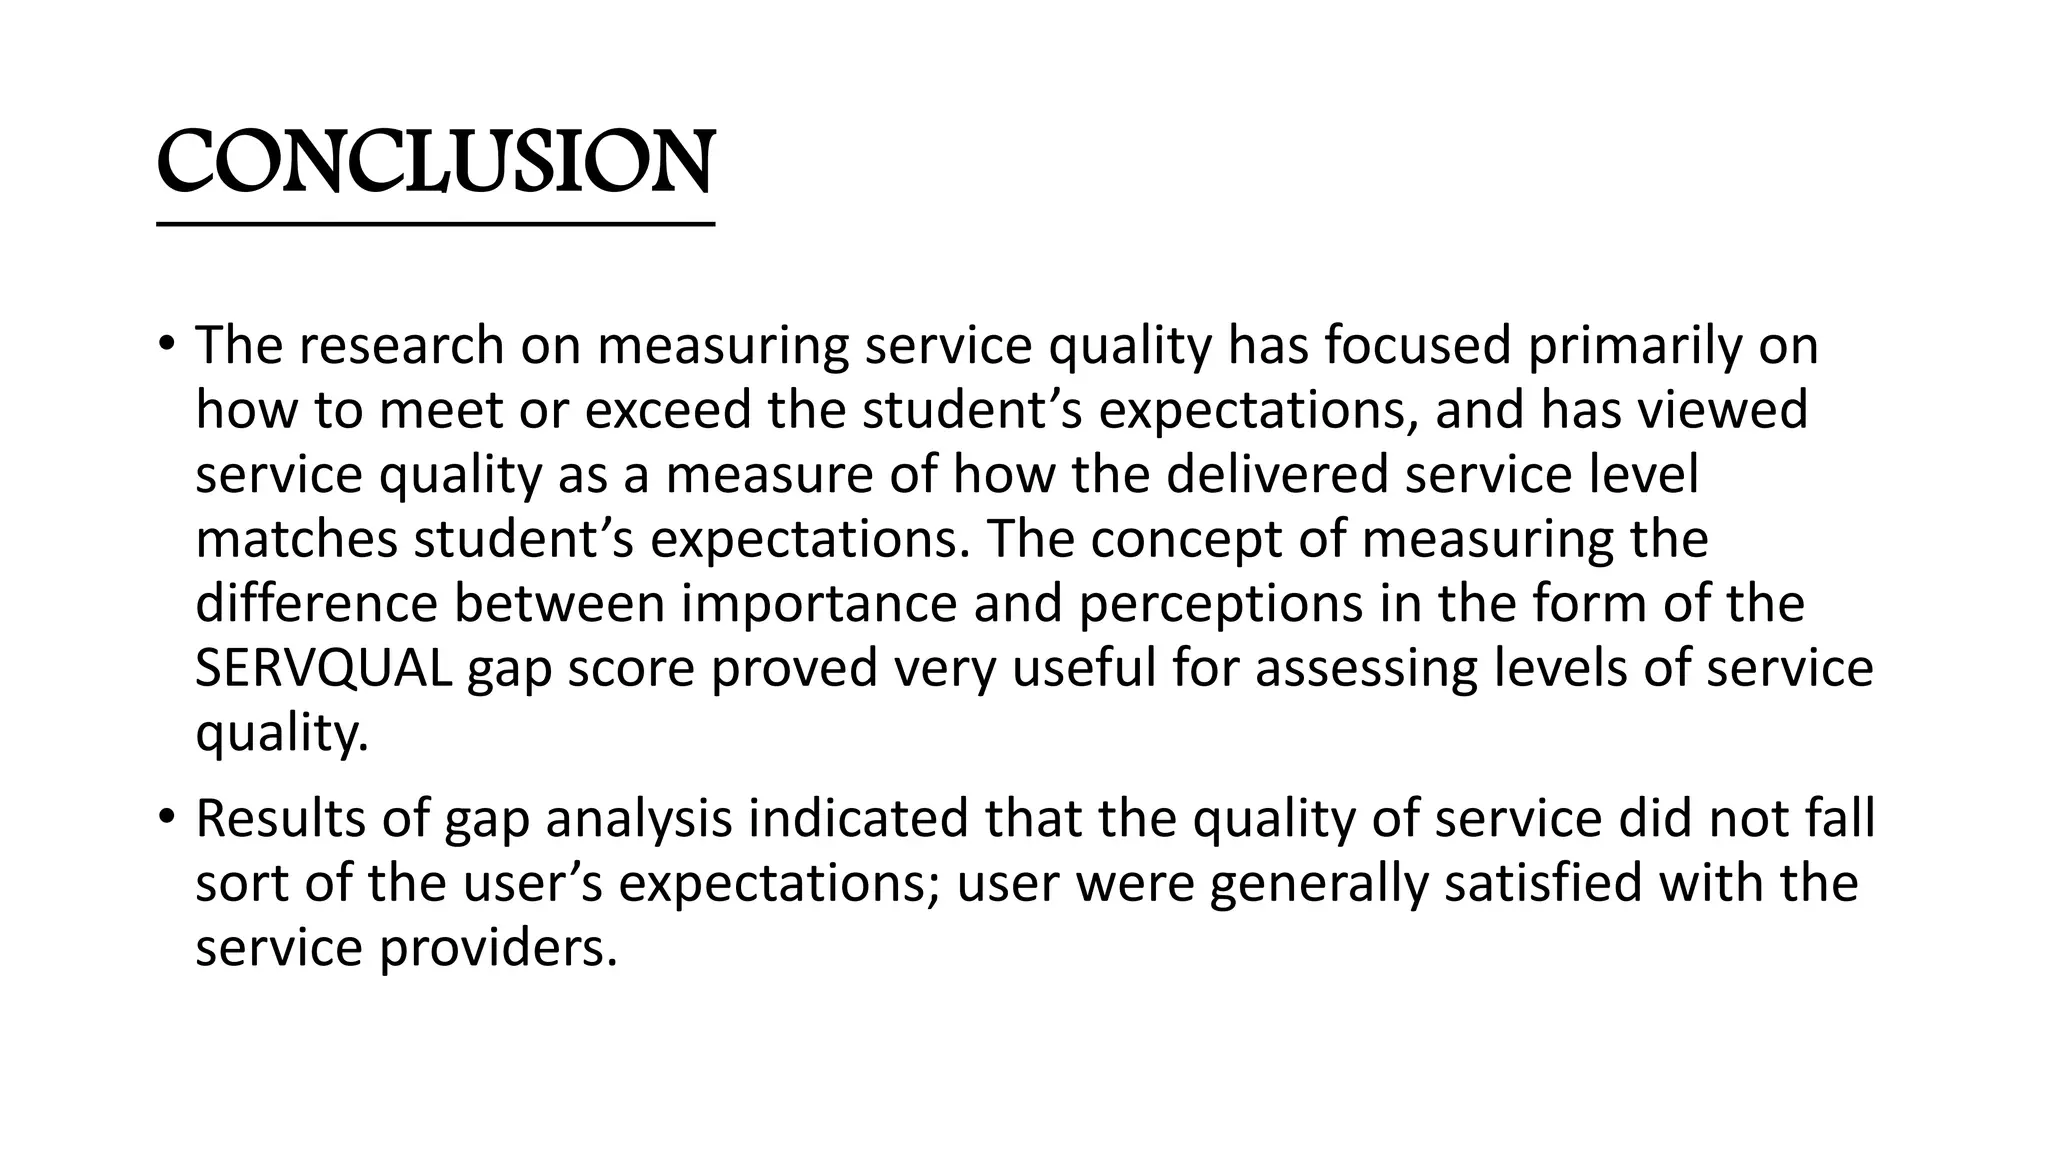
SERVICE QUALITY IN MUJ LIBRARY: An
Assessment
PRESENTED BY:
Harshith V C (140701010)
Reena (140701032)
Ujjwal Anurag (140701004)
Shivraj S. Rathore (140701030)
Ravi Sharma (140701027)
CONTENT
Background of Study
Research Objective
Service Quality and SERVQUAL
Research Methodology
Data Collection
Data Analysis and Interpretation
Findings
Conclusion
BACKGROUND OF THE STUDY
• Student satisfaction is an important measure of service quality in libraries.
• Students’ perceptions about libraries seem to have been largely ignored by
library management in universities.
• The assessment of service quality provides an important feedback for
libraries to assess and improve its service to its users.
• The aim of this study is to develop a reliable and valid instrument measure
student satisfaction in Manipal University Jaipur Library.
• A questionnaire to measure the service quality of university libraries was
used and a total of 30 students were interviewed.
• The instrument of the student satisfaction developed in this study provides
insights to the researchers who study the improvement of student
satisfaction with service quality of university libraries and decision markers.
OBJECTIVE OF THE STUDY
• To identify the underlying dimensions of service quality of Manipal
University Jaipur Library.
• To Determine the best predictor of overall service quality of Manipal
University Jaipur Library System.
Gap 1 – Listening Gap: Difference between customer expectation of
the service and service provider’s understanding of them.
Gap 2 – Design Gap: Difference between service provider’s
understanding of the customer’s expectation and development of
customer driven services design & standards.
Gap 3 – Delivery Gap: It is the discrepancy between development of
customer driven services design and standards and actual service
performance.
Gap 4 – Communication Gap: It is the difference between service
delivery and service provider’s external communication
Gap 5 – Customer Gap: It is the difference between customer’s
expectation and perception of the service quality.
THE SERVQUAL GAPS
GAP 1: Not knowing what
customers expect
GAP 2: wrong service
quality standards
GAP 3: The service
performance gap
GAP 4: promises do not
match actual delivery
GAP 5: The difference
between customer
perception and
expectation
Reliability
Responsiv
eness
Assurance
Empathy
Tangibles
Ability to perform services
accurately and appropriately
Willing to help and respond
to customer needs
Ability of employees to
inspire confidence and trust
The extent to which caring
individualized services is
given
Physical facilities, staff
appearance, equipments
Expected
and
Perceived
Service
SERVQUAL
Research Method
• Surveys have been used as a tool to assess service quality and users satisfaction.
• Both primary and secondary processes were employed. Secondary data was collected
from websites and research articles and journals in library.
• A survey was conducted through structured ServQUAL standard questionnaire
comprising 22-item questions.
• The items in the questionnaire were in line with Parasuraman et al. , recommendations
as follows:
• Questions 1 - 5 were used to measure reliability or the ability of university
library to perform promised services dependably and accurately.
• Questions 6 - 9 were used to measure responsiveness or the willingness of
librarians to provide prompt services.
• Questions 10 – 13 measured assurance or the ability of librarians to inspire
trust and confidence in library users.
• Questions 14 – 18 used five items/indicators to measure empathy or the
amount of caring and individualized attention to library clients.
• Questions 19 - 22 measured tangibility or the physical facilities, equipment
and personnel in the library
Dimensions Scale
Reliability 5
Responsiveness 4
Assurance 4
Empathy 5
Tangibles 4
• Basic statistical techniques such as mean, standard deviation and z-
value are calculated to observe the pattern and gaps.
Data Analysis and Interpretation
Data Analysis
• How Often have you visited the library?
0%10%
10%
3%
77%
None Once
2-5 times 6-10 times
more than 11 times
Questionnaire: https://docs.google.com/forms/d/18-0xqRwaVn-LhD7A0btELs_JLCitXURVHLPyd0lGx-8/viewform
Mean score of expectation and perception
Expectation Scores Perception Scores
Average Average
Reliability 4.27 2.89
Responsiveness 4.33 2.83
Assurance 4.26 2.82
Empathy 4.27 2.83
Tangibles 4.11 2.75
Overall 4.25 2.82
 Responsiveness has the
highest expectation score
across all segments. This
leads us to believe that
students want prompt
services and other
responses.
 On the other hand,
Tangible aspects are least
important in the eyes of
students as compared to
others.
Gap analysis on the basis of z-score for total
sample Avg
Expectation
Avg
Perception
Avg Gap Standard
Deviation
z-score
Reliability 4.27 2.89 -1.38 0.98 -5.08
Responsiven
ess
4.33 2.83 -1.50 1.06 -4.79
Assurance 4.26 2.82 -1.44 1.02 -4.88
Empathy 4.27 2.83 -1.44 1.02 -4.90
Tangibles 4.11 2.75 -1.36 0.96 -4.98
Overall 4.25 2.82 -1.42 1.01 -4.93
 We find that maximum z-scores occurs at Reliability and Tangibility. This
means these factors are having least efficiency as far as meeting student’s
demand is concerned.
 The standard deviation of Tangibles is least which means almost everyone is
rating its performance at similar level.
FINDINGS
• Reliability:
• 53.3% of the responded expected that library has access tools that allow users to find
things on their own, but NOBODY received the services they were expecting.
• 50% of the responded expecting the confidence in librarians’ ability in handling their
problems, and only 6.7% received the services.
• 50% of the responded expected to feel secure and relaxed while interacting with the
librarians , and only 3.3% feel secure and relaxed while interacting with the librarians
• 63.3% of the responded expected that library opens at the appropriate time and only
23.3% perceived the same.
• 70% of the responded expected that they will be well informed about the time of
receiving their services and 20% perceived the same
• Responsiveness
• 60% of the responded expected that Users’ records are appropriately kept
and maintained but only 6.7% perceived the same.
• 56.7% of the responded expected that the library has functional facilities that
inspires study and learning and only 3.3% perceived the same.
• 66.7% of the responded expected that Librarians are always available to
respond to users’ needs but only 3.3% perceived the same.
• 60% of the responded expected Librarians are competence in solving users
problems and only 3.3% perceived the same.
• Assurance
• 60% of the responded expected that Library staff has respect for all class of
users but only 6.7% perceived the same.
• 60% of the responded expected that Users have confidence in librarians’
ability to guide them but nobody perceived the same.
• 60% of the responded expected that Librarians are always willing to help
users but only 3.3% perceived the same.
• 63.3% of the responded expected that Services are provided at the pre-
determined time but only 6.7% perceived the same.
• Empathy
• 63.3% of the responded expected that Librarians pay attention to individual
user’s need but nobody perceived the same.
• 53.3% of the responded expected that Librarians are consistently courteous
but only 3.3% perceived the same.
• 60% of the responded expected that Librarians are always compassionate and
patient while meeting users but nobody perceived the same.
• 60% of the responded expected that The library has adequate and quiet
space for individual activities but only 13.3% perceived the same.
• 66.7% of the responded expected that The library has comfortable and
inviting location but only 23.3% perceived the same.
• Tangibility
• 60% of the responded expected that The library has modern and functional
equipment that allows easy access to information but only 6.7% perceived the
same.
• 53.3% of the responded expected that Electronic resources in my library are
accessible from my pc at home or hostel but only 3.3% perceived the same.
• 53.3% of the responded expected that The library has most e-resources I
need for my studies but only 6.7% perceived the same.
• 50% of the responded expected that The library has functional infrastructures
ease learning but only 13.3% perceived the same.
CONCLUSION
• The research on measuring service quality has focused primarily on
how to meet or exceed the student’s expectations, and has viewed
service quality as a measure of how the delivered service level
matches student’s expectations. The concept of measuring the
difference between importance and perceptions in the form of the
SERVQUAL gap score proved very useful for assessing levels of service
quality.
• Results of gap analysis indicated that the quality of service did not fall
sort of the user’s expectations; user were generally satisfied with the
service providers.
THANK YOU

Mos servqual model

  • 1.
    SERVICE QUALITY INMUJ LIBRARY: An Assessment PRESENTED BY: Harshith V C (140701010) Reena (140701032) Ujjwal Anurag (140701004) Shivraj S. Rathore (140701030) Ravi Sharma (140701027)
  • 2.
    CONTENT Background of Study ResearchObjective Service Quality and SERVQUAL Research Methodology Data Collection Data Analysis and Interpretation Findings Conclusion
  • 3.
    BACKGROUND OF THESTUDY • Student satisfaction is an important measure of service quality in libraries. • Students’ perceptions about libraries seem to have been largely ignored by library management in universities. • The assessment of service quality provides an important feedback for libraries to assess and improve its service to its users. • The aim of this study is to develop a reliable and valid instrument measure student satisfaction in Manipal University Jaipur Library. • A questionnaire to measure the service quality of university libraries was used and a total of 30 students were interviewed. • The instrument of the student satisfaction developed in this study provides insights to the researchers who study the improvement of student satisfaction with service quality of university libraries and decision markers.
  • 4.
    OBJECTIVE OF THESTUDY • To identify the underlying dimensions of service quality of Manipal University Jaipur Library. • To Determine the best predictor of overall service quality of Manipal University Jaipur Library System.
  • 5.
    Gap 1 –Listening Gap: Difference between customer expectation of the service and service provider’s understanding of them. Gap 2 – Design Gap: Difference between service provider’s understanding of the customer’s expectation and development of customer driven services design & standards. Gap 3 – Delivery Gap: It is the discrepancy between development of customer driven services design and standards and actual service performance. Gap 4 – Communication Gap: It is the difference between service delivery and service provider’s external communication Gap 5 – Customer Gap: It is the difference between customer’s expectation and perception of the service quality. THE SERVQUAL GAPS
  • 6.
    GAP 1: Notknowing what customers expect GAP 2: wrong service quality standards GAP 3: The service performance gap GAP 4: promises do not match actual delivery GAP 5: The difference between customer perception and expectation
  • 7.
    Reliability Responsiv eness Assurance Empathy Tangibles Ability to performservices accurately and appropriately Willing to help and respond to customer needs Ability of employees to inspire confidence and trust The extent to which caring individualized services is given Physical facilities, staff appearance, equipments Expected and Perceived Service SERVQUAL
  • 8.
    Research Method • Surveyshave been used as a tool to assess service quality and users satisfaction. • Both primary and secondary processes were employed. Secondary data was collected from websites and research articles and journals in library. • A survey was conducted through structured ServQUAL standard questionnaire comprising 22-item questions. • The items in the questionnaire were in line with Parasuraman et al. , recommendations as follows: • Questions 1 - 5 were used to measure reliability or the ability of university library to perform promised services dependably and accurately. • Questions 6 - 9 were used to measure responsiveness or the willingness of librarians to provide prompt services. • Questions 10 – 13 measured assurance or the ability of librarians to inspire trust and confidence in library users. • Questions 14 – 18 used five items/indicators to measure empathy or the amount of caring and individualized attention to library clients. • Questions 19 - 22 measured tangibility or the physical facilities, equipment and personnel in the library Dimensions Scale Reliability 5 Responsiveness 4 Assurance 4 Empathy 5 Tangibles 4
  • 9.
    • Basic statisticaltechniques such as mean, standard deviation and z- value are calculated to observe the pattern and gaps. Data Analysis and Interpretation
  • 10.
    Data Analysis • HowOften have you visited the library? 0%10% 10% 3% 77% None Once 2-5 times 6-10 times more than 11 times Questionnaire: https://docs.google.com/forms/d/18-0xqRwaVn-LhD7A0btELs_JLCitXURVHLPyd0lGx-8/viewform
  • 11.
    Mean score ofexpectation and perception Expectation Scores Perception Scores Average Average Reliability 4.27 2.89 Responsiveness 4.33 2.83 Assurance 4.26 2.82 Empathy 4.27 2.83 Tangibles 4.11 2.75 Overall 4.25 2.82  Responsiveness has the highest expectation score across all segments. This leads us to believe that students want prompt services and other responses.  On the other hand, Tangible aspects are least important in the eyes of students as compared to others.
  • 12.
    Gap analysis onthe basis of z-score for total sample Avg Expectation Avg Perception Avg Gap Standard Deviation z-score Reliability 4.27 2.89 -1.38 0.98 -5.08 Responsiven ess 4.33 2.83 -1.50 1.06 -4.79 Assurance 4.26 2.82 -1.44 1.02 -4.88 Empathy 4.27 2.83 -1.44 1.02 -4.90 Tangibles 4.11 2.75 -1.36 0.96 -4.98 Overall 4.25 2.82 -1.42 1.01 -4.93  We find that maximum z-scores occurs at Reliability and Tangibility. This means these factors are having least efficiency as far as meeting student’s demand is concerned.  The standard deviation of Tangibles is least which means almost everyone is rating its performance at similar level.
  • 13.
    FINDINGS • Reliability: • 53.3%of the responded expected that library has access tools that allow users to find things on their own, but NOBODY received the services they were expecting. • 50% of the responded expecting the confidence in librarians’ ability in handling their problems, and only 6.7% received the services. • 50% of the responded expected to feel secure and relaxed while interacting with the librarians , and only 3.3% feel secure and relaxed while interacting with the librarians • 63.3% of the responded expected that library opens at the appropriate time and only 23.3% perceived the same. • 70% of the responded expected that they will be well informed about the time of receiving their services and 20% perceived the same
  • 14.
    • Responsiveness • 60%of the responded expected that Users’ records are appropriately kept and maintained but only 6.7% perceived the same. • 56.7% of the responded expected that the library has functional facilities that inspires study and learning and only 3.3% perceived the same. • 66.7% of the responded expected that Librarians are always available to respond to users’ needs but only 3.3% perceived the same. • 60% of the responded expected Librarians are competence in solving users problems and only 3.3% perceived the same.
  • 15.
    • Assurance • 60%of the responded expected that Library staff has respect for all class of users but only 6.7% perceived the same. • 60% of the responded expected that Users have confidence in librarians’ ability to guide them but nobody perceived the same. • 60% of the responded expected that Librarians are always willing to help users but only 3.3% perceived the same. • 63.3% of the responded expected that Services are provided at the pre- determined time but only 6.7% perceived the same.
  • 16.
    • Empathy • 63.3%of the responded expected that Librarians pay attention to individual user’s need but nobody perceived the same. • 53.3% of the responded expected that Librarians are consistently courteous but only 3.3% perceived the same. • 60% of the responded expected that Librarians are always compassionate and patient while meeting users but nobody perceived the same. • 60% of the responded expected that The library has adequate and quiet space for individual activities but only 13.3% perceived the same. • 66.7% of the responded expected that The library has comfortable and inviting location but only 23.3% perceived the same.
  • 17.
    • Tangibility • 60%of the responded expected that The library has modern and functional equipment that allows easy access to information but only 6.7% perceived the same. • 53.3% of the responded expected that Electronic resources in my library are accessible from my pc at home or hostel but only 3.3% perceived the same. • 53.3% of the responded expected that The library has most e-resources I need for my studies but only 6.7% perceived the same. • 50% of the responded expected that The library has functional infrastructures ease learning but only 13.3% perceived the same.
  • 18.
    CONCLUSION • The researchon measuring service quality has focused primarily on how to meet or exceed the student’s expectations, and has viewed service quality as a measure of how the delivered service level matches student’s expectations. The concept of measuring the difference between importance and perceptions in the form of the SERVQUAL gap score proved very useful for assessing levels of service quality. • Results of gap analysis indicated that the quality of service did not fall sort of the user’s expectations; user were generally satisfied with the service providers.
  • 19.