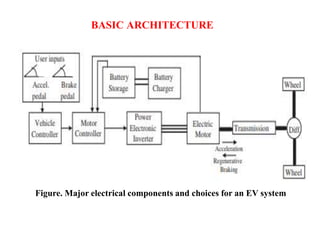
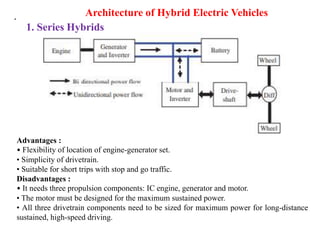
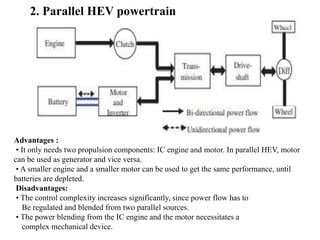
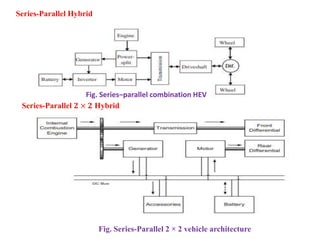
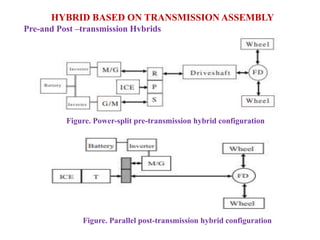
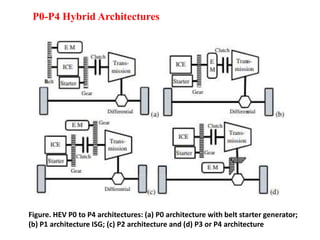
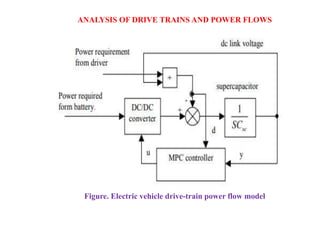
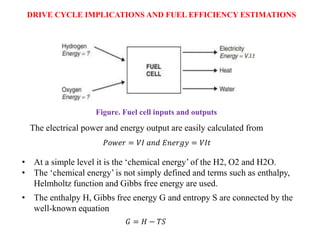
20EE603PE-ELECTRIC VEHICLES
UNIT-II
HYBRID POWER TRAIN TOPOLOGYAND DYNAMICS
CONTENT
 Introduction to Basic architecture
 Architecture of Hybrid Electric Vehicles
 Hybrid based on Transmission Assembly
 Analysis of drive trains and power flows
 Drive cycle implications and fuel efficiency estimations
 Sizing of components for different hybrid drive train topologies
 Topologies for electric drive train
 Fuel efficiency estimations and wheel to wheel fuel efficiency
analysis
 Sizing of components for different electric drive train topologies
BASIC ARCHITECTURE
Figure. Major electrical components and choices for an EV system
. Architecture of Hybrid Electric Vehicles
1. Series Hybrids
Advantages :
• Flexibility of location of engine-generator set.
• Simplicity of drivetrain.
• Suitable for short trips with stop and go traffic.
Disadvantages :
• It needs three propulsion components: IC engine, generator and motor.
• The motor must be designed for the maximum sustained power.
• All three drivetrain components need to be sized for maximum power for long-distance
sustained, high-speed driving.
2. Parallel HEV powertrain
Advantages :
• It only needs two propulsion components: IC engine and motor. In parallel HEV, motor
can be used as generator and vice versa.
• A smaller engine and a smaller motor can be used to get the same performance, until
batteries are depleted.
Disadvantages:
• The control complexity increases significantly, since power flow has to
Be regulated and blended from two parallel sources.
• The power blending from the IC engine and the motor necessitates a
complex mechanical device.
Series-Parallel Hybrid
Fig. Series–parallel combination HEV
Series-Parallel 𝟐 × 𝟐 Hybrid
Fig. Series-Parallel 2 × 2 vehicle architecture
HYBRID BASED ON TRANSMISSION ASSEMBLY
Pre-and Post –transmission Hybrids
Figure. Power-split pre-transmission hybrid configuration
Figure. Parallel post-transmission hybrid configuration
P0-P4 Hybrid Architectures
Figure. HEV P0 to P4 architectures: (a) P0 architecture with belt starter generator;
(b) P1 architecture ISG; (c) P2 architecture and (d) P3 or P4 architecture
48V Hybrid Architectures
• The 48V architectures are a less disruptive approach of vehicle electrification for
increasing fuel economy and reducing carbon emissions with 48V powertrain
electrification.
Hybrid Based on Degree of Hybridization
• There are three ‘mission-based’ classes: mild hybrids, power hybrids and
energy hybrids.
• The ‘mild’ hybrids have the lowest degree of hybridization with a moderate
effect on fuel economy and emissions.
• The ‘power’ hybrids have a larger electric propulsion component, with an
electrical rating as high as 40 kW; these hybrids allow significant amount
of power transfer between battery and motor drive system, although the
battery storage is designed with relatively low energy capacity (3–4 kWh).
• The ‘energy’ hybrid employs a high-energy battery system capable of
propelling the vehicle for a significant range without engine operation.
• The electrical rating and battery capacity are typically in the ranges of
70–100 kW and 15–20 kWh.
ANALYSIS OF DRIVE TRAINS AND POWER FLOWS
Figure. Electric vehicle drive-train power flow model
DRIVE CYCLE IMPLICATIONS AND FUEL EFFICIENCY ESTIMATIONS
Figure. Fuel cell inputs and outputs
The electrical power and energy output are easily calculated from
𝑃𝑜𝑤𝑒𝑟 = 𝑉𝐼 𝑎𝑛𝑑 𝐸𝑛𝑒𝑟𝑔𝑦 = 𝑉𝐼𝑡
• At a simple level it is the ‘chemical energy’ of the H2, O2 and H2O.
• The ‘chemical energy’ is not simply defined and terms such as enthalpy,
Helmholtz function and Gibbs free energy are used.
• The enthalpy H, Gibbs free energy G and entropy S are connected by the
well-known equation
𝐺 = 𝐻 − 𝑇𝑆
.
• The energy that is released by a fuel cell is the change in Gibbs energy before
and after a reaction – so the energy released can be represented by the equation
∆𝐺 = 𝐺𝑜𝑢𝑡𝑝𝑢𝑡𝑠 −𝐺𝑜𝑖𝑛𝑝𝑢𝑡𝑠
Table. shows ∆𝐺 for the basic hydrogen fuel cell reaction
𝐻2 +
1
2
𝑂2 → = 𝐻2 𝑜
• The efficiency of a fuel cell as
𝑒𝑙𝑒𝑐𝑡𝑟𝑖𝑐𝑎𝑙 𝑒𝑛𝑒𝑟𝑔𝑦 𝑝𝑟𝑜𝑑𝑢𝑐𝑒𝑑
𝐺𝑖𝑏𝑏𝑠 𝑓𝑟𝑒𝑒 𝑒𝑛𝑒𝑟𝑔𝑦 𝑐ℎ𝑎𝑛𝑔𝑒
• This is called the ‘calorific value’, though a more precise description is the change in
‘enthalpy of formation’. Its symbol is ∆H.
• The efficiency of the fuel cell is usually defined as
𝑒𝑙𝑒𝑐𝑡𝑟𝑖𝑐𝑎𝑙 𝑒𝑛𝑒𝑟𝑔𝑦 𝑝𝑟𝑜𝑑𝑢𝑐𝑒𝑑 𝑝𝑒𝑟 𝑚𝑜𝑙𝑒 𝑜𝑓 𝑓𝑢𝑒𝑙
−∆𝐻
Form of Water
product
Temperature
(℃)
∆𝑮 (KJ mol-1)
Liquid 25 -237.2
Liquid 80 -228.2
Gas 80 -226.1
Gas 100 -225.1
Gas 200 -220.4
Gas 400 -210.3
Gas 600 -199.6
Gas 800 -188.6
Gas 1000 -177.4
Table. ∆G for the reaction 𝑯𝟐 +
𝟏
𝟐
𝑶𝟐 → = 𝑯𝟐 𝒐 at various temperatures
For the ‘burning’ of hydrogen
𝐻2 +
1
2
𝑂2 → = 𝐻2 𝑜 (steam)
∆𝐻 =−241.83 kJ mol−1
whereas if the product water is condensed back to liquid, the reaction is
𝐻2 +
1
2
𝑂2 → = 𝐻2 𝑜 (liquid)
∆𝐻 =−285.84 kJ mol−1
𝑀𝑎𝑥𝑖𝑚𝑢𝑚 𝑒𝑓𝑓𝑖𝑐𝑖𝑒𝑛𝑐𝑦 𝑝𝑜𝑠𝑠𝑖𝑏𝑙𝑒 =
∆𝐺
∆𝐻
× 100%
𝑀𝑎𝑥𝑖𝑚𝑢𝑚 𝑒𝑓𝑓𝑖𝑐𝑖𝑒𝑛𝑐𝑦 𝑝𝑜𝑠𝑠𝑖𝑏𝑙𝑒 =
∆𝐺
∆𝐻
× 100%
Figure. The reactions at the electrodes, and the electron movement, in a fuel
cell with an acid electrolyte

UNIT-II-EV.pptx

  • 1.
    20EE603PE-ELECTRIC VEHICLES UNIT-II HYBRID POWERTRAIN TOPOLOGYAND DYNAMICS CONTENT  Introduction to Basic architecture  Architecture of Hybrid Electric Vehicles  Hybrid based on Transmission Assembly  Analysis of drive trains and power flows  Drive cycle implications and fuel efficiency estimations  Sizing of components for different hybrid drive train topologies  Topologies for electric drive train  Fuel efficiency estimations and wheel to wheel fuel efficiency analysis  Sizing of components for different electric drive train topologies
  • 2.
    BASIC ARCHITECTURE Figure. Majorelectrical components and choices for an EV system
  • 3.
    . Architecture ofHybrid Electric Vehicles 1. Series Hybrids Advantages : • Flexibility of location of engine-generator set. • Simplicity of drivetrain. • Suitable for short trips with stop and go traffic. Disadvantages : • It needs three propulsion components: IC engine, generator and motor. • The motor must be designed for the maximum sustained power. • All three drivetrain components need to be sized for maximum power for long-distance sustained, high-speed driving.
  • 4.
    2. Parallel HEVpowertrain Advantages : • It only needs two propulsion components: IC engine and motor. In parallel HEV, motor can be used as generator and vice versa. • A smaller engine and a smaller motor can be used to get the same performance, until batteries are depleted. Disadvantages: • The control complexity increases significantly, since power flow has to Be regulated and blended from two parallel sources. • The power blending from the IC engine and the motor necessitates a complex mechanical device.
  • 5.
    Series-Parallel Hybrid Fig. Series–parallelcombination HEV Series-Parallel 𝟐 × 𝟐 Hybrid Fig. Series-Parallel 2 × 2 vehicle architecture
  • 6.
    HYBRID BASED ONTRANSMISSION ASSEMBLY Pre-and Post –transmission Hybrids Figure. Power-split pre-transmission hybrid configuration Figure. Parallel post-transmission hybrid configuration
  • 7.
    P0-P4 Hybrid Architectures Figure.HEV P0 to P4 architectures: (a) P0 architecture with belt starter generator; (b) P1 architecture ISG; (c) P2 architecture and (d) P3 or P4 architecture
  • 8.
    48V Hybrid Architectures •The 48V architectures are a less disruptive approach of vehicle electrification for increasing fuel economy and reducing carbon emissions with 48V powertrain electrification. Hybrid Based on Degree of Hybridization • There are three ‘mission-based’ classes: mild hybrids, power hybrids and energy hybrids. • The ‘mild’ hybrids have the lowest degree of hybridization with a moderate effect on fuel economy and emissions. • The ‘power’ hybrids have a larger electric propulsion component, with an electrical rating as high as 40 kW; these hybrids allow significant amount of power transfer between battery and motor drive system, although the battery storage is designed with relatively low energy capacity (3–4 kWh). • The ‘energy’ hybrid employs a high-energy battery system capable of propelling the vehicle for a significant range without engine operation. • The electrical rating and battery capacity are typically in the ranges of 70–100 kW and 15–20 kWh.
  • 9.
    ANALYSIS OF DRIVETRAINS AND POWER FLOWS Figure. Electric vehicle drive-train power flow model
  • 10.
    DRIVE CYCLE IMPLICATIONSAND FUEL EFFICIENCY ESTIMATIONS Figure. Fuel cell inputs and outputs The electrical power and energy output are easily calculated from 𝑃𝑜𝑤𝑒𝑟 = 𝑉𝐼 𝑎𝑛𝑑 𝐸𝑛𝑒𝑟𝑔𝑦 = 𝑉𝐼𝑡 • At a simple level it is the ‘chemical energy’ of the H2, O2 and H2O. • The ‘chemical energy’ is not simply defined and terms such as enthalpy, Helmholtz function and Gibbs free energy are used. • The enthalpy H, Gibbs free energy G and entropy S are connected by the well-known equation 𝐺 = 𝐻 − 𝑇𝑆
  • 11.
    . • The energythat is released by a fuel cell is the change in Gibbs energy before and after a reaction – so the energy released can be represented by the equation ∆𝐺 = 𝐺𝑜𝑢𝑡𝑝𝑢𝑡𝑠 −𝐺𝑜𝑖𝑛𝑝𝑢𝑡𝑠 Table. shows ∆𝐺 for the basic hydrogen fuel cell reaction 𝐻2 + 1 2 𝑂2 → = 𝐻2 𝑜 • The efficiency of a fuel cell as 𝑒𝑙𝑒𝑐𝑡𝑟𝑖𝑐𝑎𝑙 𝑒𝑛𝑒𝑟𝑔𝑦 𝑝𝑟𝑜𝑑𝑢𝑐𝑒𝑑 𝐺𝑖𝑏𝑏𝑠 𝑓𝑟𝑒𝑒 𝑒𝑛𝑒𝑟𝑔𝑦 𝑐ℎ𝑎𝑛𝑔𝑒 • This is called the ‘calorific value’, though a more precise description is the change in ‘enthalpy of formation’. Its symbol is ∆H. • The efficiency of the fuel cell is usually defined as 𝑒𝑙𝑒𝑐𝑡𝑟𝑖𝑐𝑎𝑙 𝑒𝑛𝑒𝑟𝑔𝑦 𝑝𝑟𝑜𝑑𝑢𝑐𝑒𝑑 𝑝𝑒𝑟 𝑚𝑜𝑙𝑒 𝑜𝑓 𝑓𝑢𝑒𝑙 −∆𝐻
  • 12.
    Form of Water product Temperature (℃) ∆𝑮(KJ mol-1) Liquid 25 -237.2 Liquid 80 -228.2 Gas 80 -226.1 Gas 100 -225.1 Gas 200 -220.4 Gas 400 -210.3 Gas 600 -199.6 Gas 800 -188.6 Gas 1000 -177.4 Table. ∆G for the reaction 𝑯𝟐 + 𝟏 𝟐 𝑶𝟐 → = 𝑯𝟐 𝒐 at various temperatures For the ‘burning’ of hydrogen 𝐻2 + 1 2 𝑂2 → = 𝐻2 𝑜 (steam) ∆𝐻 =−241.83 kJ mol−1
  • 13.
    whereas if theproduct water is condensed back to liquid, the reaction is 𝐻2 + 1 2 𝑂2 → = 𝐻2 𝑜 (liquid) ∆𝐻 =−285.84 kJ mol−1 𝑀𝑎𝑥𝑖𝑚𝑢𝑚 𝑒𝑓𝑓𝑖𝑐𝑖𝑒𝑛𝑐𝑦 𝑝𝑜𝑠𝑠𝑖𝑏𝑙𝑒 = ∆𝐺 ∆𝐻 × 100% 𝑀𝑎𝑥𝑖𝑚𝑢𝑚 𝑒𝑓𝑓𝑖𝑐𝑖𝑒𝑛𝑐𝑦 𝑝𝑜𝑠𝑠𝑖𝑏𝑙𝑒 = ∆𝐺 ∆𝐻 × 100% Figure. The reactions at the electrodes, and the electron movement, in a fuel cell with an acid electrolyte